Download to read offline
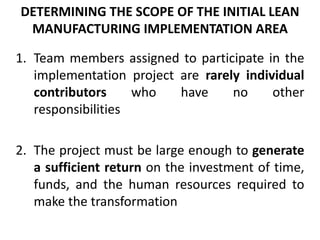
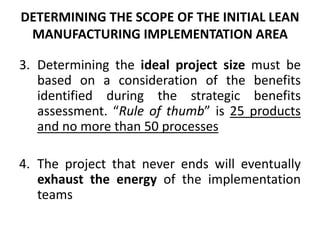
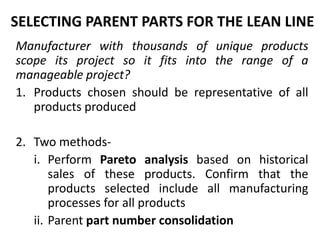
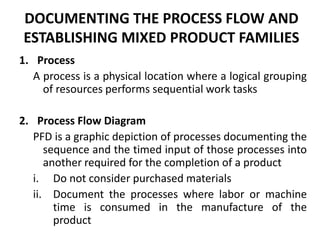
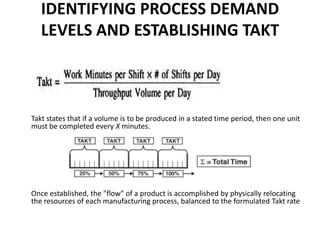

The document discusses determining the scope of an initial lean manufacturing implementation project. It recommends that the project be large enough to generate return on investment but also manageable in size, ideally involving 25 products and 50 processes. Two methods are described for selecting representative parent parts: Pareto analysis of historical sales or consolidating part numbers to capture all manufacturing processes. The document also covers establishing production capacity, determining demand sources, documenting process flows, and calculating takt time to balance resources to the required production rate.


