Left atrial enlargement
BurnsE. Left Atrial Enlargement (April 16, 2017). Retrieved from
https://lifeinthefastlane.com/ecg-library/basics/left-atrial-enlargement/
3.
Left atrial enlargement
Leftatrial enlargement (LAE) is due to
pressure or volume overload of the
left atrium.
It is often a precursor to atrial
fibrillation!!!
PowerPlugs Templates for PowerPoint Preview 3
4.
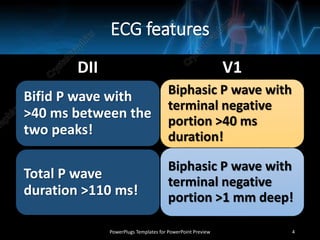
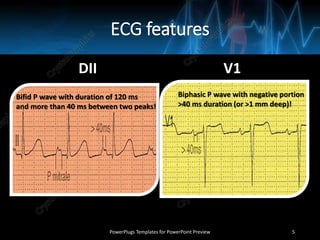
ECG features
DII
Bifid Pwave with
>40 ms between the
two peaks!
Total P wave
duration >110 ms!
V1
Biphasic P wave with
terminal negative
portion >40 ms
duration!
Biphasic P wave with
terminal negative
portion >1 mm deep!
PowerPlugs Templates for PowerPoint Preview 4
5.
ECG features
DII V1
PowerPlugsTemplates for PowerPoint Preview 5
Bifid P wave with duration of 120 ms
and more than 40 ms between two peaks!
Biphasic P wave with negative portion
>40 ms duration (or >1 mm deep)!
Left Anterior FascicularBlock
Burns E. Left Anterior Fascicular Block (April 16, 2017). Retrieved from
https://lifeinthefastlane.com/ecg-library/basics/left-anterior-fascicular-block/
PowerPlugs Templates for PowerPoint Preview 7
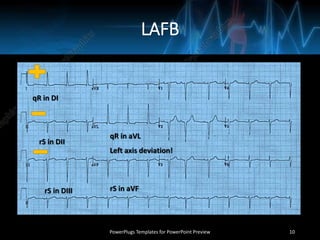
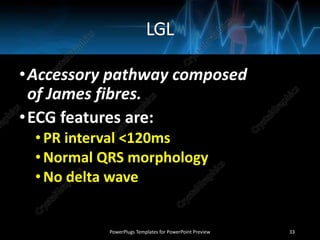
LAFB
PowerPlugs Templates forPowerPoint Preview 10
Left axis deviation!
qR in DI
rS in DII
rS in DIII
qR in aVL
rS in aVF
11.
Left Bundle BranchBlock
Burns E. Left Bundle Branch Block (April 16, 2017). Retrieved from
https://lifeinthefastlane.com/ecg-library/basics/left-bundle-branch-block/
PowerPlugs Templates for PowerPoint Preview 11
12.
LBBB
•In LBBB, thenormal direction of
septal depolarisation is reversed
(becomes right to left), as the
impulse spreads first to the right
ventricle via the right bundle
branch and then to the left ventricle
via the septum.
PowerPlugs Templates for PowerPoint Preview 12
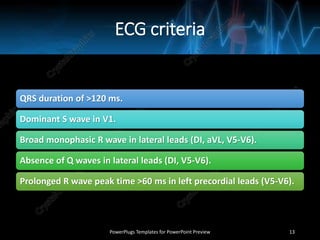
13.
ECG criteria
QRS durationof >120 ms.
Dominant S wave in V1.
Broad monophasic R wave in lateral leads (DI, aVL, V5-V6).
Absence of Q waves in lateral leads (DI, V5-V6).
Prolonged R wave peak time >60 ms in left precordial leads (V5-V6).
PowerPlugs Templates for PowerPoint Preview 13
14.
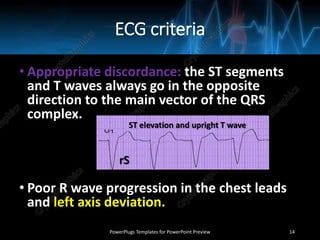
ECG criteria
• Appropriatediscordance: the ST segments
and T waves always go in the opposite
direction to the main vector of the QRS
complex.
• Poor R wave progression in the chest leads
and left axis deviation.
PowerPlugs Templates for PowerPoint Preview 14
rS
ST elevation and upright T wave
15.
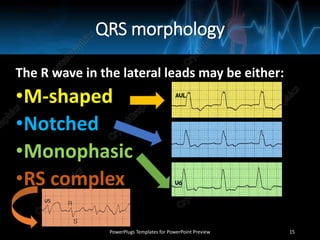
QRS morphology
The Rwave in the lateral leads may be either:
•M-shaped
•Notched
•Monophasic
•RS complex
PowerPlugs Templates for PowerPoint Preview 15
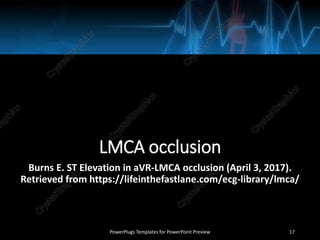
LMCA occlusion
Burns E.ST Elevation in aVR-LMCA occlusion (April 3, 2017).
Retrieved from https://lifeinthefastlane.com/ecg-library/lmca/
PowerPlugs Templates for PowerPoint Preview 17
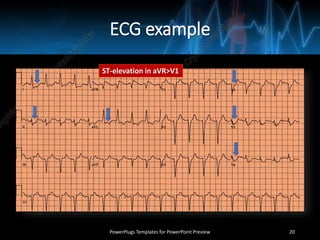
18.
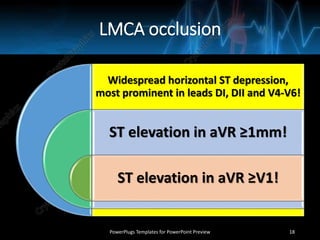
LMCA occlusion
Widespread horizontalST depression,
most prominent in leads DI, DII and V4-V6!
ST elevation in aVR ≥1mm!
ST elevation in aVR ≥V1!
PowerPlugs Templates for PowerPoint Preview 18
19.
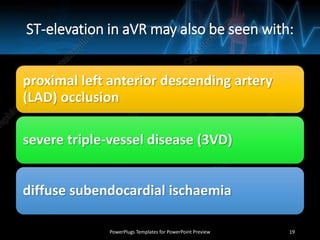
ST-elevation in aVRmay also be seen with:
proximal left anterior descending artery
(LAD) occlusion
severe triple-vessel disease (3VD)
diffuse subendocardial ischaemia
PowerPlugs Templates for PowerPoint Preview 19
Left Posterior FascicularBlock (LPFB)
Burns E. Left Posterior Fascicular Block (April 16, 2017). Retrieved from
https://lifeinthefastlane.com/ecg-library/basics/left-posterior-fascicular-block/
PowerPlugs Templates for PowerPoint Preview 21
22.
LPFB
•In left posteriorfascicular block (aka left
posterior hemiblock), impulses are
conducted to the left ventricle via the left
anterior fascicle, which inserts into the
upper, lateral wall of the left ventricle
along its endocardial surface.
PowerPlugs Templates for PowerPoint Preview 22
23.
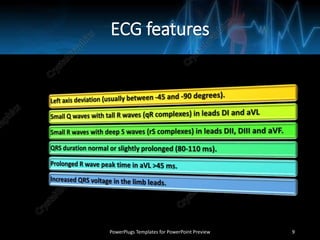
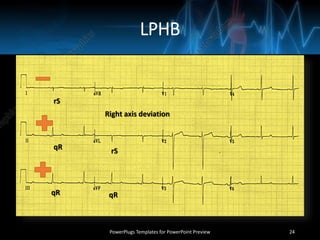
ECG features
Right axisdeviation (> +90 degrees)
Small R waves with deep S waves (rS complexes) in leads DI and aVL
Small Q waves with tall R waves (qR complexes) in leads DII, DIII and aVF
QRS duration normal or slightly prolonged (80-110ms)
Prolonged R wave peak time in aVF
Increased QRS voltage in the limb leads
No evidence of right ventricular hypertrophy
No evidence of any other cause for right axis deviation
PowerPlugs Templates for PowerPoint Preview 23
Left ventricular aneurysm
BurnsE. Left Ventricular Aneursym (April 3, 2017). Retrieved from
https://lifeinthefastlane.com/ecg-library/left-ventricular-aneursym/
PowerPlugs Templates for PowerPoint Preview 25
26.
ECG features
ST elevationseen after 2 weeks following an acute
myocardial infarction:
• most commonly seen in the precordial leads
• may exhibit concave or convex morphology
• usually associated with well-formed Q or QS
waves
• T-waves have a relatively small amplitude in
comparison to the QRS complex (unlike the
hyperacute T-waves of acute STEMI)
PowerPlugs Templates for PowerPoint Preview 26
27.
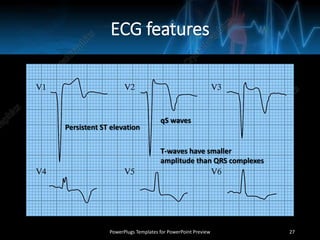
ECG features
PowerPlugs Templatesfor PowerPoint Preview 27
Persistent ST elevation
qS waves
T-waves have smaller
amplitude than QRS complexes
28.
Left ventricular hypertrophy
BurnsE. Left Ventricular Hypertrophy (March 18, 2017). Retrieved from
https://lifeinthefastlane.com/ecg-library/basics/left-ventricular-hypertrophy/
PowerPlugs Templates for PowerPoint Preview 28
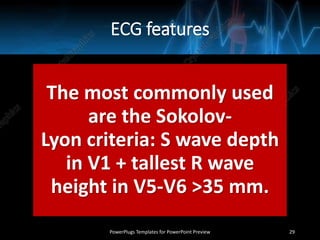
29.
ECG features
The mostcommonly used
are the Sokolov-
Lyon criteria: S wave depth
in V1 + tallest R wave
height in V5-V6 >35 mm.
PowerPlugs Templates for PowerPoint Preview 29
30.
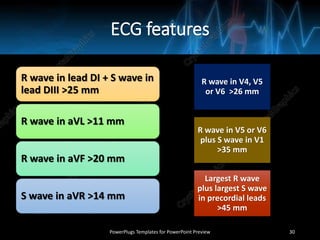
ECG features
R wavein lead DI + S wave in
lead DIII >25 mm
R wave in aVL >11 mm
R wave in aVF >20 mm
S wave in aVR >14 mm
R wave in V4, V5
or V6 >26 mm
R wave in V5 or V6
plus S wave in V1
>35 mm
Largest R wave
plus largest S wave
in precordial leads
>45 mm
PowerPlugs Templates for PowerPoint Preview 30
31.
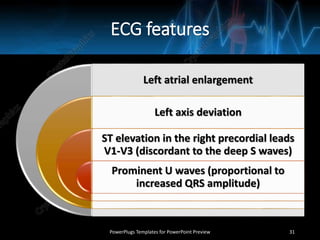
ECG features
Left atrialenlargement
Left axis deviation
ST elevation in the right precordial leads
V1-V3 (discordant to the deep S waves)
Prominent U waves (proportional to
increased QRS amplitude)
PowerPlugs Templates for PowerPoint Preview 31
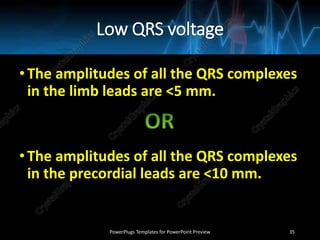
Low QRS voltage
•Theamplitudes of all the QRS complexes
in the limb leads are <5 mm.
•The amplitudes of all the QRS complexes
in the precordial leads are <10 mm.
PowerPlugs Templates for PowerPoint Preview 35


![PERI-PROSTHETIC FRACTURE NAIL-PLATE CONSTRUCT [NPC].pptx](https://cdn.slidesharecdn.com/ss_thumbnails/drarunkumardrmohamedashrafperiprostheticfrasturenail-plateconstructnpc-260209164459-7e9d15a1-thumbnail.jpg?width=640&height=640&fit=bounds)


