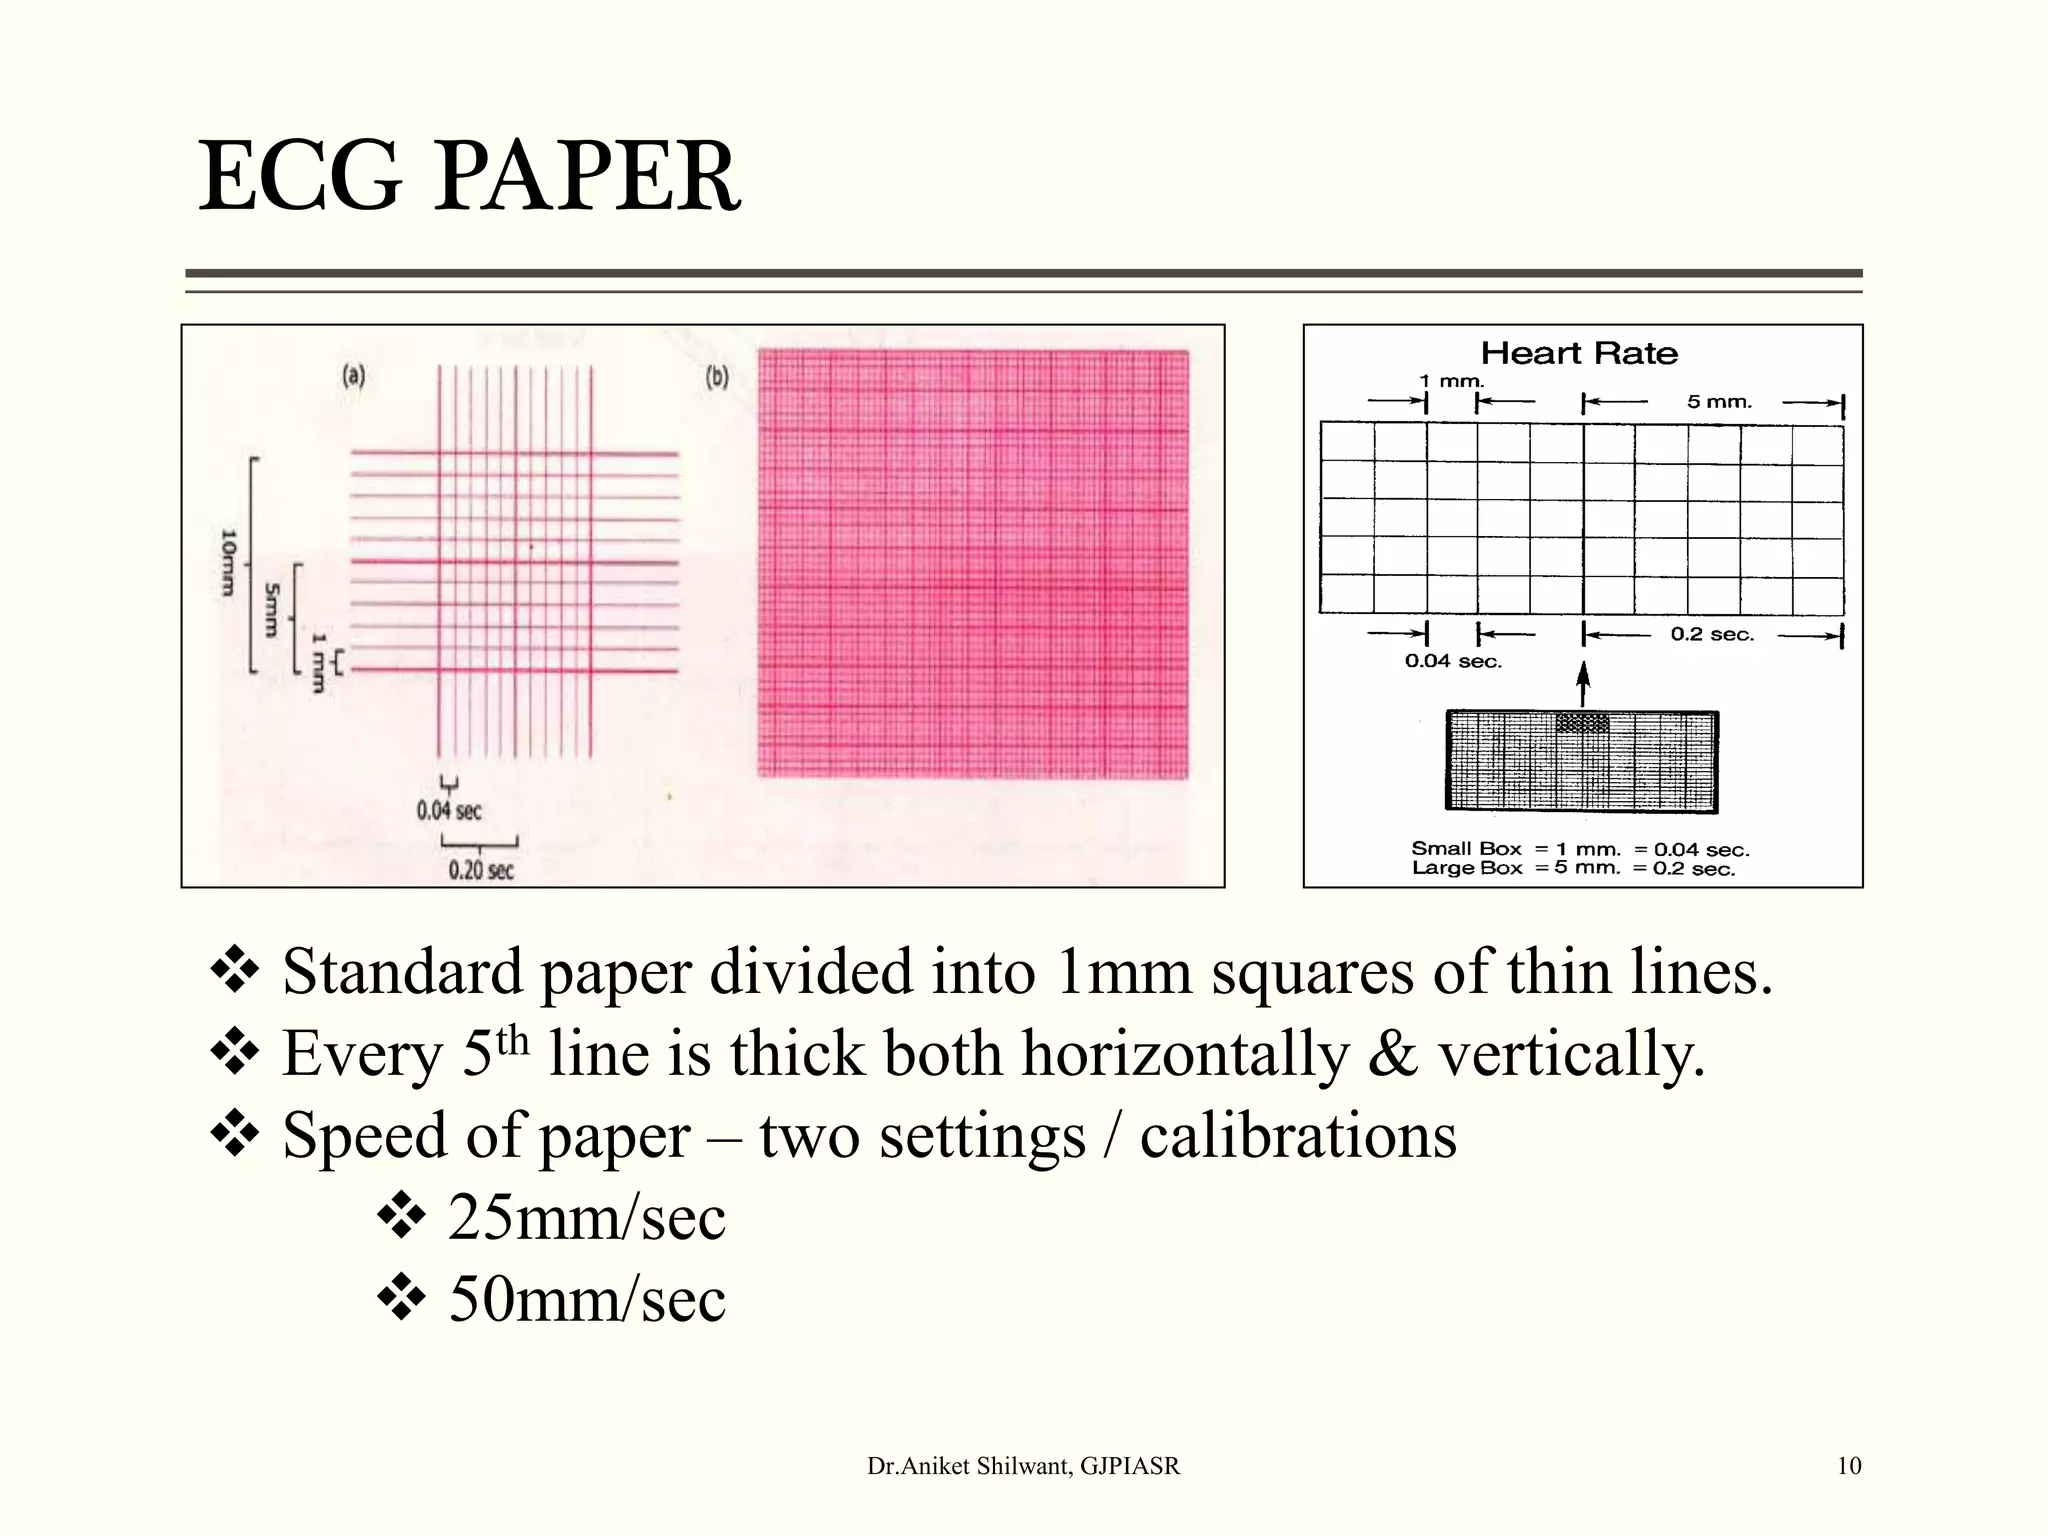
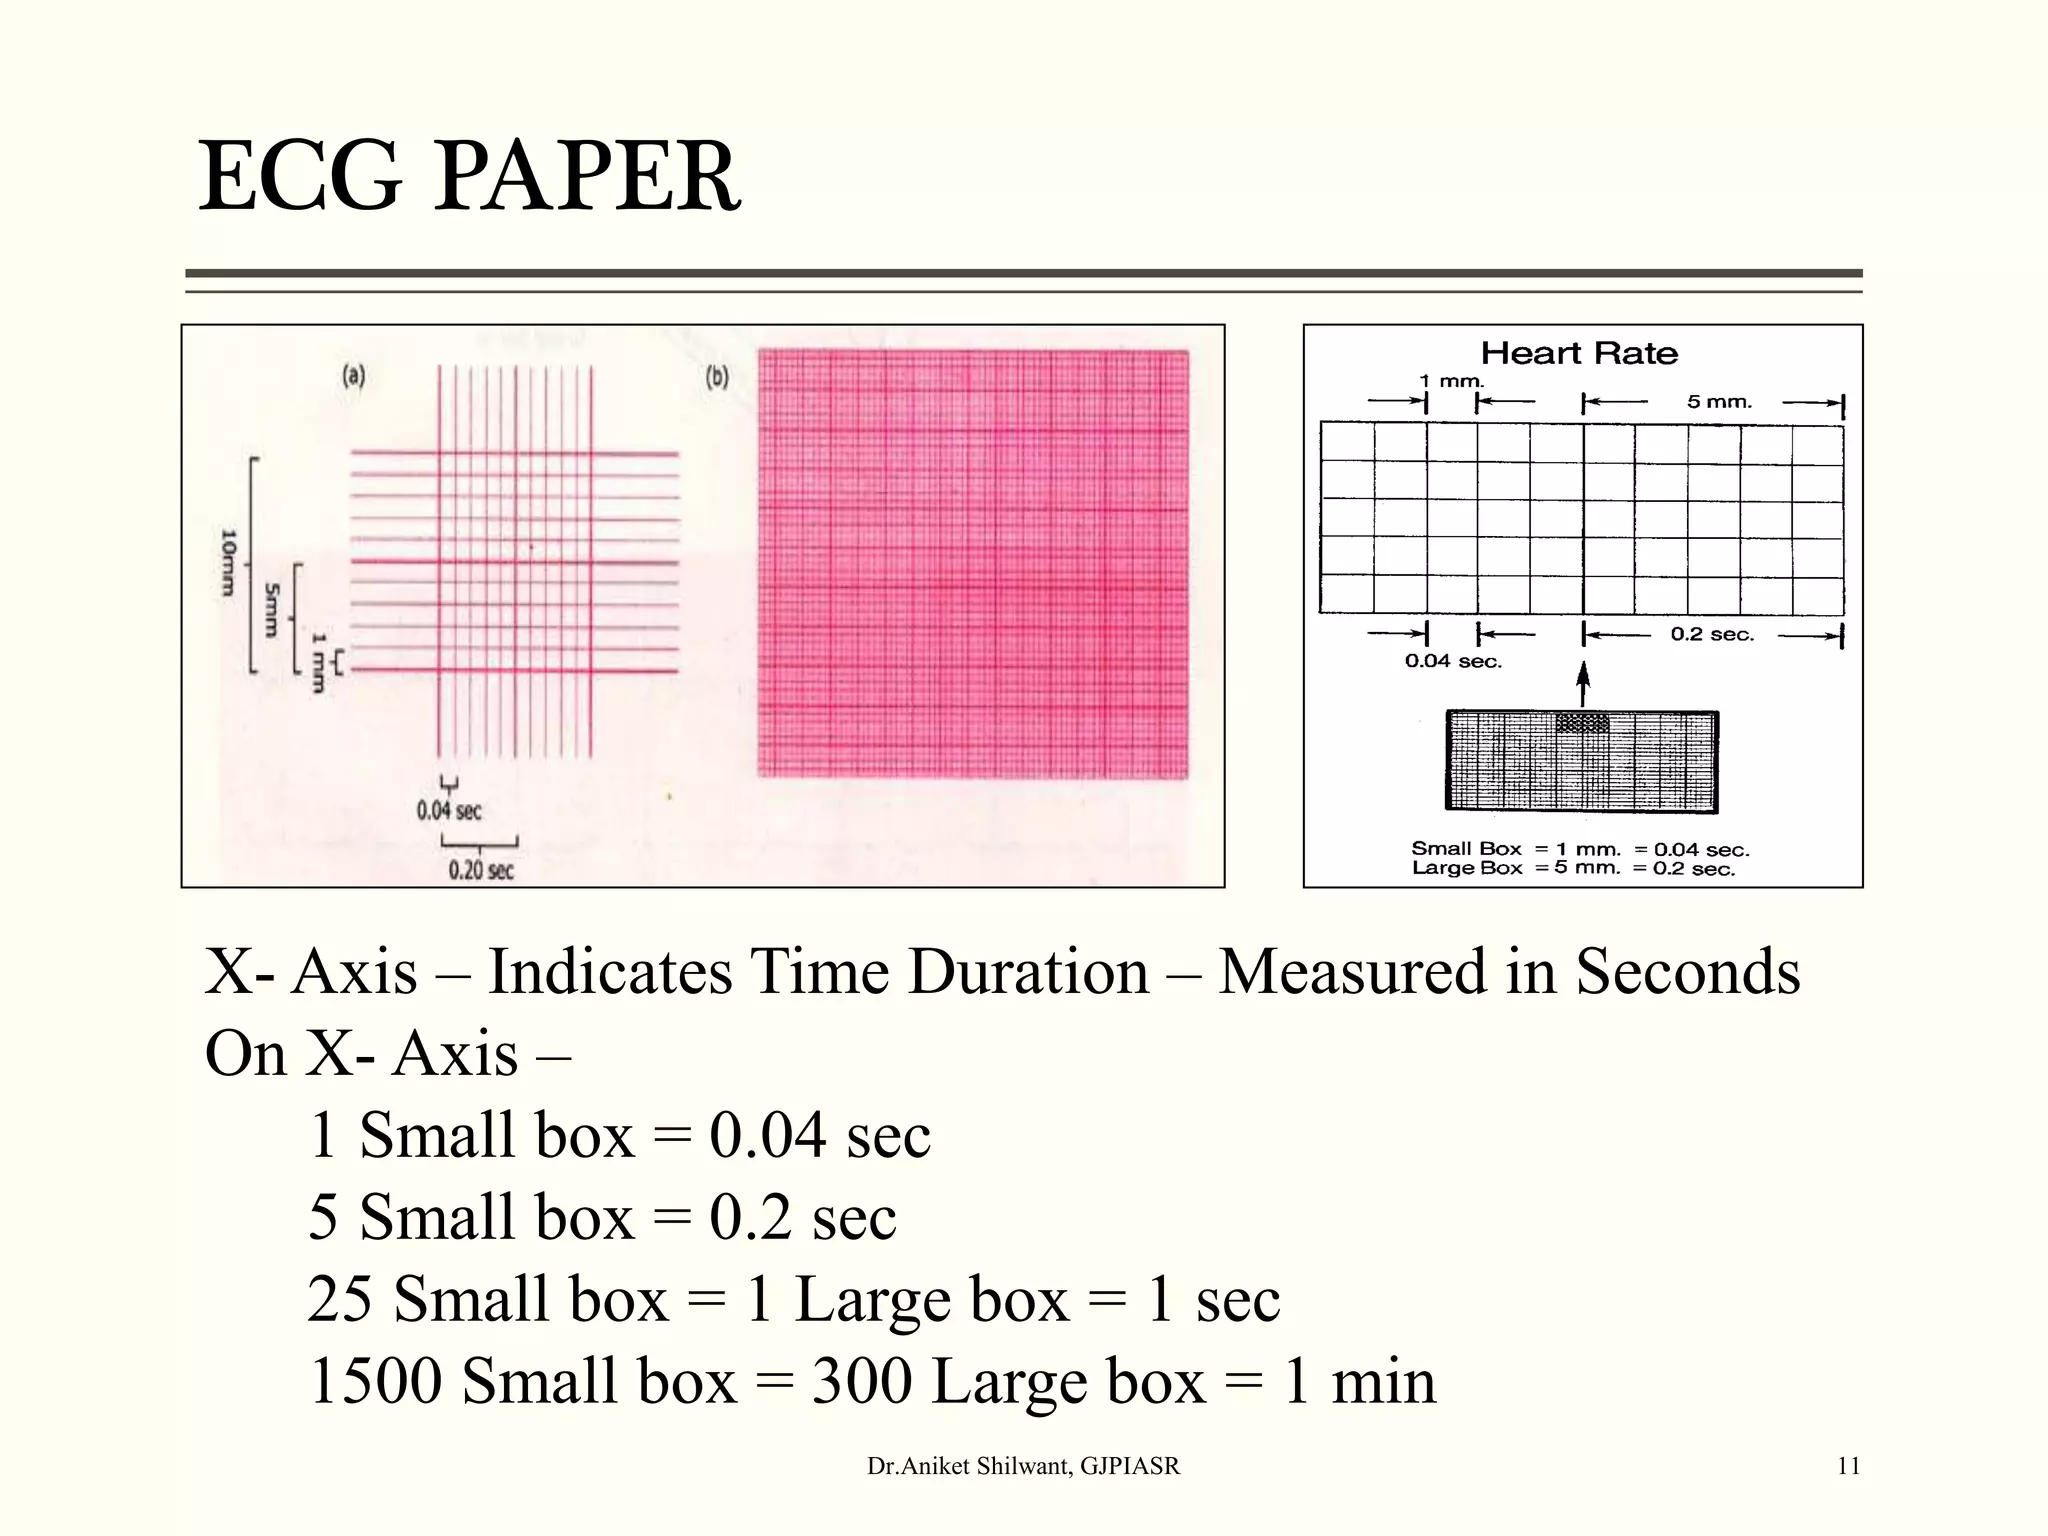
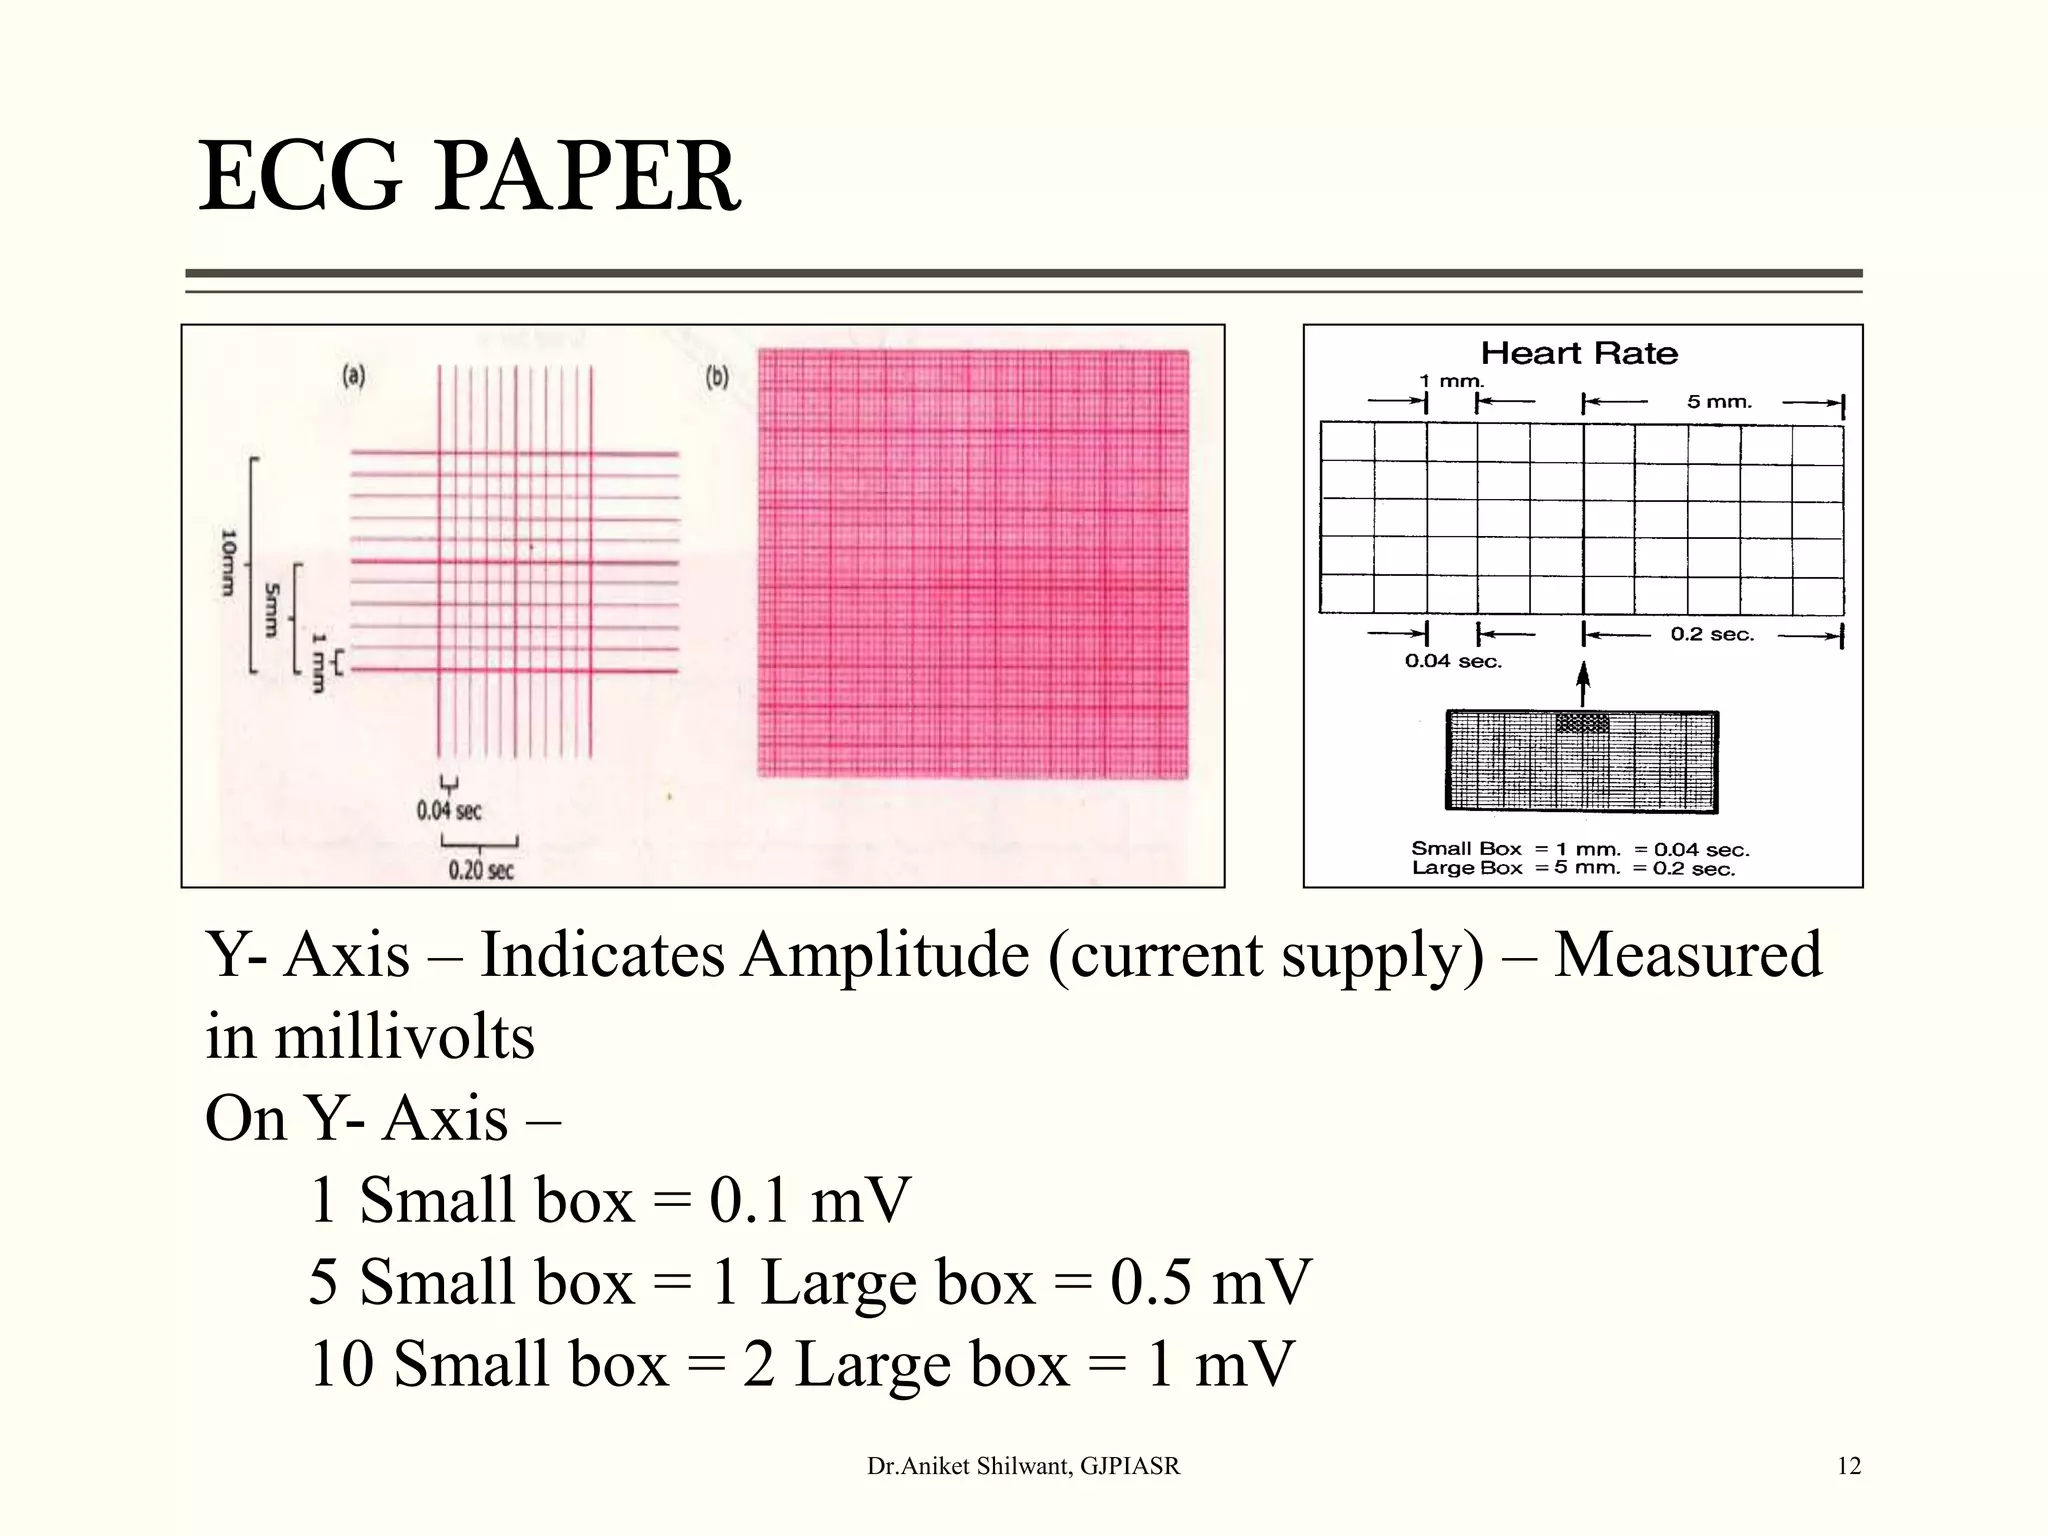
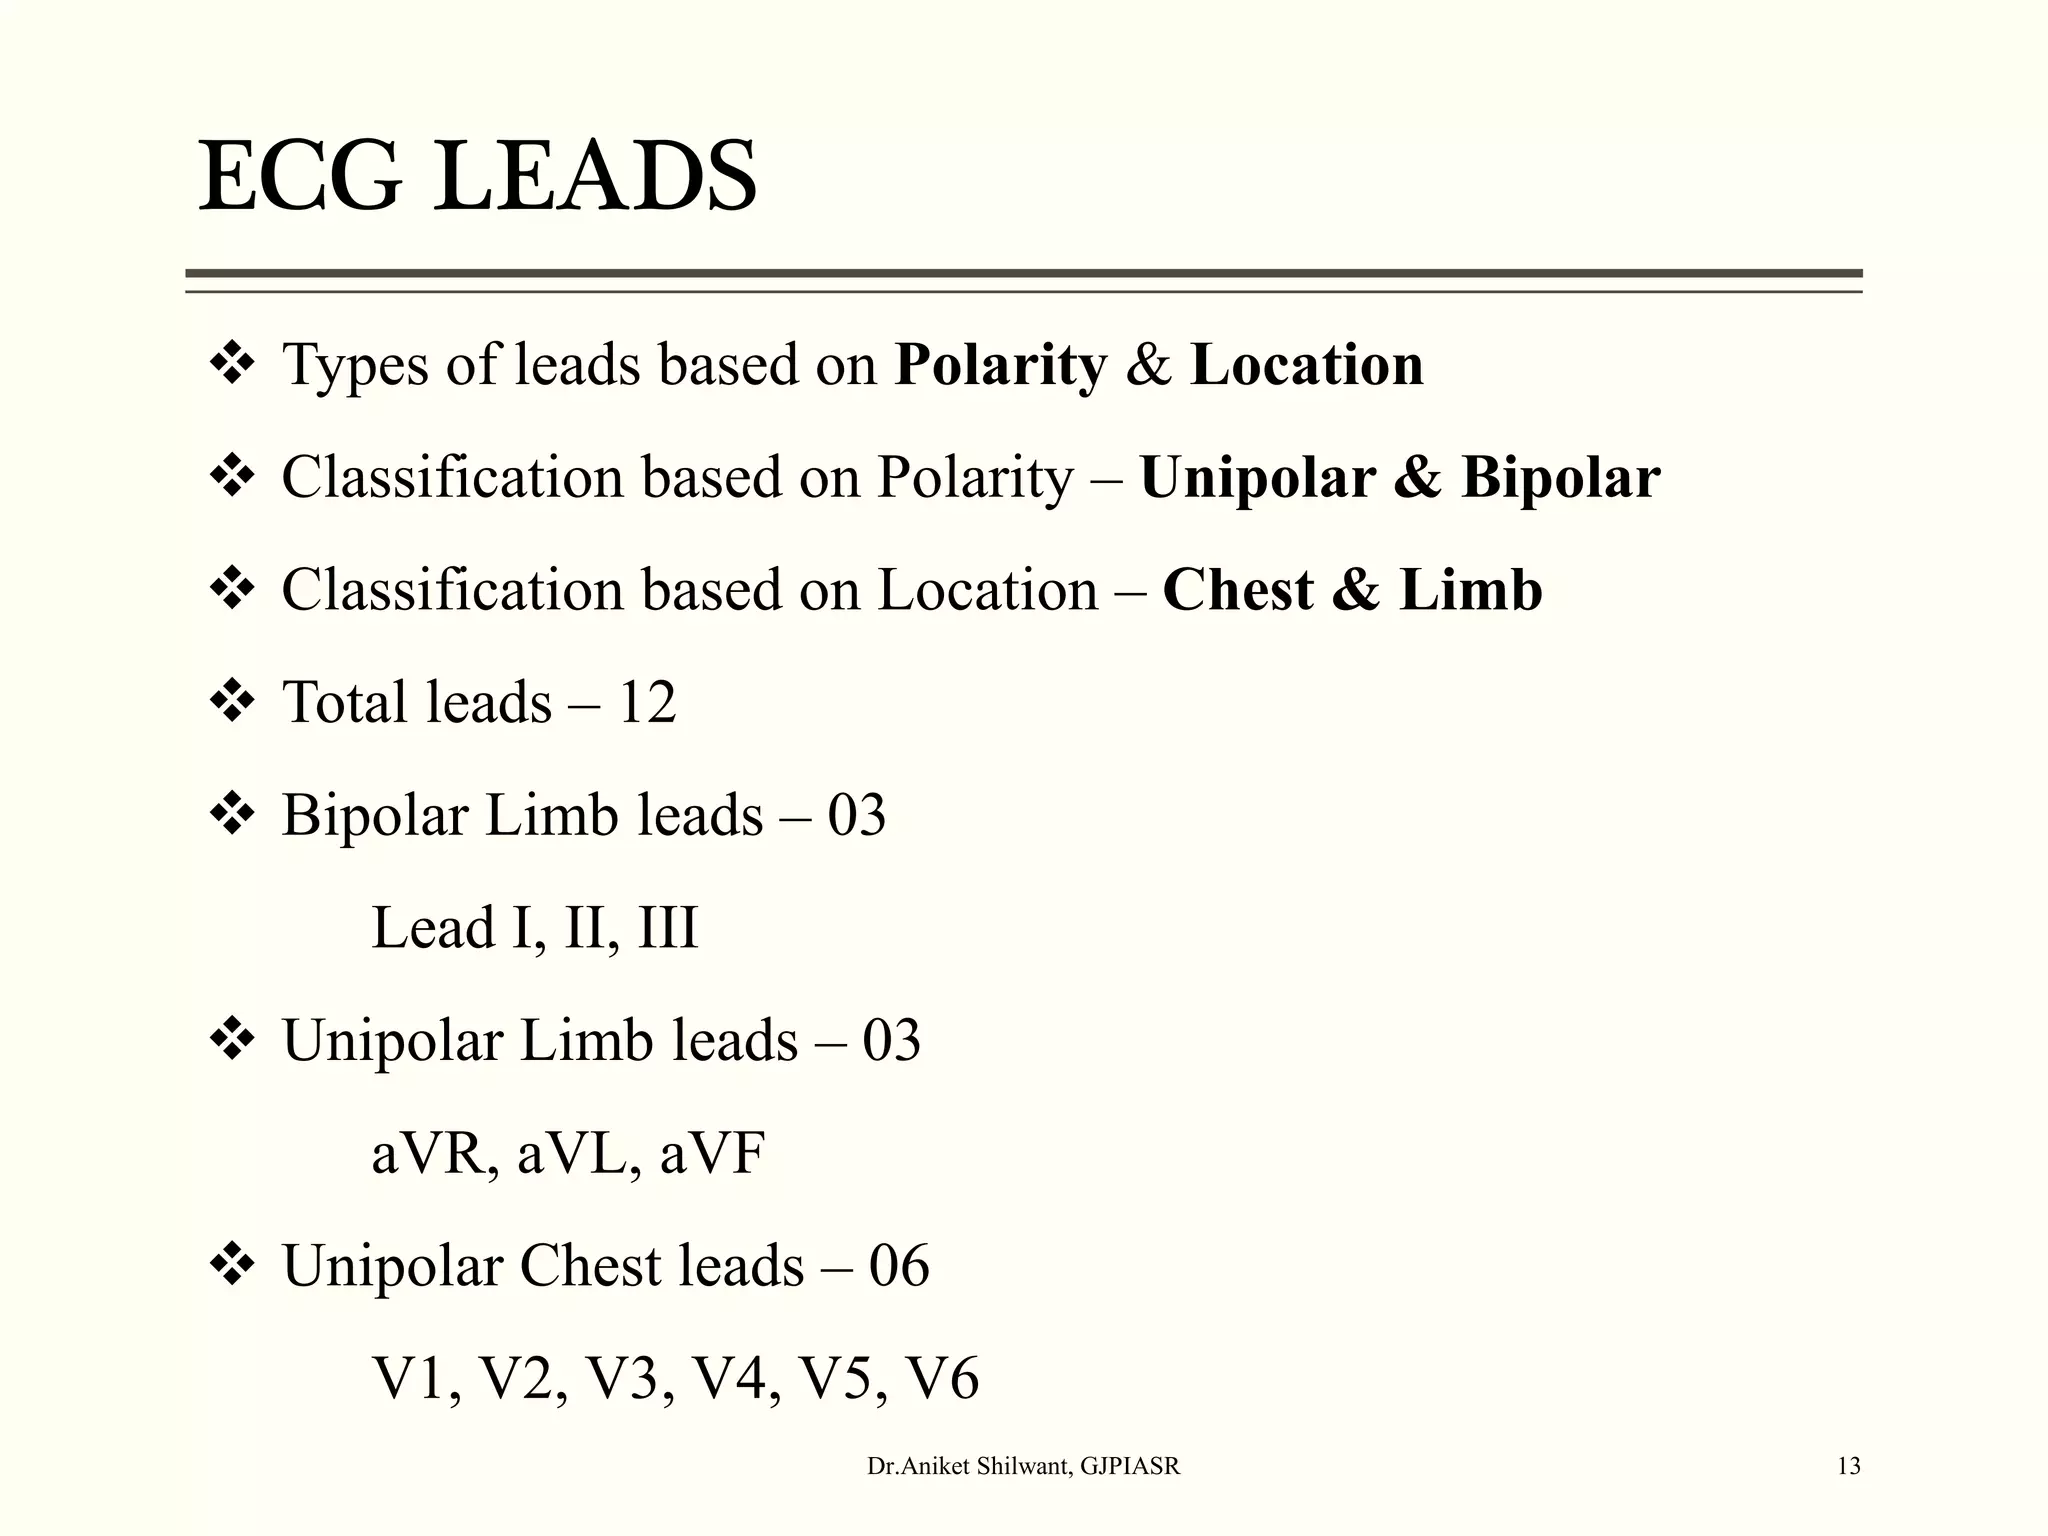
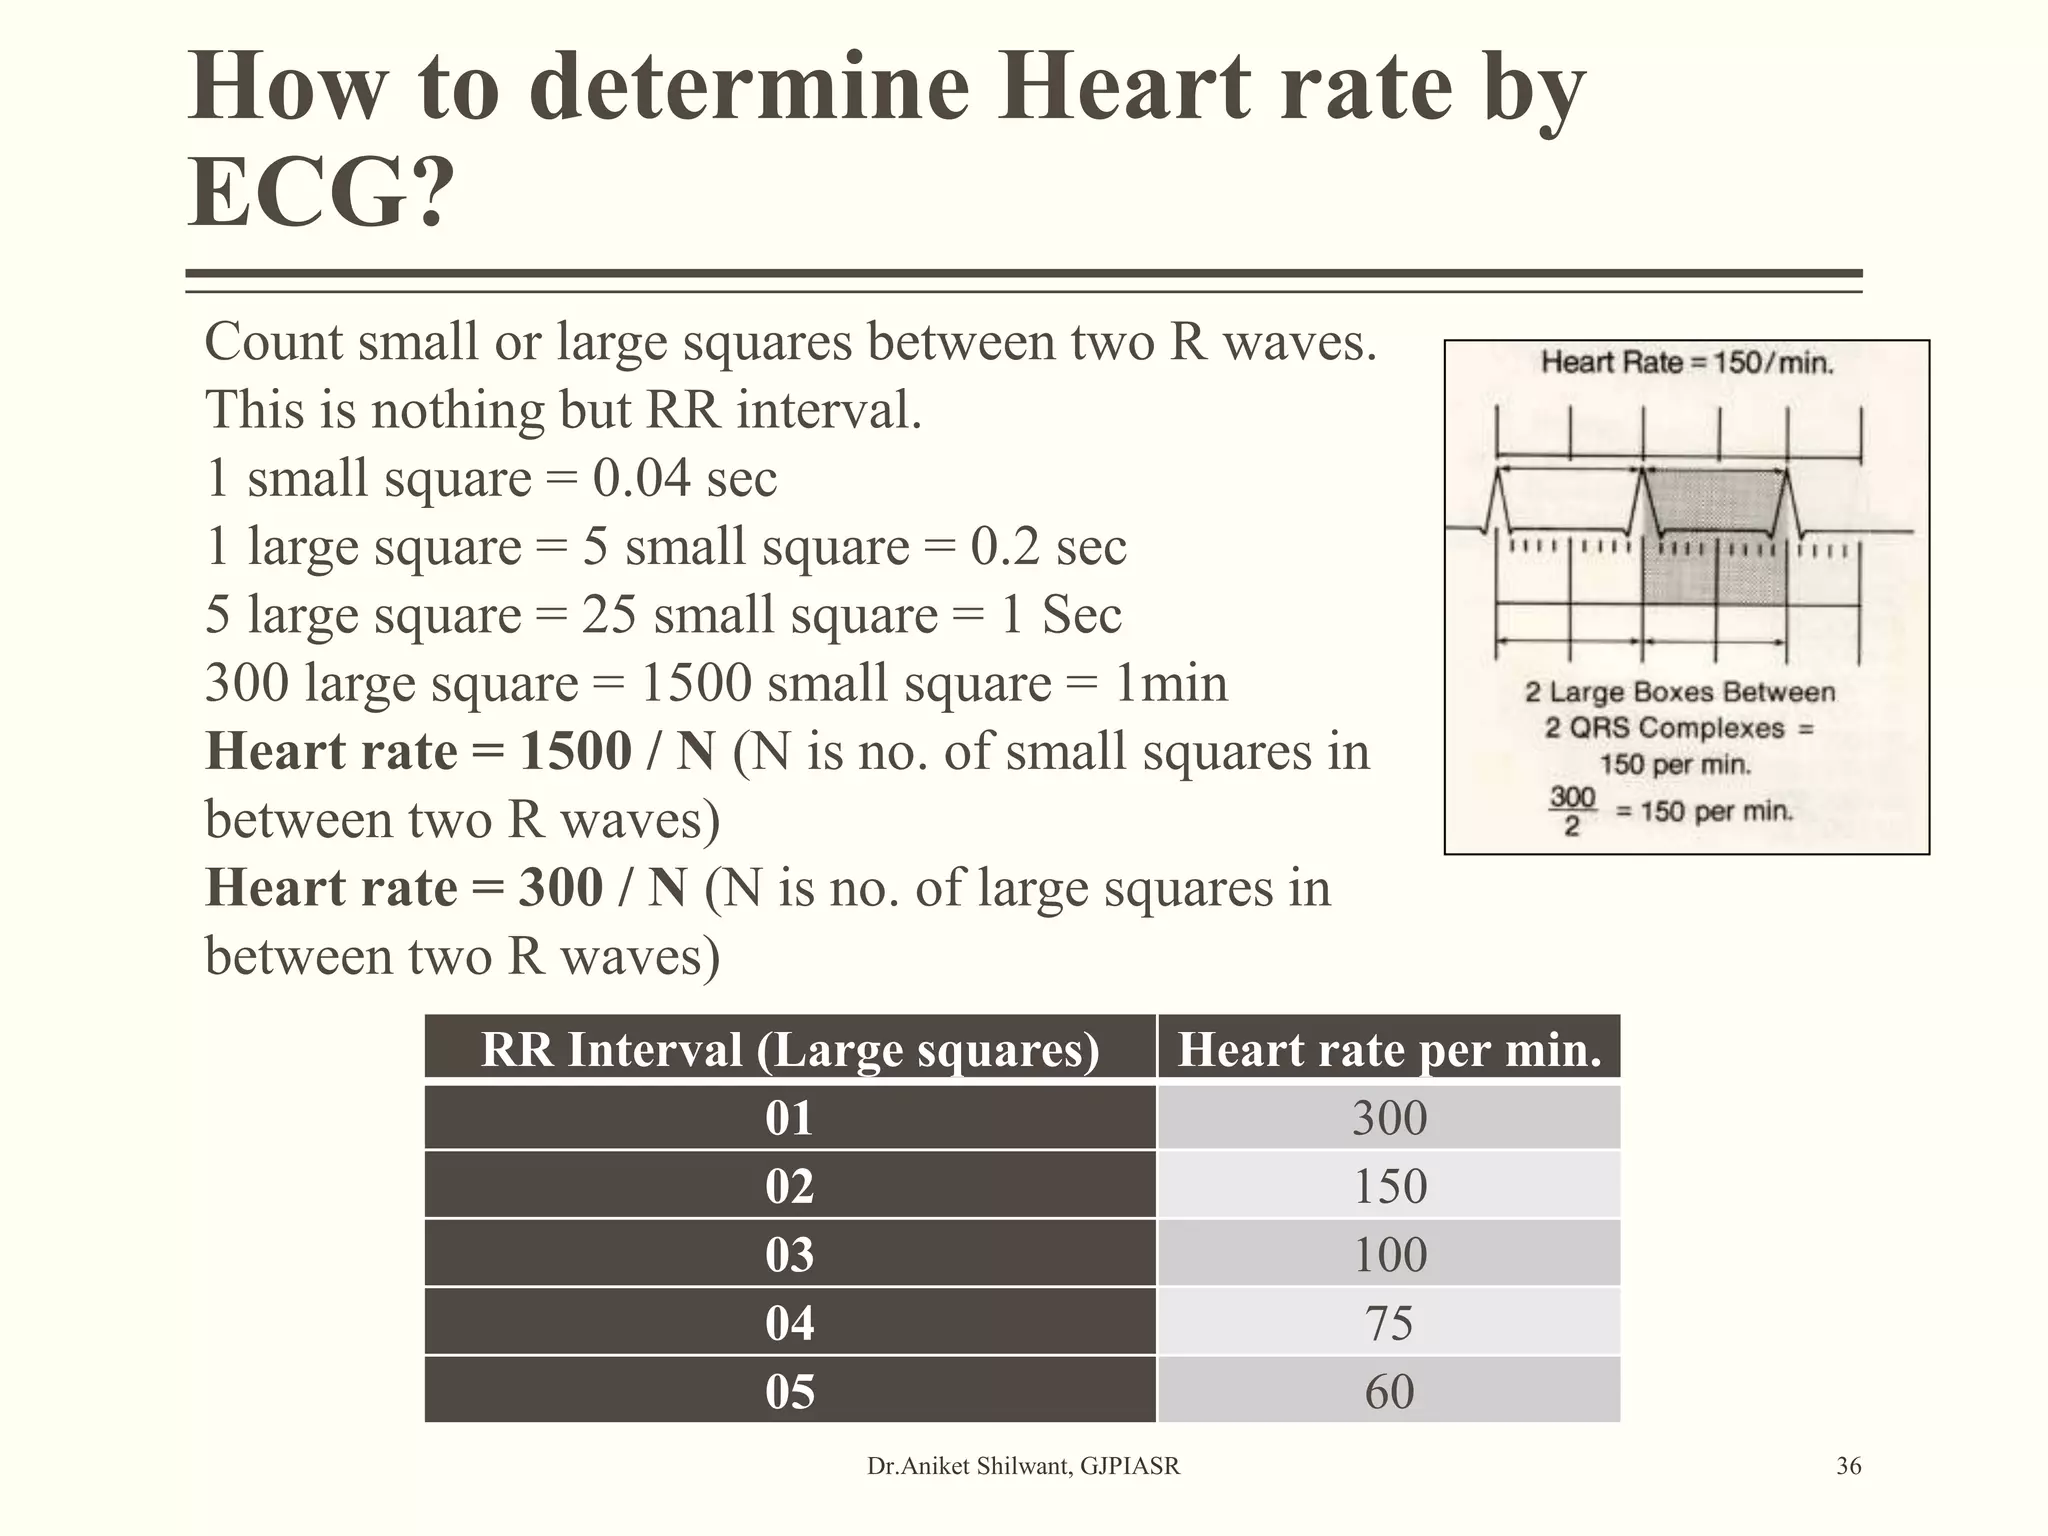
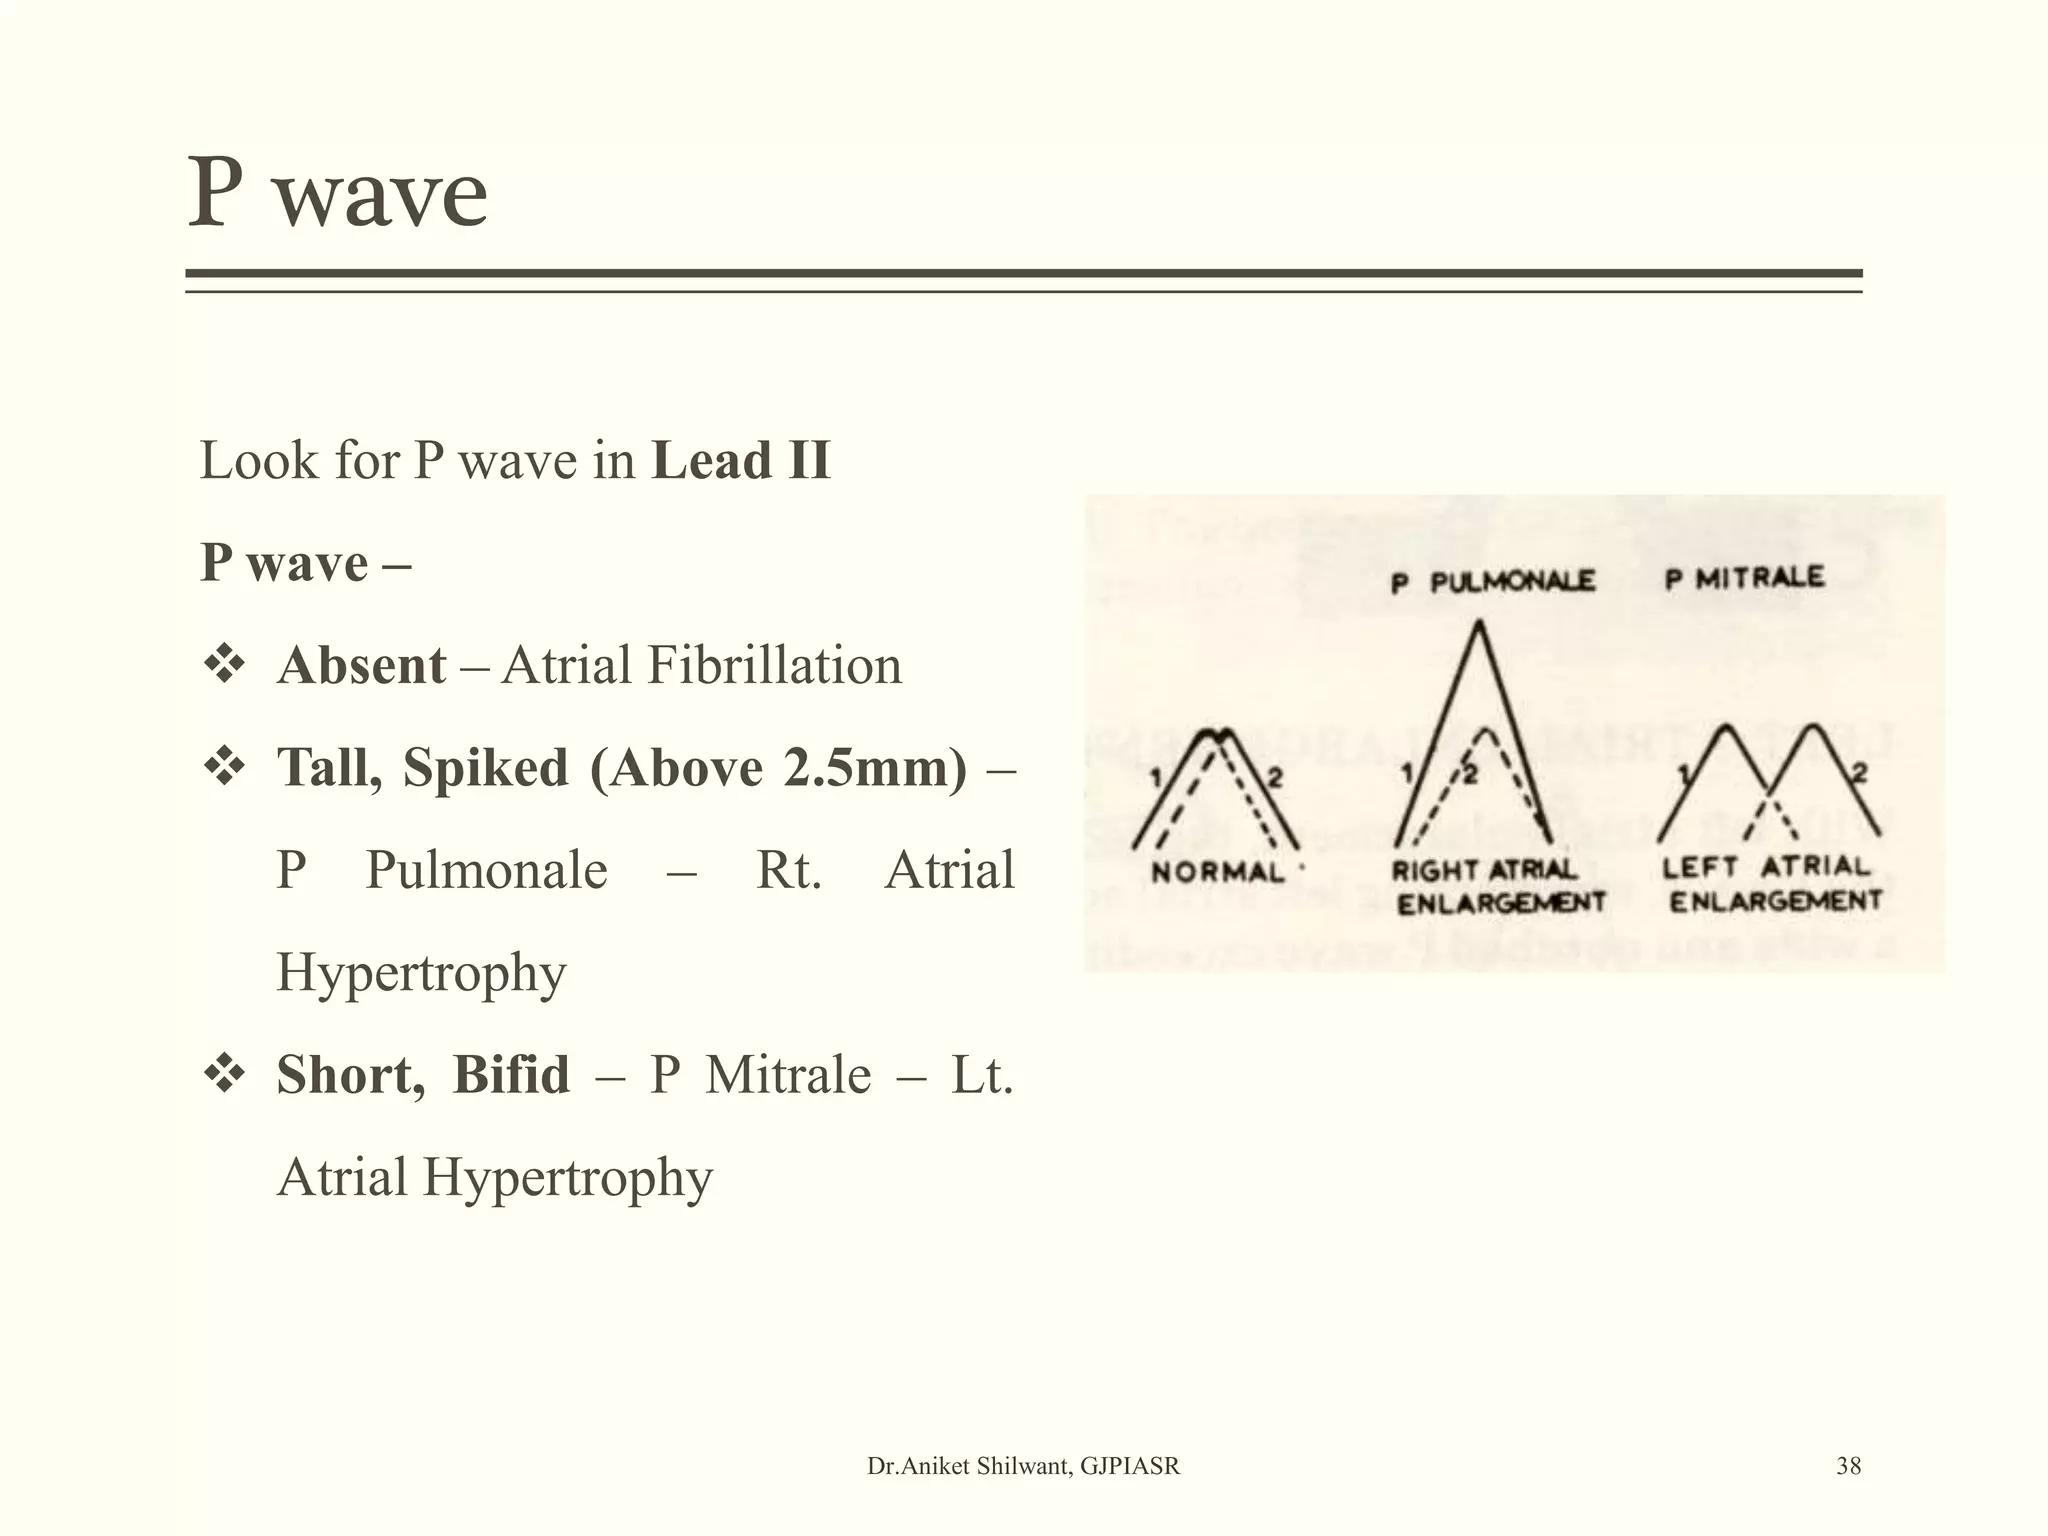
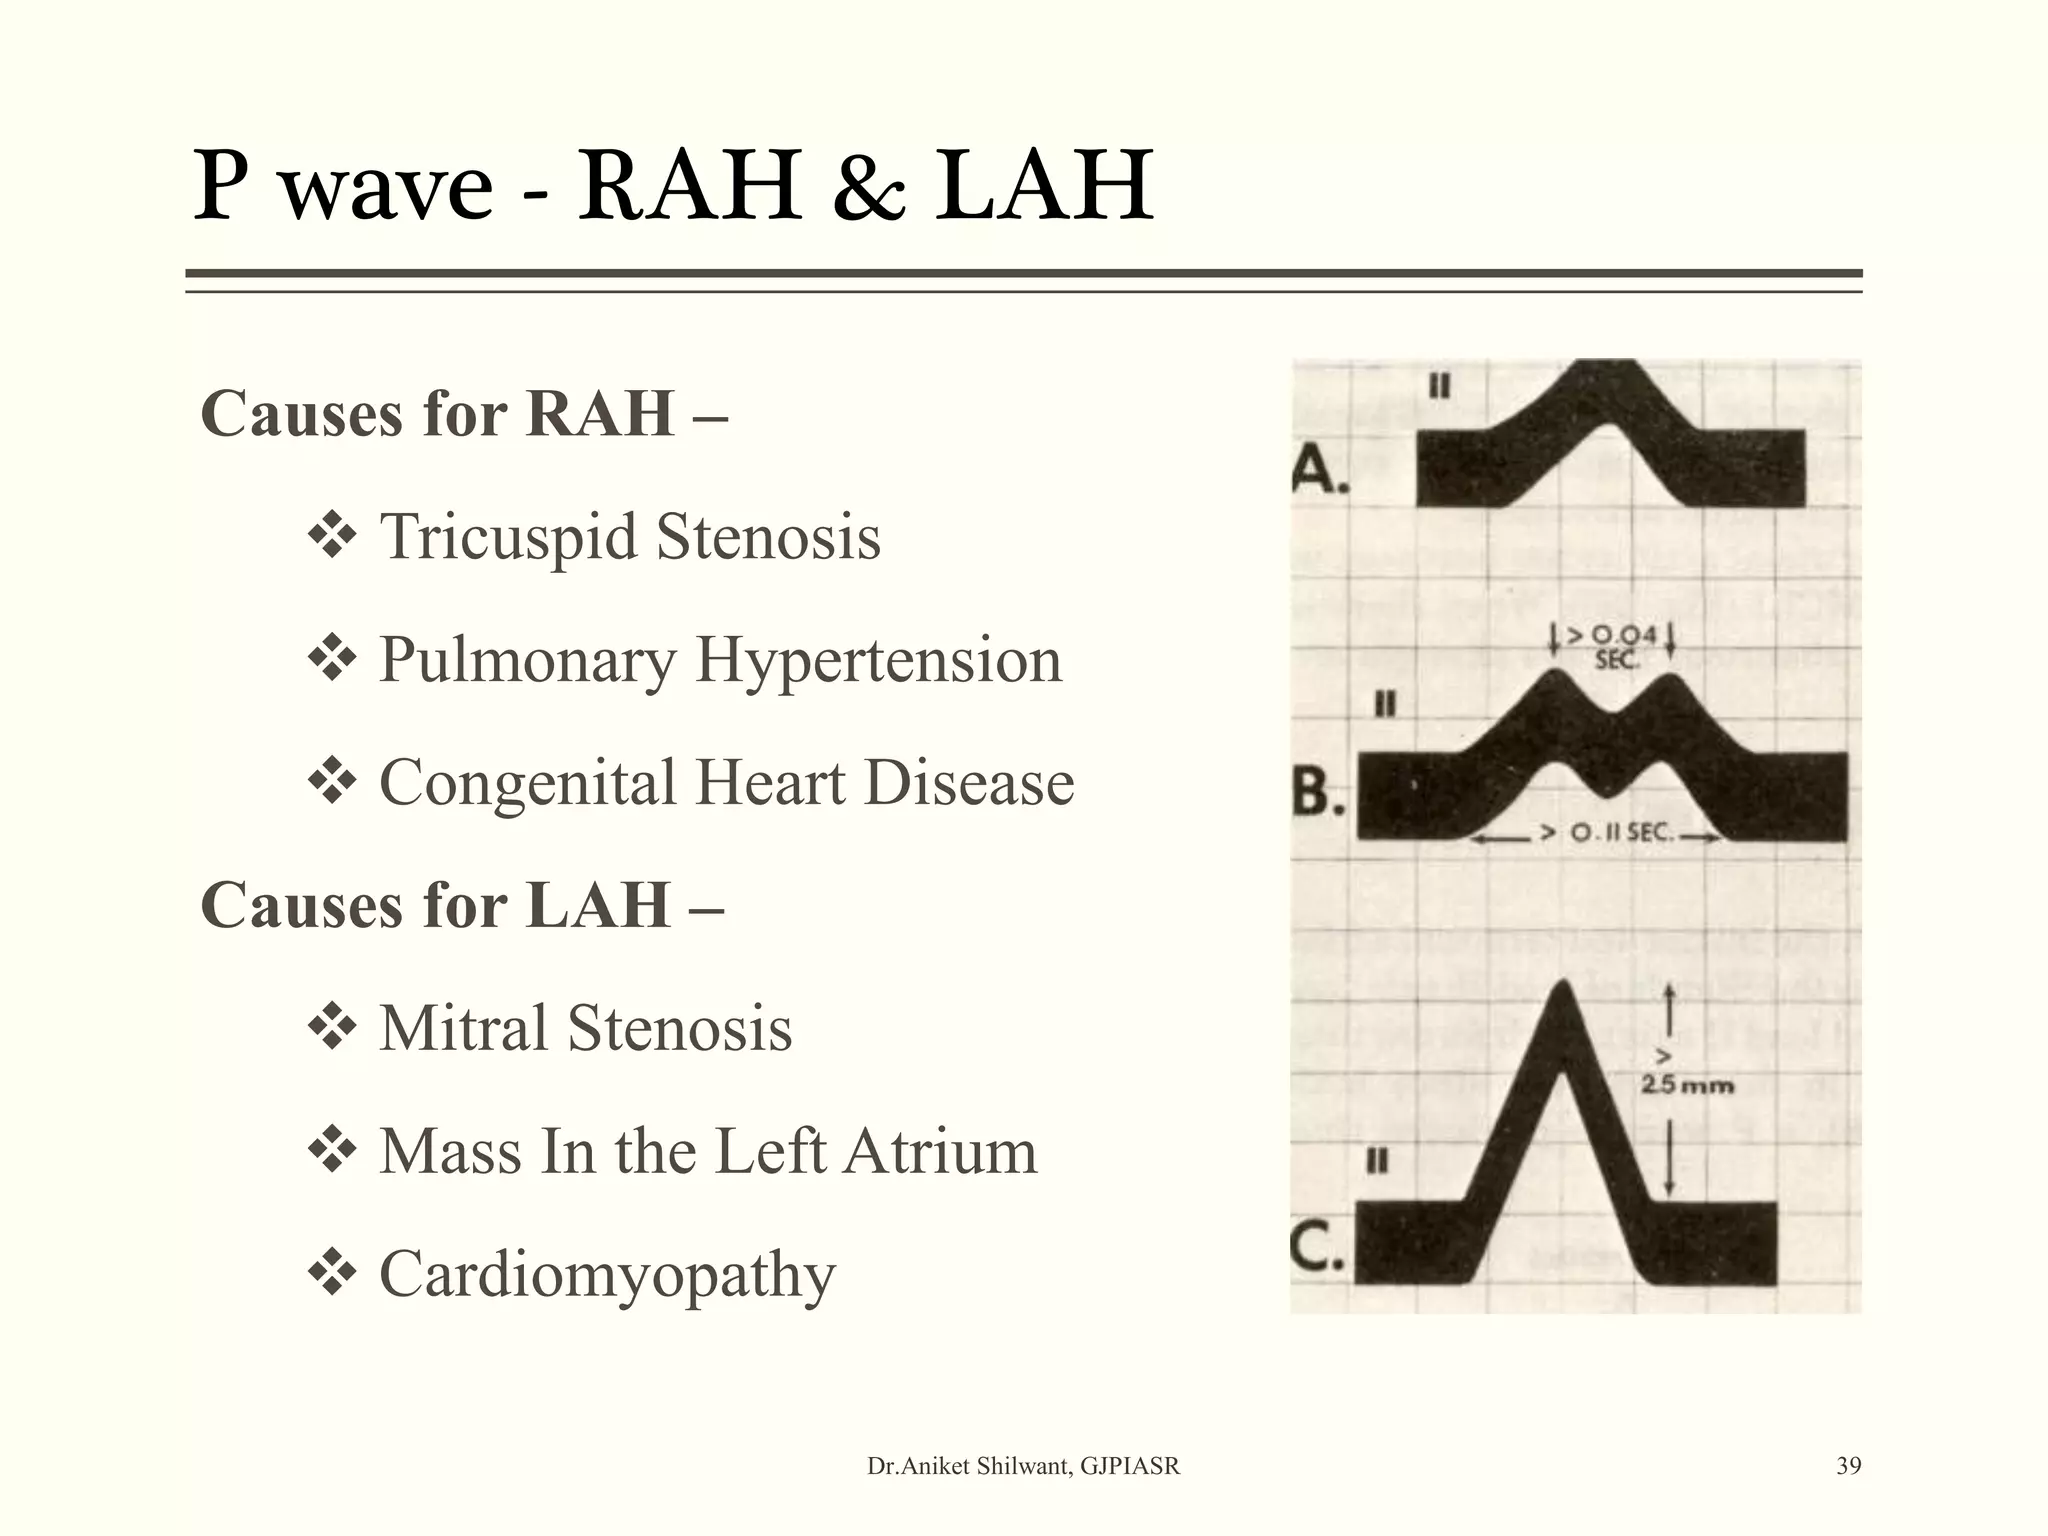
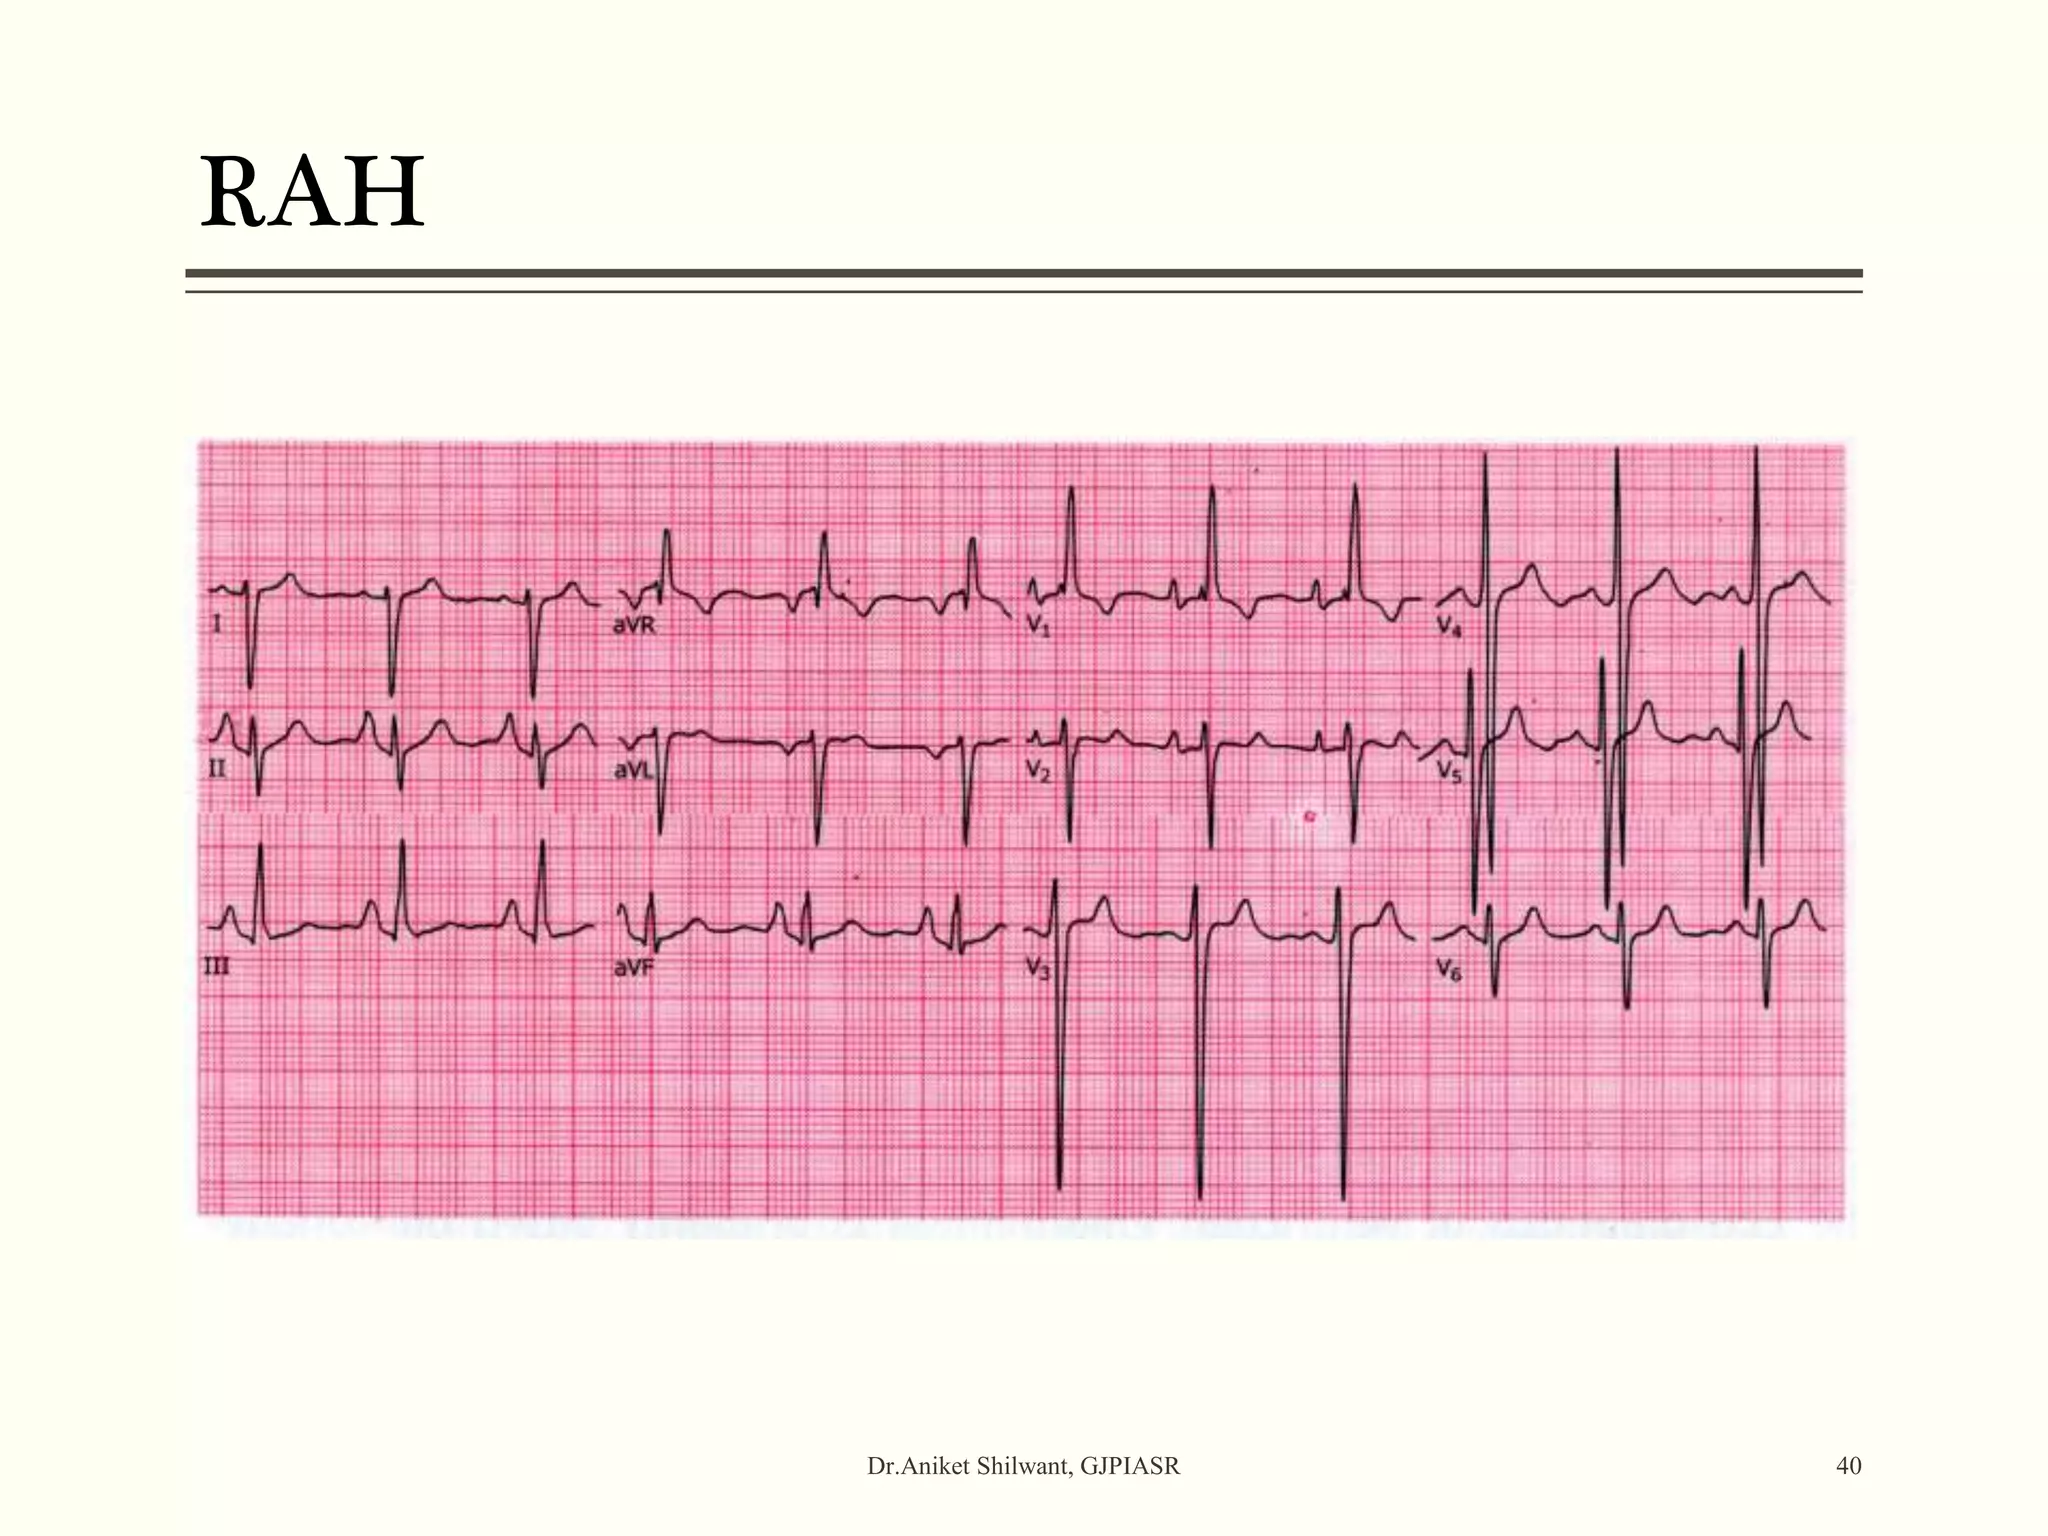
Basics of ECG
Dr. Aniket A. Shilwant
Assistant Professor
Sharir Kriya Dept.
GJPIASR
Willem Einthoven
(1860-1927)
Dr.Aniket Shilwant, GJPIASR 2
Dr.Aniket Shilwant, GJPIASR 3
NEW ECG MACHINE
Dr.Aniket Shilwant, GJPIASR 4
Galvanometer
Dr.Aniket Shilwant, GJPIASR 5
TABLE OF CONTENTS
Dr.Aniket Shilwant, GJPIASR
6
 Basic introduction of ECG
 ECG Paper
 ECG Leads
 ECG Axis
 ECG Wave
 ECG Intervals / Segments (within Physiological limits
only)
 Determination of Heart Rate by ECG
 Wave & Intervals Pathologies
Common Terms to get through
while studying ECG
Dr.Aniket Shilwant, GJPIASR 7
 Ischemia & Infarction
 Depolarization & Repolarization
 Hypertrophy
 Stenosis
 Incompetence / Regurgitation / Valvular Insufficiency
 Hypertension
 Coarctation of Aorta
Basic Introduction of ECG
Dr.Aniket Shilwant, GJPIASR 8
 Electrocardiography – Technique or Methodology used
to study of Electrical activities of Heart.
 Electrocardiograph – Graphical presentation of
Electrical activities of Heart.
 Electrocardiogram – Instrument or Machine used to
study the Electrical activities of Heart.
Uses of ECG
Dr.Aniket Shilwant, GJPIASR 9
 Heart rate
 Heart rhythm
 Chemical or Electrolyte imbalances
 Heart chamber abnormalities
 Defective electrical conduction
 Defective perfusion to Heart musculature (IHD)
 Valve defects
ECG PAPER
Dr.Aniket Shilwant, GJPIASR 10
 Standard paper divided into 1mm squares of thin lines.
 Every 5th line is thick both horizontally & vertically.
 Speed of paper – two settings / calibrations
 25mm/sec
 50mm/sec
ECG PAPER
Dr.Aniket Shilwant, GJPIASR 11
X- Axis – Indicates Time Duration – Measured in Seconds
On X- Axis –
1 Small box = 0.04 sec
5 Small box = 0.2 sec
25 Small box = 1 Large box = 1 sec
1500 Small box = 300 Large box = 1 min
ECG PAPER
Dr.Aniket Shilwant, GJPIASR 12
Y- Axis – Indicates Amplitude (current supply) – Measured
in millivolts
On Y- Axis –
1 Small box = 0.1 mV
5 Small box = 1 Large box = 0.5 mV
10 Small box = 2 Large box = 1 mV
ECG LEADS
Dr.Aniket Shilwant, GJPIASR 13
 Types of leads based on Polarity & Location
 Classification based on Polarity – Unipolar & Bipolar
 Classification based on Location – Chest & Limb
 Total leads – 12
 Bipolar Limb leads – 03
Lead I, II, III
 Unipolar Limb leads – 03
aVR, aVL, aVF
 Unipolar Chest leads – 06
V1, V2, V3, V4, V5, V6
Einthoven Triangle
Dr.Aniket Shilwant, GJPIASR 14
Lead I
Dr.Aniket Shilwant, GJPIASR 15
ECG LEADS – BIPOLAR LIMB LEADS
I – Rt. Arm & Lt. Arm
II – Rt. Arm & Lt. Foot
III – Lt. Arm & Lt. Foot
Rt. Foot – Ground conductor /
Zero electrode / Earthing
electrode
Lead II
Dr.Aniket Shilwant, GJPIASR 16
ECG LEADS – UNIPOLAR LIMB LEADS
Unipolar Limb Leads –
One electrode is active while other is kept as
indifferent potential.
aVR – Rt. Arm positive
aVL – Lt. Arm positive
aVF – Lt. Foot positive
Chest Leads
Dr.Aniket Shilwant, GJPIASR 17
ECG LEADS – UNIPOLAR CHEST LEADS
Frontal Plane
Horizontal
Plane Dr.Aniket Shilwant, GJPIASR 18
Electrical field covering Heart
Normal ECG
Dr.Aniket Shilwant, GJPIASR 19
ECG – Cardiac Axis
Dr.Aniket Shilwant, GJPIASR 20
Cardiac Axis – Cardiac Vector – Direction at
which electrical
potential generated in the heart travels at an
instant.
 Direction of spread of depolarization wave
defines – Cardiac Axis.
 Normal axis – Normal depolarization wave
starts from SA node travels downwards
towards left lower end at apex.
 Normal axis – from 11’O clock – 5’O
clock position
 Cardiac axis deviation indicates mainly –
Ventricular chamber enlargements
& Bundle branch block – conduction
problems
Hexa Axial
Dr.Aniket Shilwant, GJPIASR 21
Dr.Aniket Shilwant, GJPIASR 22
Depolarization at Cardiac Cell
Electrical Pathway
Normal Axis
Sr.
No
Lead I Lead III Axis
1 Dominantly +ve Dominantly +ve Normal
2 Dominantly +ve Dominantly -ve Left Axis
3 Dominantly –ve Dominantly +ve Right Axis
4 Dominantly –ve Dominantly -ve Indeterminate Axis
* Left Axis = Left Leaves
* Right Axis = Right Reaches
Dr.Aniket Shilwant, GJPIASR
23
Left Axis
Dr.Aniket Shilwant, GJPIASR 24
Causes for Left Axis -
1. Left Anterior Hemi block
2. Left Ventricular Hypertrophy
3. Inferior wall Myocardial Infarction
4. Apical Pacing
Right Axis
Dr.Aniket Shilwant, GJPIASR 25
Causes for Right Axis deviation –
1. Left posterior hemi block
2. Right Ventricular Hypotrophy
3. Reversed arm electrodes
4. Dextrocardia
ECG Waves
Dr.Aniket Shilwant, GJPIASR 26
Normal waves – 5 – PQRST
Rarely 6th wave – U – Clinically Insignificant
 P wave – Atrial complex – Atrial Depolarization
 QRST – Ventricular complex
 QRS – Ventricular depolarization
 T – Ventricular Repolarization
 U – Repolarization of Papillary muscles
ECG Waves – P wave
Dr.Aniket Shilwant, GJPIASR 27
P wave
 Short, dome shaped, 1st positive wave
 Indicates electrical activity of atria
 Indicates – Atrial depolarization
 Time period – 0.1 sec
 Amplitude – 0.1 – 0.12 mV
ECG Waves – QRS Complex
Dr.Aniket Shilwant, GJPIASR 28
Q wave
 Short, 1st negative wave
 Indicates depolarization of basal portion of interventricular septum
 May be absent in infants – septal defect.
 Amplitude – 0.1 - 0.2 mV
R wave
 Tall, constant positive wave with high amplitude
 Indicates depolarization of apical portion of interventricular septum
and ventricular musculature
 Amplitude – 1mV
S wave
 Short, negative wave
 Indicates depolarization of basal portion of ventricular musculature
 Amplitude – 0.4mV
 Time period of QRS complex – 0.08 – 0.1 sec
QRS Complex Patterns
Progression of QRS pattern in Chest
leads from V1 to V6
Dr.Aniket Shilwant, GJPIASR 29
ECG Waves – QRS Complex
ECG Waves – T & U Wave
Dr.Aniket Shilwant, GJPIASR 30
T wave
 Short, broad, dome shaped positive wave
 Indicates – repolarization of ventricles
 Time period – 0.2 sec
 Amplitude – 0.3 mV
U wave
 Rare and insignificant
 Positive wave Followed after T wave
 Indicates – repolarization of Papillary muscles, Purkinje fibers
ECG Intervals / Segments
Dr.Aniket Shilwant, GJPIASR 31
Time interval (x-axis = sec) between either onset or end
of any of the two waves – Interval/ Segment
1. PR interval
2. QT interval
3. ST segment
4. RR interval
ECG Intervals – PR & QT
Dr.Aniket Shilwant, GJPIASR
32
PR interval
 Starts from onset of P wave ends at starting point of Q wave
 Includes only one waveform in it = P wave
 Indicates time taken by impulse to travel from SA node to AV node
 Time period – 0.12sec – 0.2sec
QT interval
 Starts from onset of Q wave ends end point of T wave
 Includes waveforms in it = Q,R,S,T waves
 Indicates complete electrical activity of ventricles (depolarization
and repolarization)
 Time period – 0.40sec – 0.42sec
Dr.Aniket Shilwant, GJPIASR 33
ST segment
 Starts where S wave ends and ends at starting point of T wave
 Includes no any waveform in it.
 Normally it is Isoelectric in nature
 Time period – 0.08 sec
RR interval
 Time interval between successive R waves
 Thus it Indicates 1 heart beat.
 Also it indicates 1 complete cardiac cycle.
 Time period – 0.8 sec
ECG Intervals – ST & RR
Complete Single ECG Complex
Dr.Aniket Shilwant, GJPIASR 34
Specifications of Waves & Intervals
of Normal ECG
Dr.Aniket Shilwant, GJPIASR 35
Wave Extent Cause
Duration in
seconds
Amplitude in
mV
P wave - Atrial Depolarization 0.1 0.1 to 0.2 mV
QRS
complex
Onset of Q wave to
end of S wave
Ventricular
Depolarization
0.08 to 0.1
Q – 0.1 TO
0.2mV
R – 1mV
S – 0.3mV
T wave -
Ventricular
Repolarization 0.2 0.3mV
PR
interval
End of P wave to onset of
Q wave
Conduction of impulse
from SA to AV node
0.12 – 0.20 -
QT
interval
Onset of Q wave to end
of T wave
Electrical activity of
ventricles
0.4 – 0.42 -
ST
segment
Starts from end of S
wave and ends prior start
of T wave
Isoelectric 0.08 -
How to determine Heart rate by
ECG?
Dr.Aniket Shilwant, GJPIASR 36
RR Interval (Large squares) Heart rate per min.
01 300
02 150
03 100
04 75
05 60
Count small or large squares between two R waves.
This is nothing but RR interval.
1 small square = 0.04 sec
1 large square = 5 small square = 0.2 sec
5 large square = 25 small square = 1 Sec
300 large square = 1500 small square = 1min
Heart rate = 1500 / N (N is no. of small squares in
between two R waves)
Heart rate = 300 / N (N is no. of large squares in
between two R waves)
Dr.Aniket Shilwant, GJPIASR 37
Wave Pathologies
P wave
Dr.Aniket Shilwant, GJPIASR 38
Look for P wave in Lead II
P wave –
 Absent – Atrial Fibrillation
 Tall, Spiked (Above 2.5mm) –
P Pulmonale – Rt. Atrial
Hypertrophy
 Short, Bifid – P Mitrale – Lt.
Atrial Hypertrophy
P wave - RAH & LAH
Dr.Aniket Shilwant, GJPIASR 39
Causes for RAH –
 Tricuspid Stenosis
 Pulmonary Hypertension
 Congenital Heart Disease
Causes for LAH –
 Mitral Stenosis
 Mass In the Left Atrium
 Cardiomyopathy
RAH
Dr.Aniket Shilwant, GJPIASR 40
LAH
Dr.Aniket Shilwant, GJPIASR 41
BIATRIAL HYPERTROPHY
Dr.Aniket Shilwant, GJPIASR 42
Dr.Aniket Shilwant, GJPIASR 43
 Right ventricular hypertrophy
 Tall R wave in V1, V2 & or Deep S wave in V6
 Right Axis deviation
 Inverted T wave in V1, V2
 Left ventricular hypertrophy
 Tall R wave in V5, V6 & or Deep S wave V1, V2
 Inverted T wave in Lead I, aVL, V5, V6
 Left Axis deviation
 Bundle branch block
 RBBB – RSR’ pattern in V1
 LBBB – RR’ pattern (M pattern) IN V6
QRS Complex Pathologies
RVH
Dr.Aniket Shilwant, GJPIASR 44
LVH
Dr.Aniket Shilwant, GJPIASR 45
T Wave
Dr.Aniket Shilwant, GJPIASR 46
T wave –
 Normally inverted in aVR
 Tall, peaked with high amplitude T wave seen in –
Ischemia
T wave inversion seen in –
 Myocardial Infarction
 Hypokalemia
 Ventricular hypertrophy
PR & QT Inetrvals
Dr.Aniket Shilwant, GJPIASR 47
PR interval –
Prolonged
 First degree heart block
 Bradycardia
Shortened
 Tachycardia
QT interval –
Prolonged
 Myocardial infarction
 Hypothyroidism
 Hypocalcemia
Shortened
 Hypercalcemia
ST Segment
Dr.Aniket Shilwant, GJPIASR 48
Elevated
 Anterior / inferior myocardial infarction
 Left bundle branch block
Depressed
 Acute myocardial ischemia
 Hypokalemia
 Ventricular enlargements
Relationship
Of the
ECG
To The
Cardiac
Conduction
System
Dr.Aniket Shilwant, GJPIASR 49
Presentation of ECG Report
Dr.Aniket Shilwant, GJPIASR 50
Dr.Aniket Shilwant, GJPIASR 51
Dr. Aniket A. Shilwant
Assistant Professor
GJP-IASR
Email – ayuraniket18@gmail.com
http://ayugjac.edu.in/Staff_CV.aspx?dl=dn3Mja19480dn3Mja19
http://scholar.google.co.in/citations?user=636K2sMAAAAJ&hl=en
https://www.researchgate.net/profile/Aniket_Shilwant
Thank you all…!!!

ECG BASICS

  • 1.
    Basics of ECG Dr.Aniket A. Shilwant Assistant Professor Sharir Kriya Dept. GJPIASR
  • 2.
  • 3.
  • 4.
    NEW ECG MACHINE Dr.AniketShilwant, GJPIASR 4
  • 5.
  • 6.
    TABLE OF CONTENTS Dr.AniketShilwant, GJPIASR 6  Basic introduction of ECG  ECG Paper  ECG Leads  ECG Axis  ECG Wave  ECG Intervals / Segments (within Physiological limits only)  Determination of Heart Rate by ECG  Wave & Intervals Pathologies
  • 7.
    Common Terms toget through while studying ECG Dr.Aniket Shilwant, GJPIASR 7  Ischemia & Infarction  Depolarization & Repolarization  Hypertrophy  Stenosis  Incompetence / Regurgitation / Valvular Insufficiency  Hypertension  Coarctation of Aorta
  • 8.
    Basic Introduction ofECG Dr.Aniket Shilwant, GJPIASR 8  Electrocardiography – Technique or Methodology used to study of Electrical activities of Heart.  Electrocardiograph – Graphical presentation of Electrical activities of Heart.  Electrocardiogram – Instrument or Machine used to study the Electrical activities of Heart.
  • 9.
    Uses of ECG Dr.AniketShilwant, GJPIASR 9  Heart rate  Heart rhythm  Chemical or Electrolyte imbalances  Heart chamber abnormalities  Defective electrical conduction  Defective perfusion to Heart musculature (IHD)  Valve defects
  • 10.
    ECG PAPER Dr.Aniket Shilwant,GJPIASR 10  Standard paper divided into 1mm squares of thin lines.  Every 5th line is thick both horizontally & vertically.  Speed of paper – two settings / calibrations  25mm/sec  50mm/sec
  • 11.
    ECG PAPER Dr.Aniket Shilwant,GJPIASR 11 X- Axis – Indicates Time Duration – Measured in Seconds On X- Axis – 1 Small box = 0.04 sec 5 Small box = 0.2 sec 25 Small box = 1 Large box = 1 sec 1500 Small box = 300 Large box = 1 min
  • 12.
    ECG PAPER Dr.Aniket Shilwant,GJPIASR 12 Y- Axis – Indicates Amplitude (current supply) – Measured in millivolts On Y- Axis – 1 Small box = 0.1 mV 5 Small box = 1 Large box = 0.5 mV 10 Small box = 2 Large box = 1 mV
  • 13.
    ECG LEADS Dr.Aniket Shilwant,GJPIASR 13  Types of leads based on Polarity & Location  Classification based on Polarity – Unipolar & Bipolar  Classification based on Location – Chest & Limb  Total leads – 12  Bipolar Limb leads – 03 Lead I, II, III  Unipolar Limb leads – 03 aVR, aVL, aVF  Unipolar Chest leads – 06 V1, V2, V3, V4, V5, V6
  • 14.
  • 15.
    Lead I Dr.Aniket Shilwant,GJPIASR 15 ECG LEADS – BIPOLAR LIMB LEADS I – Rt. Arm & Lt. Arm II – Rt. Arm & Lt. Foot III – Lt. Arm & Lt. Foot Rt. Foot – Ground conductor / Zero electrode / Earthing electrode
  • 16.
    Lead II Dr.Aniket Shilwant,GJPIASR 16 ECG LEADS – UNIPOLAR LIMB LEADS Unipolar Limb Leads – One electrode is active while other is kept as indifferent potential. aVR – Rt. Arm positive aVL – Lt. Arm positive aVF – Lt. Foot positive
  • 17.
    Chest Leads Dr.Aniket Shilwant,GJPIASR 17 ECG LEADS – UNIPOLAR CHEST LEADS
  • 18.
    Frontal Plane Horizontal Plane Dr.AniketShilwant, GJPIASR 18 Electrical field covering Heart
  • 19.
  • 20.
    ECG – CardiacAxis Dr.Aniket Shilwant, GJPIASR 20 Cardiac Axis – Cardiac Vector – Direction at which electrical potential generated in the heart travels at an instant.  Direction of spread of depolarization wave defines – Cardiac Axis.  Normal axis – Normal depolarization wave starts from SA node travels downwards towards left lower end at apex.  Normal axis – from 11’O clock – 5’O clock position  Cardiac axis deviation indicates mainly – Ventricular chamber enlargements & Bundle branch block – conduction problems
  • 21.
  • 22.
    Dr.Aniket Shilwant, GJPIASR22 Depolarization at Cardiac Cell Electrical Pathway
  • 23.
    Normal Axis Sr. No Lead ILead III Axis 1 Dominantly +ve Dominantly +ve Normal 2 Dominantly +ve Dominantly -ve Left Axis 3 Dominantly –ve Dominantly +ve Right Axis 4 Dominantly –ve Dominantly -ve Indeterminate Axis * Left Axis = Left Leaves * Right Axis = Right Reaches Dr.Aniket Shilwant, GJPIASR 23
  • 24.
    Left Axis Dr.Aniket Shilwant,GJPIASR 24 Causes for Left Axis - 1. Left Anterior Hemi block 2. Left Ventricular Hypertrophy 3. Inferior wall Myocardial Infarction 4. Apical Pacing
  • 25.
    Right Axis Dr.Aniket Shilwant,GJPIASR 25 Causes for Right Axis deviation – 1. Left posterior hemi block 2. Right Ventricular Hypotrophy 3. Reversed arm electrodes 4. Dextrocardia
  • 26.
    ECG Waves Dr.Aniket Shilwant,GJPIASR 26 Normal waves – 5 – PQRST Rarely 6th wave – U – Clinically Insignificant  P wave – Atrial complex – Atrial Depolarization  QRST – Ventricular complex  QRS – Ventricular depolarization  T – Ventricular Repolarization  U – Repolarization of Papillary muscles
  • 27.
    ECG Waves –P wave Dr.Aniket Shilwant, GJPIASR 27 P wave  Short, dome shaped, 1st positive wave  Indicates electrical activity of atria  Indicates – Atrial depolarization  Time period – 0.1 sec  Amplitude – 0.1 – 0.12 mV
  • 28.
    ECG Waves –QRS Complex Dr.Aniket Shilwant, GJPIASR 28 Q wave  Short, 1st negative wave  Indicates depolarization of basal portion of interventricular septum  May be absent in infants – septal defect.  Amplitude – 0.1 - 0.2 mV R wave  Tall, constant positive wave with high amplitude  Indicates depolarization of apical portion of interventricular septum and ventricular musculature  Amplitude – 1mV S wave  Short, negative wave  Indicates depolarization of basal portion of ventricular musculature  Amplitude – 0.4mV  Time period of QRS complex – 0.08 – 0.1 sec
  • 29.
    QRS Complex Patterns Progressionof QRS pattern in Chest leads from V1 to V6 Dr.Aniket Shilwant, GJPIASR 29 ECG Waves – QRS Complex
  • 30.
    ECG Waves –T & U Wave Dr.Aniket Shilwant, GJPIASR 30 T wave  Short, broad, dome shaped positive wave  Indicates – repolarization of ventricles  Time period – 0.2 sec  Amplitude – 0.3 mV U wave  Rare and insignificant  Positive wave Followed after T wave  Indicates – repolarization of Papillary muscles, Purkinje fibers
  • 31.
    ECG Intervals /Segments Dr.Aniket Shilwant, GJPIASR 31 Time interval (x-axis = sec) between either onset or end of any of the two waves – Interval/ Segment 1. PR interval 2. QT interval 3. ST segment 4. RR interval
  • 32.
    ECG Intervals –PR & QT Dr.Aniket Shilwant, GJPIASR 32 PR interval  Starts from onset of P wave ends at starting point of Q wave  Includes only one waveform in it = P wave  Indicates time taken by impulse to travel from SA node to AV node  Time period – 0.12sec – 0.2sec QT interval  Starts from onset of Q wave ends end point of T wave  Includes waveforms in it = Q,R,S,T waves  Indicates complete electrical activity of ventricles (depolarization and repolarization)  Time period – 0.40sec – 0.42sec
  • 33.
    Dr.Aniket Shilwant, GJPIASR33 ST segment  Starts where S wave ends and ends at starting point of T wave  Includes no any waveform in it.  Normally it is Isoelectric in nature  Time period – 0.08 sec RR interval  Time interval between successive R waves  Thus it Indicates 1 heart beat.  Also it indicates 1 complete cardiac cycle.  Time period – 0.8 sec ECG Intervals – ST & RR
  • 34.
    Complete Single ECGComplex Dr.Aniket Shilwant, GJPIASR 34
  • 35.
    Specifications of Waves& Intervals of Normal ECG Dr.Aniket Shilwant, GJPIASR 35 Wave Extent Cause Duration in seconds Amplitude in mV P wave - Atrial Depolarization 0.1 0.1 to 0.2 mV QRS complex Onset of Q wave to end of S wave Ventricular Depolarization 0.08 to 0.1 Q – 0.1 TO 0.2mV R – 1mV S – 0.3mV T wave - Ventricular Repolarization 0.2 0.3mV PR interval End of P wave to onset of Q wave Conduction of impulse from SA to AV node 0.12 – 0.20 - QT interval Onset of Q wave to end of T wave Electrical activity of ventricles 0.4 – 0.42 - ST segment Starts from end of S wave and ends prior start of T wave Isoelectric 0.08 -
  • 36.
    How to determineHeart rate by ECG? Dr.Aniket Shilwant, GJPIASR 36 RR Interval (Large squares) Heart rate per min. 01 300 02 150 03 100 04 75 05 60 Count small or large squares between two R waves. This is nothing but RR interval. 1 small square = 0.04 sec 1 large square = 5 small square = 0.2 sec 5 large square = 25 small square = 1 Sec 300 large square = 1500 small square = 1min Heart rate = 1500 / N (N is no. of small squares in between two R waves) Heart rate = 300 / N (N is no. of large squares in between two R waves)
  • 37.
    Dr.Aniket Shilwant, GJPIASR37 Wave Pathologies
  • 38.
    P wave Dr.Aniket Shilwant,GJPIASR 38 Look for P wave in Lead II P wave –  Absent – Atrial Fibrillation  Tall, Spiked (Above 2.5mm) – P Pulmonale – Rt. Atrial Hypertrophy  Short, Bifid – P Mitrale – Lt. Atrial Hypertrophy
  • 39.
    P wave -RAH & LAH Dr.Aniket Shilwant, GJPIASR 39 Causes for RAH –  Tricuspid Stenosis  Pulmonary Hypertension  Congenital Heart Disease Causes for LAH –  Mitral Stenosis  Mass In the Left Atrium  Cardiomyopathy
  • 40.
  • 41.
  • 42.
  • 43.
    Dr.Aniket Shilwant, GJPIASR43  Right ventricular hypertrophy  Tall R wave in V1, V2 & or Deep S wave in V6  Right Axis deviation  Inverted T wave in V1, V2  Left ventricular hypertrophy  Tall R wave in V5, V6 & or Deep S wave V1, V2  Inverted T wave in Lead I, aVL, V5, V6  Left Axis deviation  Bundle branch block  RBBB – RSR’ pattern in V1  LBBB – RR’ pattern (M pattern) IN V6 QRS Complex Pathologies
  • 44.
  • 45.
  • 46.
    T Wave Dr.Aniket Shilwant,GJPIASR 46 T wave –  Normally inverted in aVR  Tall, peaked with high amplitude T wave seen in – Ischemia T wave inversion seen in –  Myocardial Infarction  Hypokalemia  Ventricular hypertrophy
  • 47.
    PR & QTInetrvals Dr.Aniket Shilwant, GJPIASR 47 PR interval – Prolonged  First degree heart block  Bradycardia Shortened  Tachycardia QT interval – Prolonged  Myocardial infarction  Hypothyroidism  Hypocalcemia Shortened  Hypercalcemia
  • 48.
    ST Segment Dr.Aniket Shilwant,GJPIASR 48 Elevated  Anterior / inferior myocardial infarction  Left bundle branch block Depressed  Acute myocardial ischemia  Hypokalemia  Ventricular enlargements
  • 49.
  • 50.
    Presentation of ECGReport Dr.Aniket Shilwant, GJPIASR 50
  • 51.
    Dr.Aniket Shilwant, GJPIASR51 Dr. Aniket A. Shilwant Assistant Professor GJP-IASR Email – ayuraniket18@gmail.com http://ayugjac.edu.in/Staff_CV.aspx?dl=dn3Mja19480dn3Mja19 http://scholar.google.co.in/citations?user=636K2sMAAAAJ&hl=en https://www.researchgate.net/profile/Aniket_Shilwant Thank you all…!!!