Downloaded 172 times


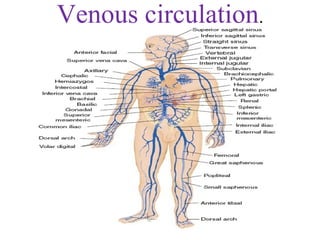
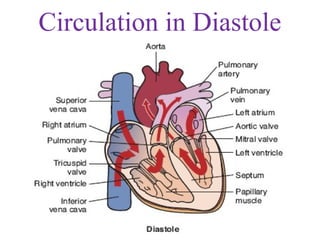
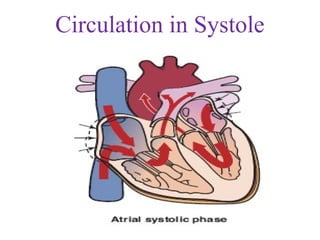

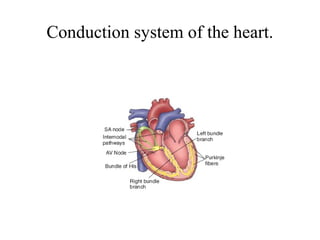


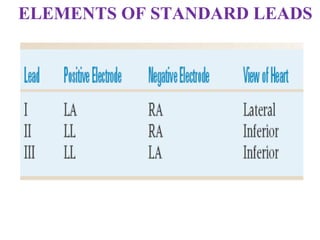


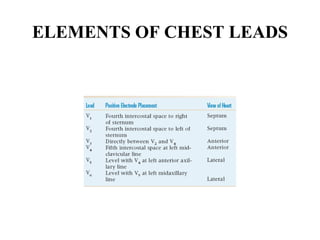
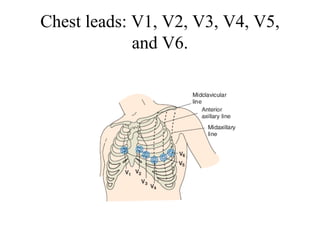


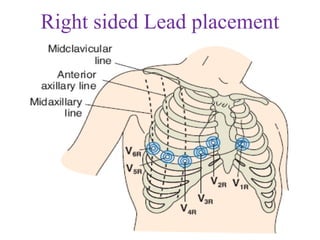


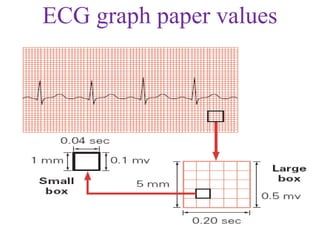


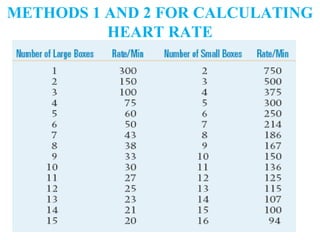


The document provides an overview of the anatomy and function of the heart, detailing heart location, layers, valves, and vascular structures, as well as the electrical activity measured by an ECG. It explains the process of depolarization and repolarization, the leads used in obtaining a 12-lead ECG, and the interpretation of ECG tracings and heart rates. Additionally, it discusses conditions such as normal sinus rhythm and sinus bradycardia, including their characteristics and potential implications.