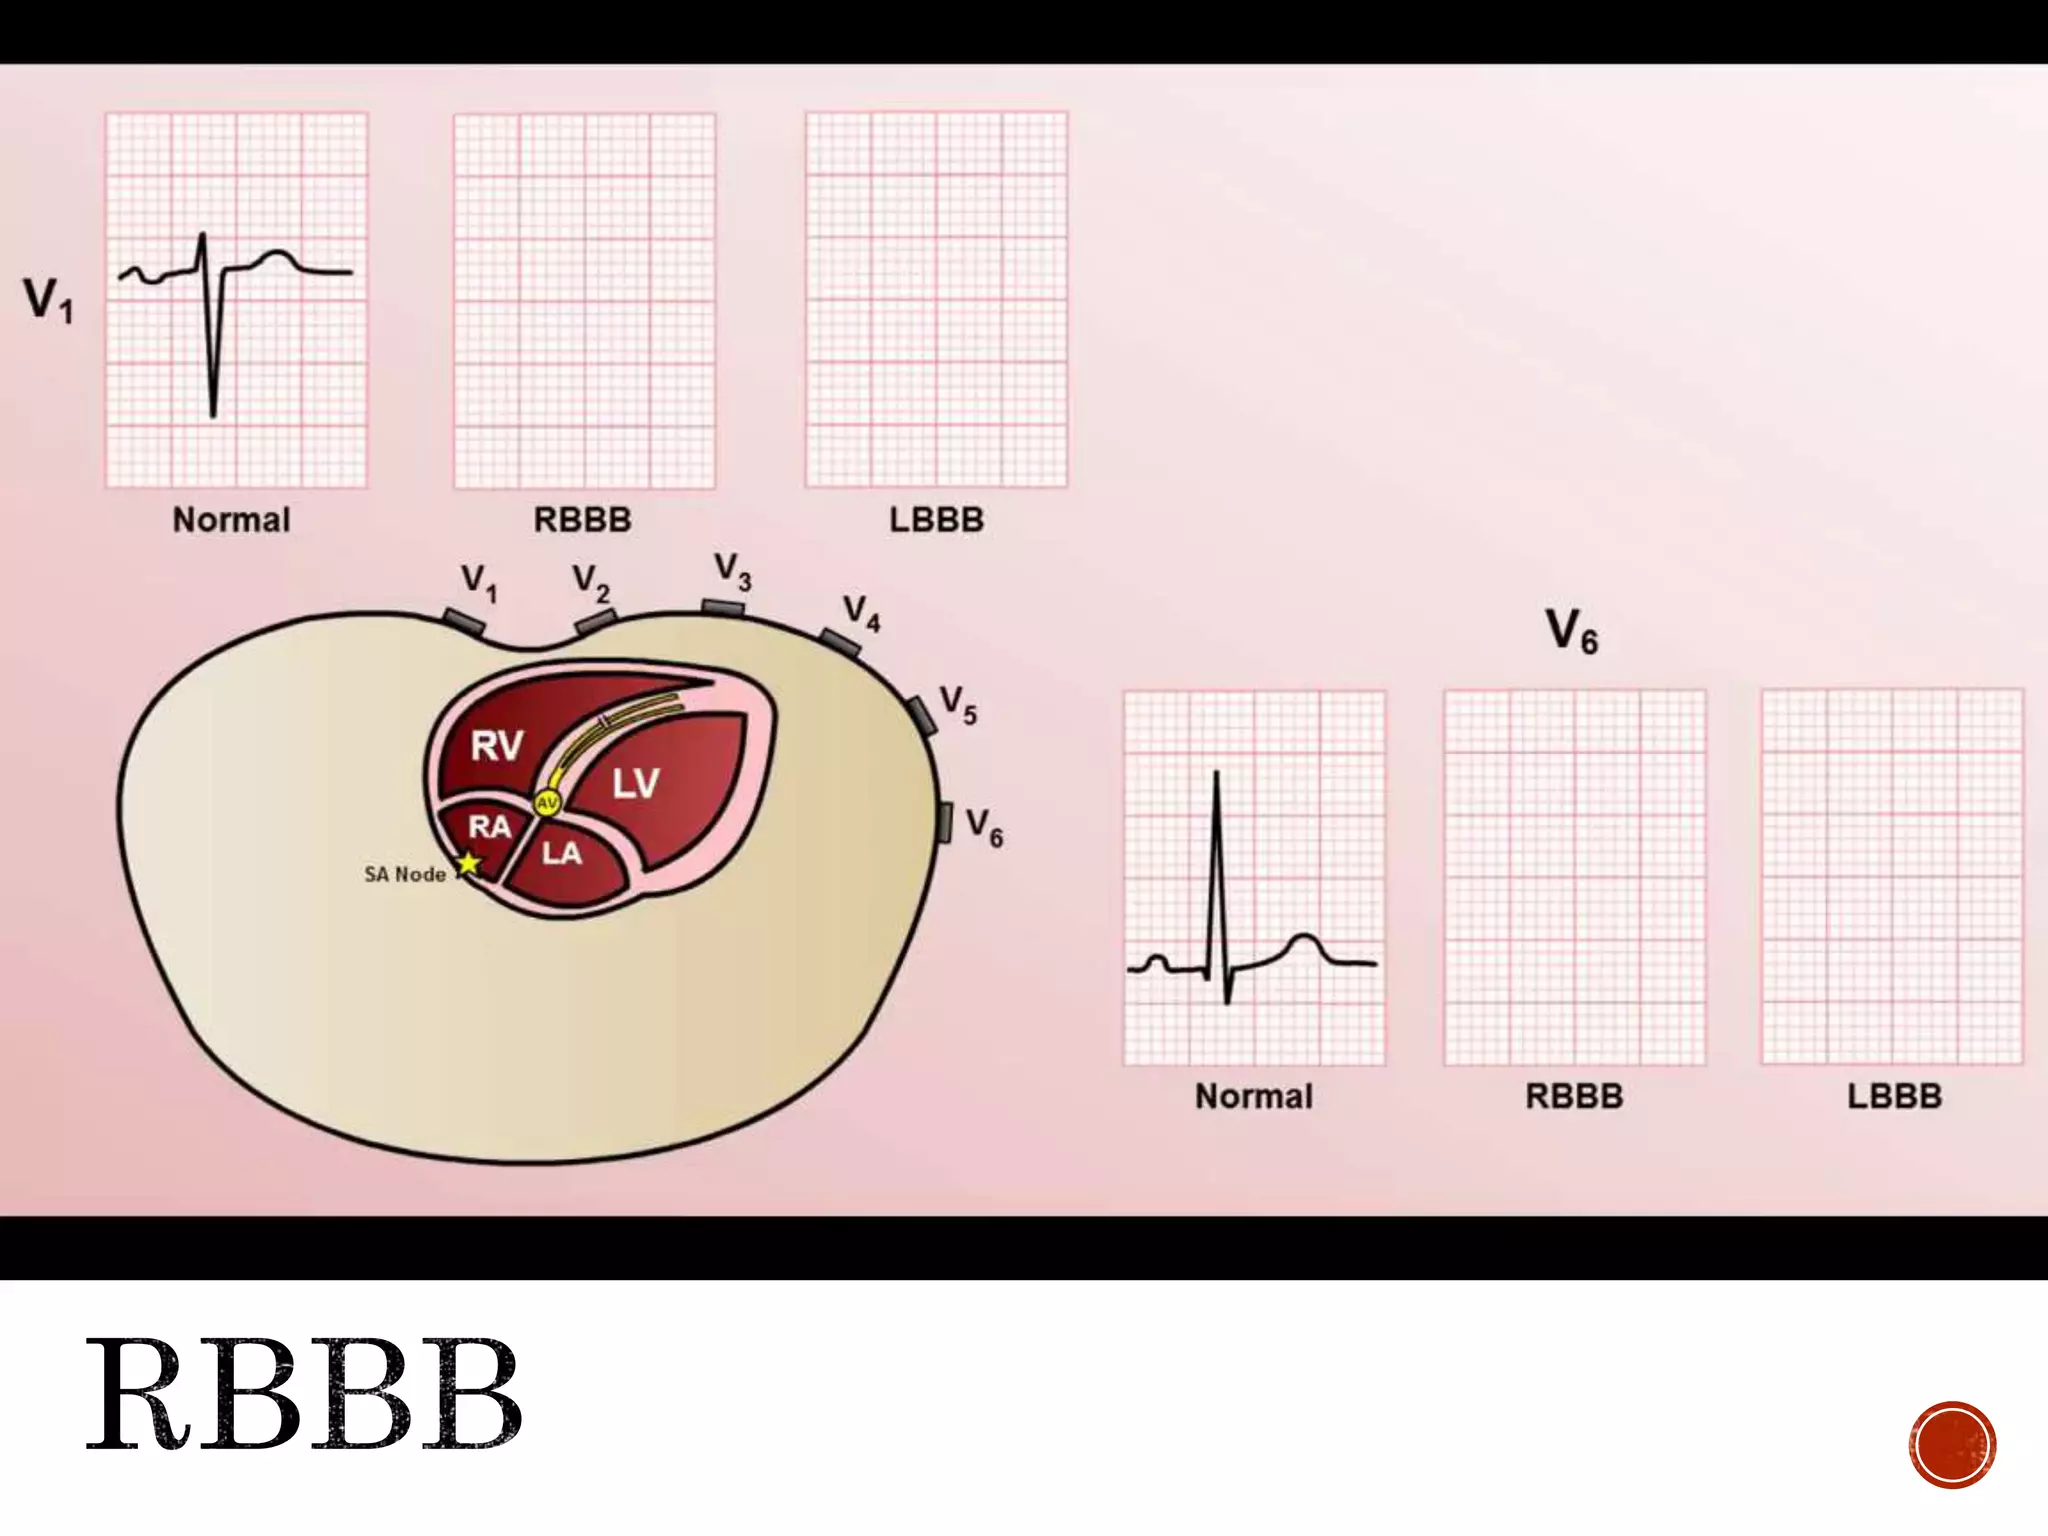
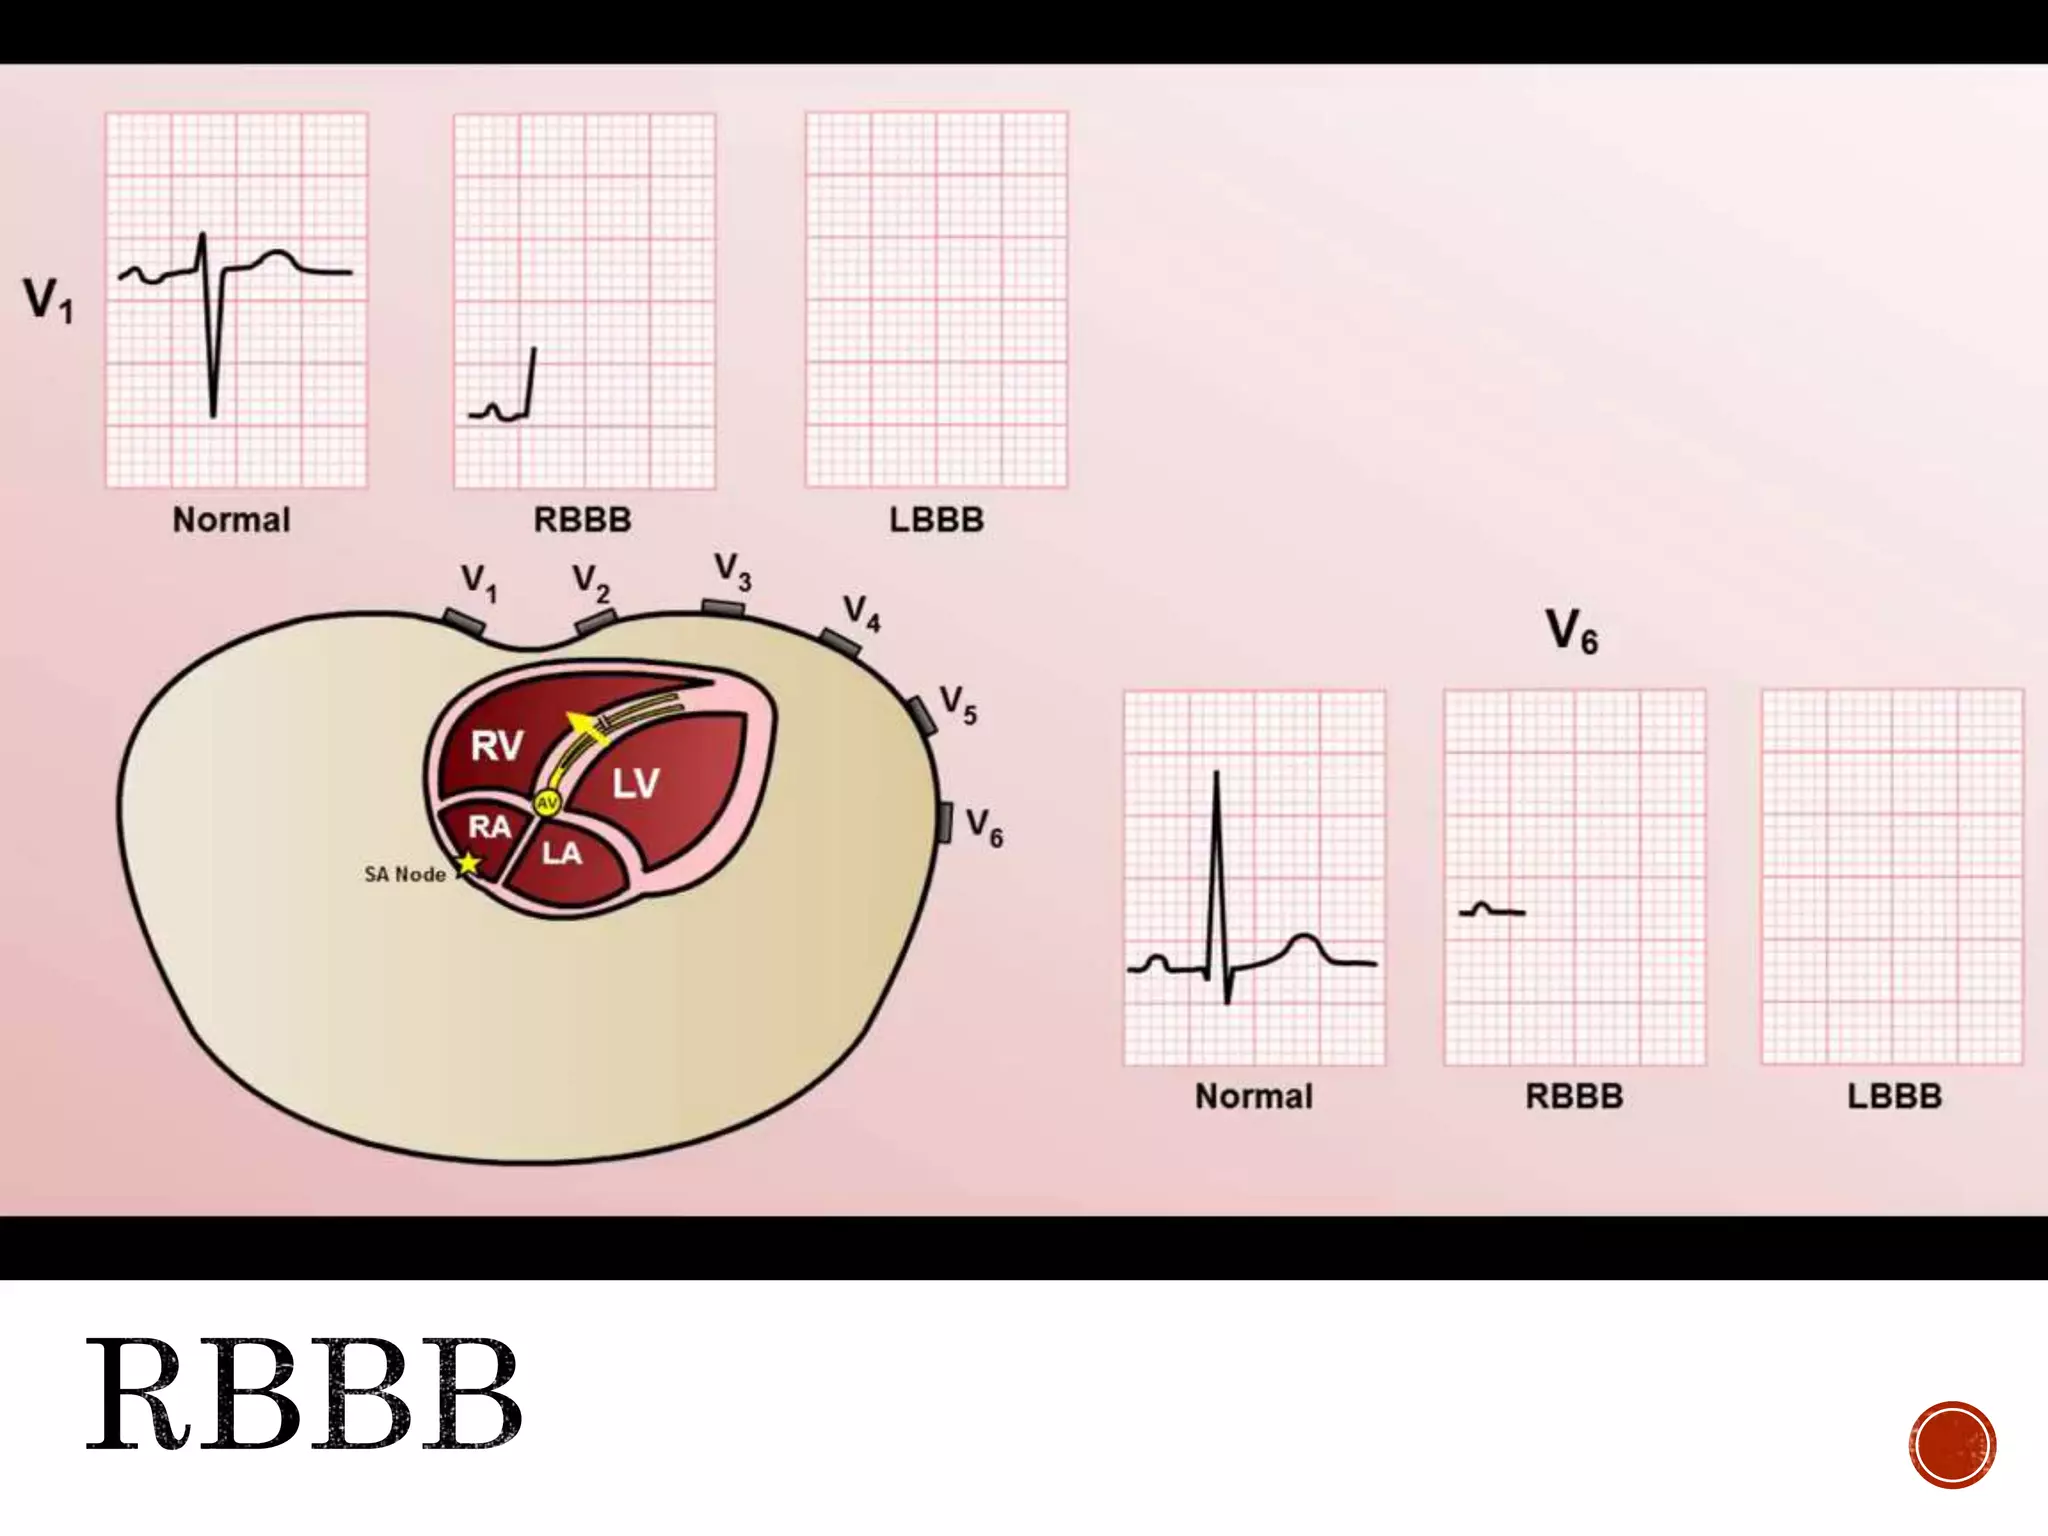
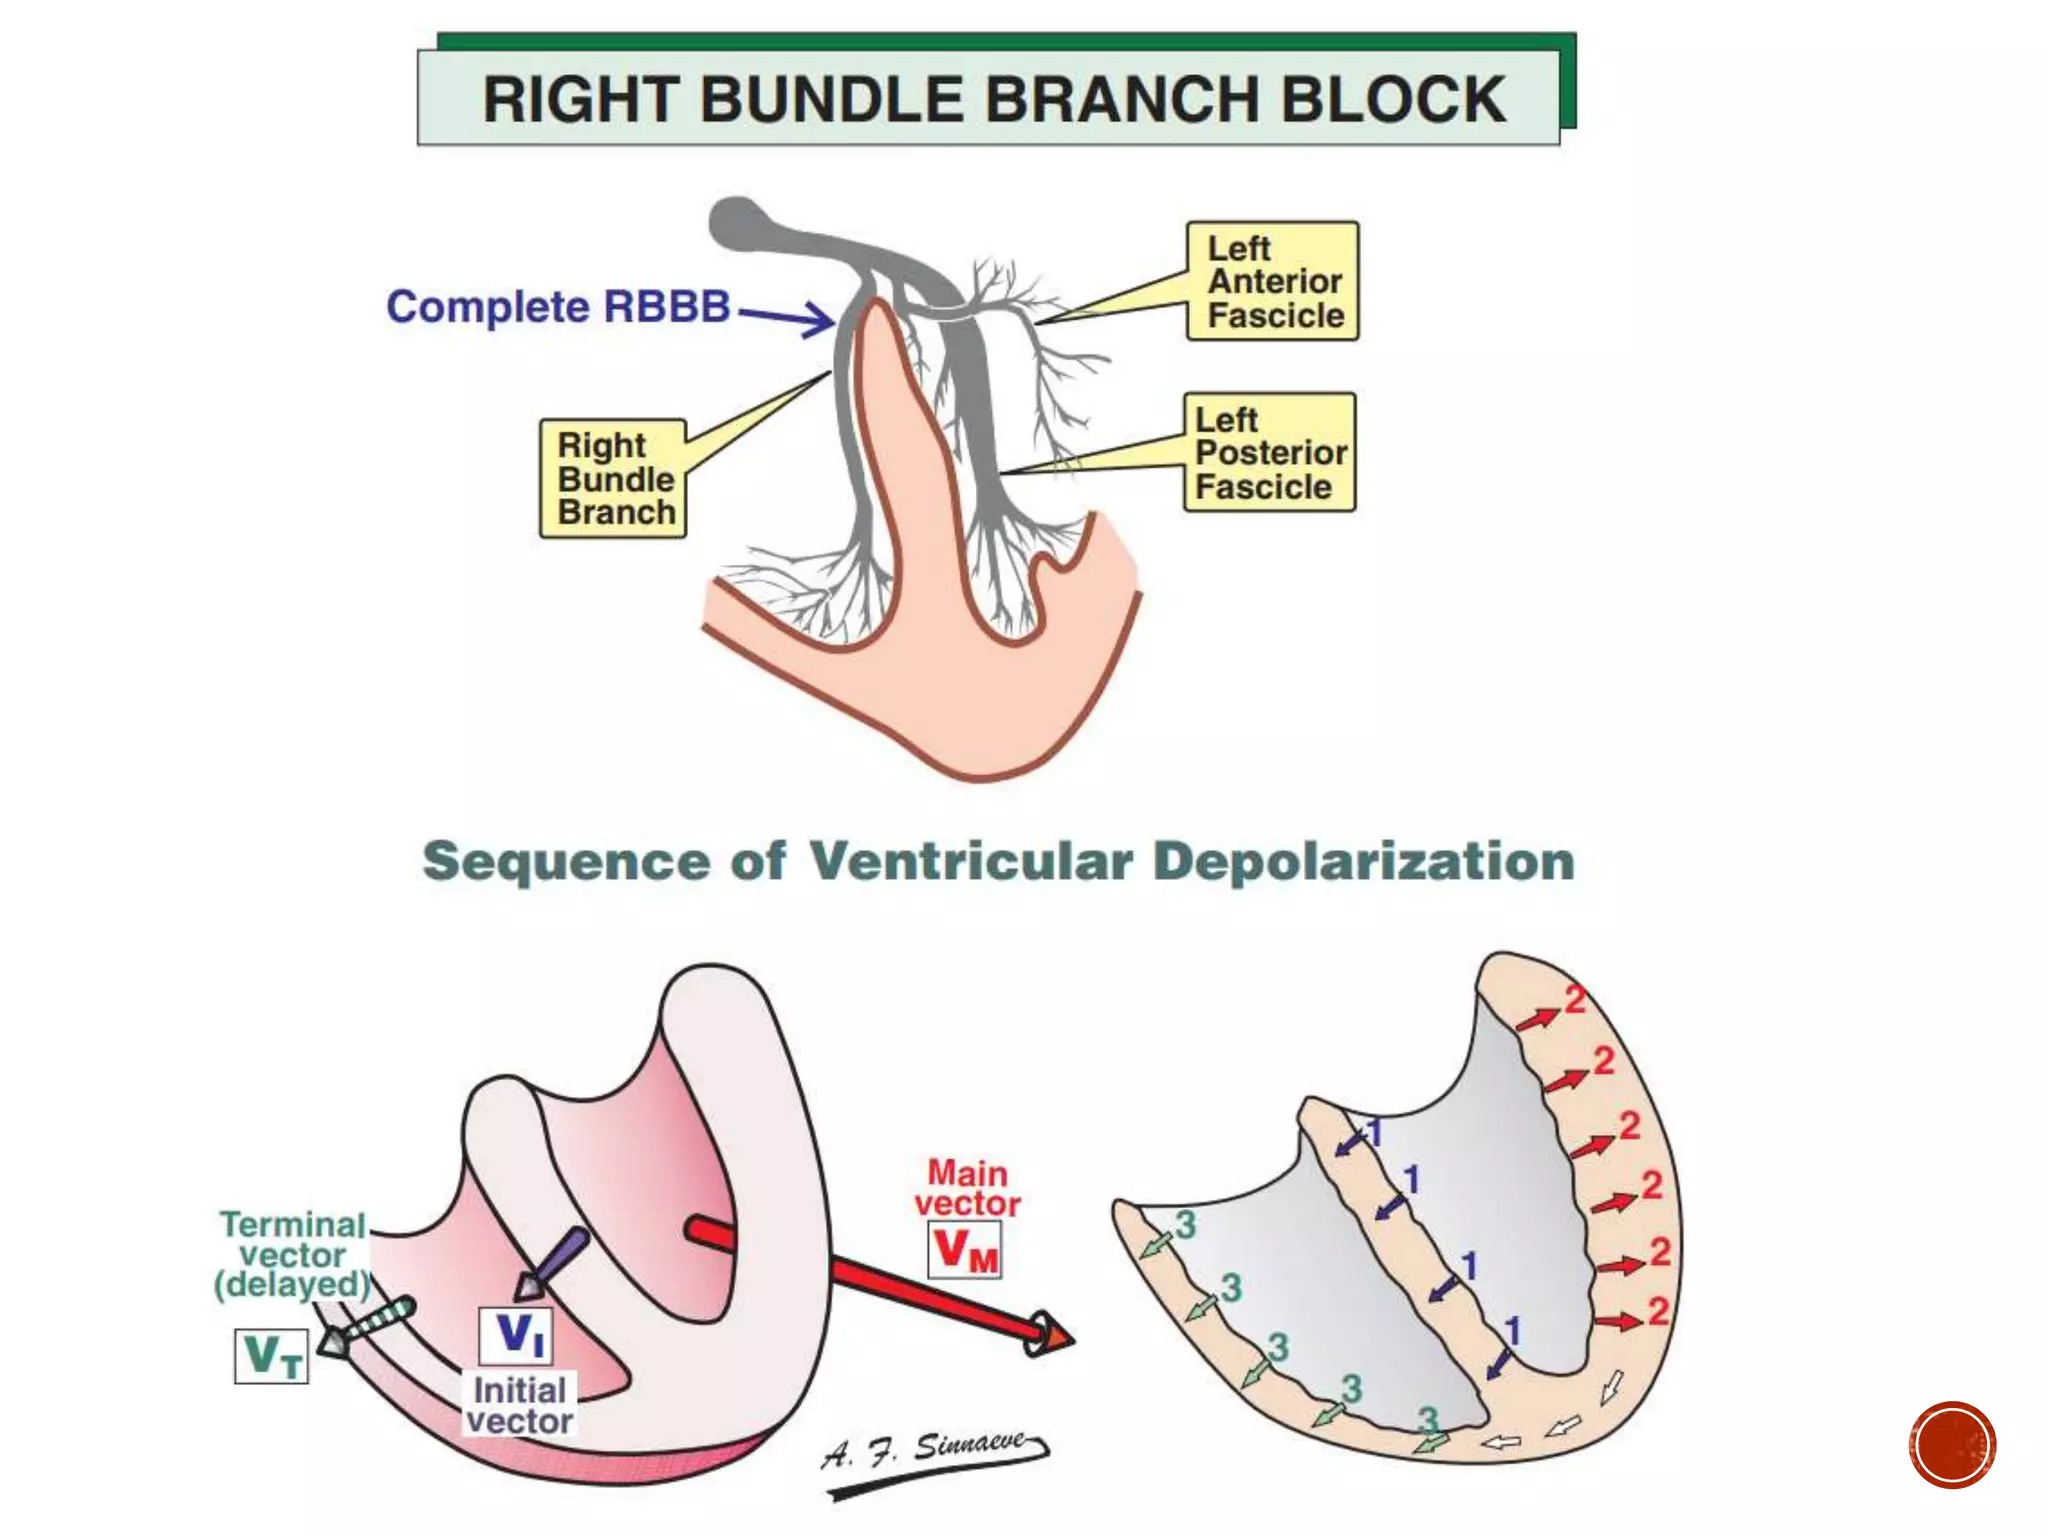
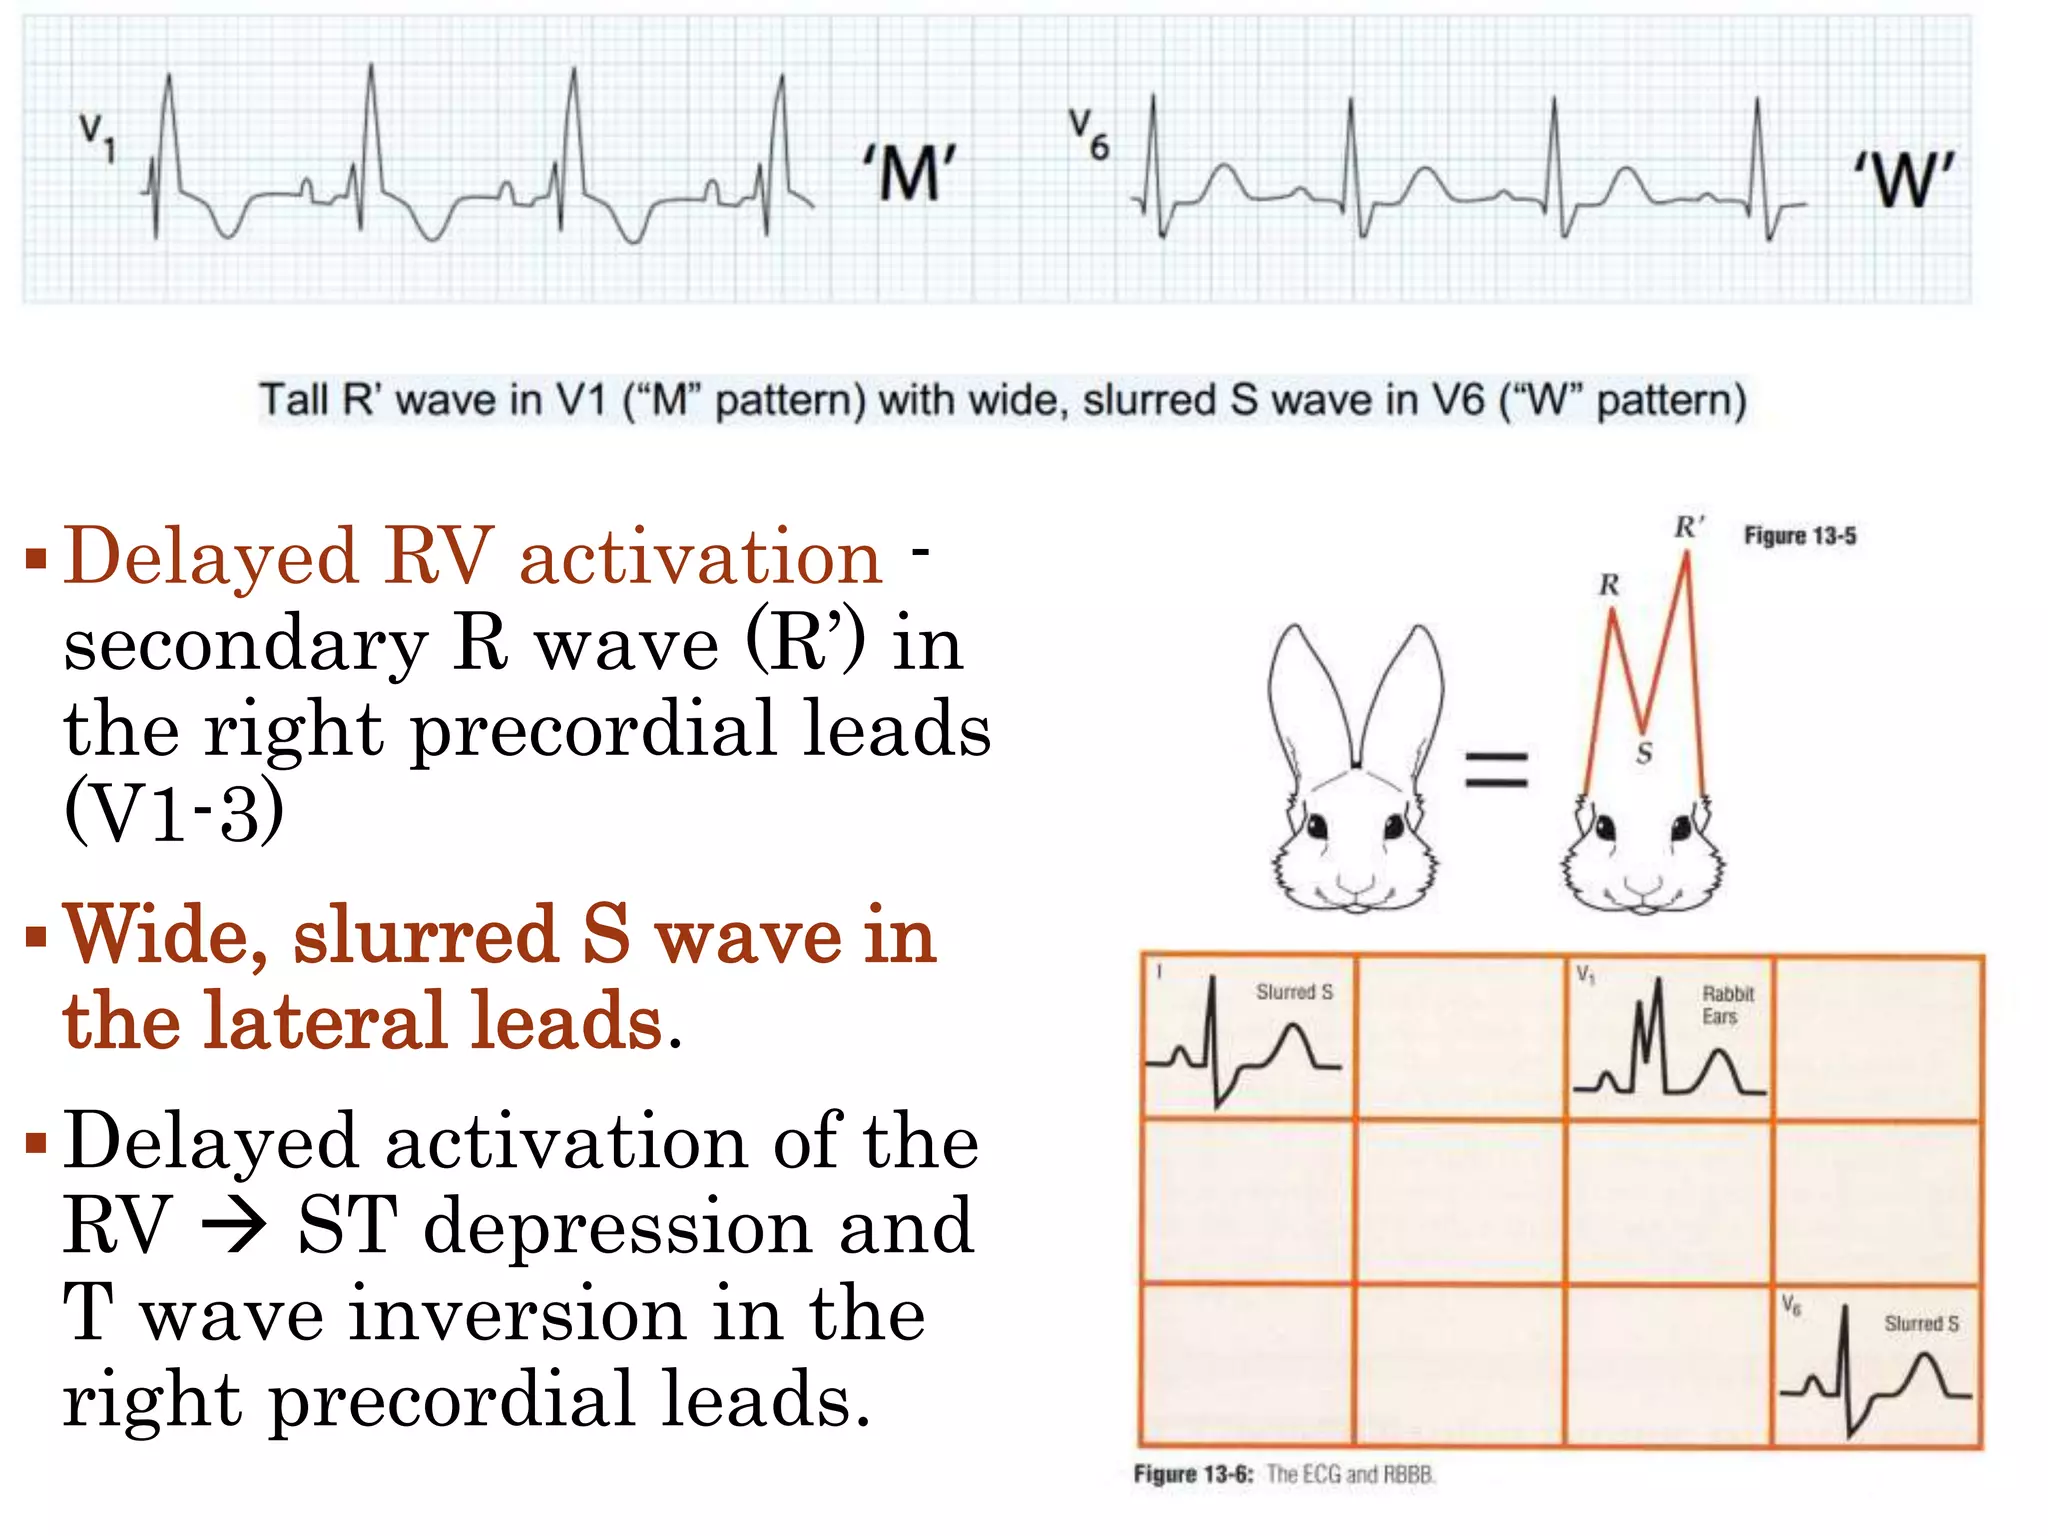
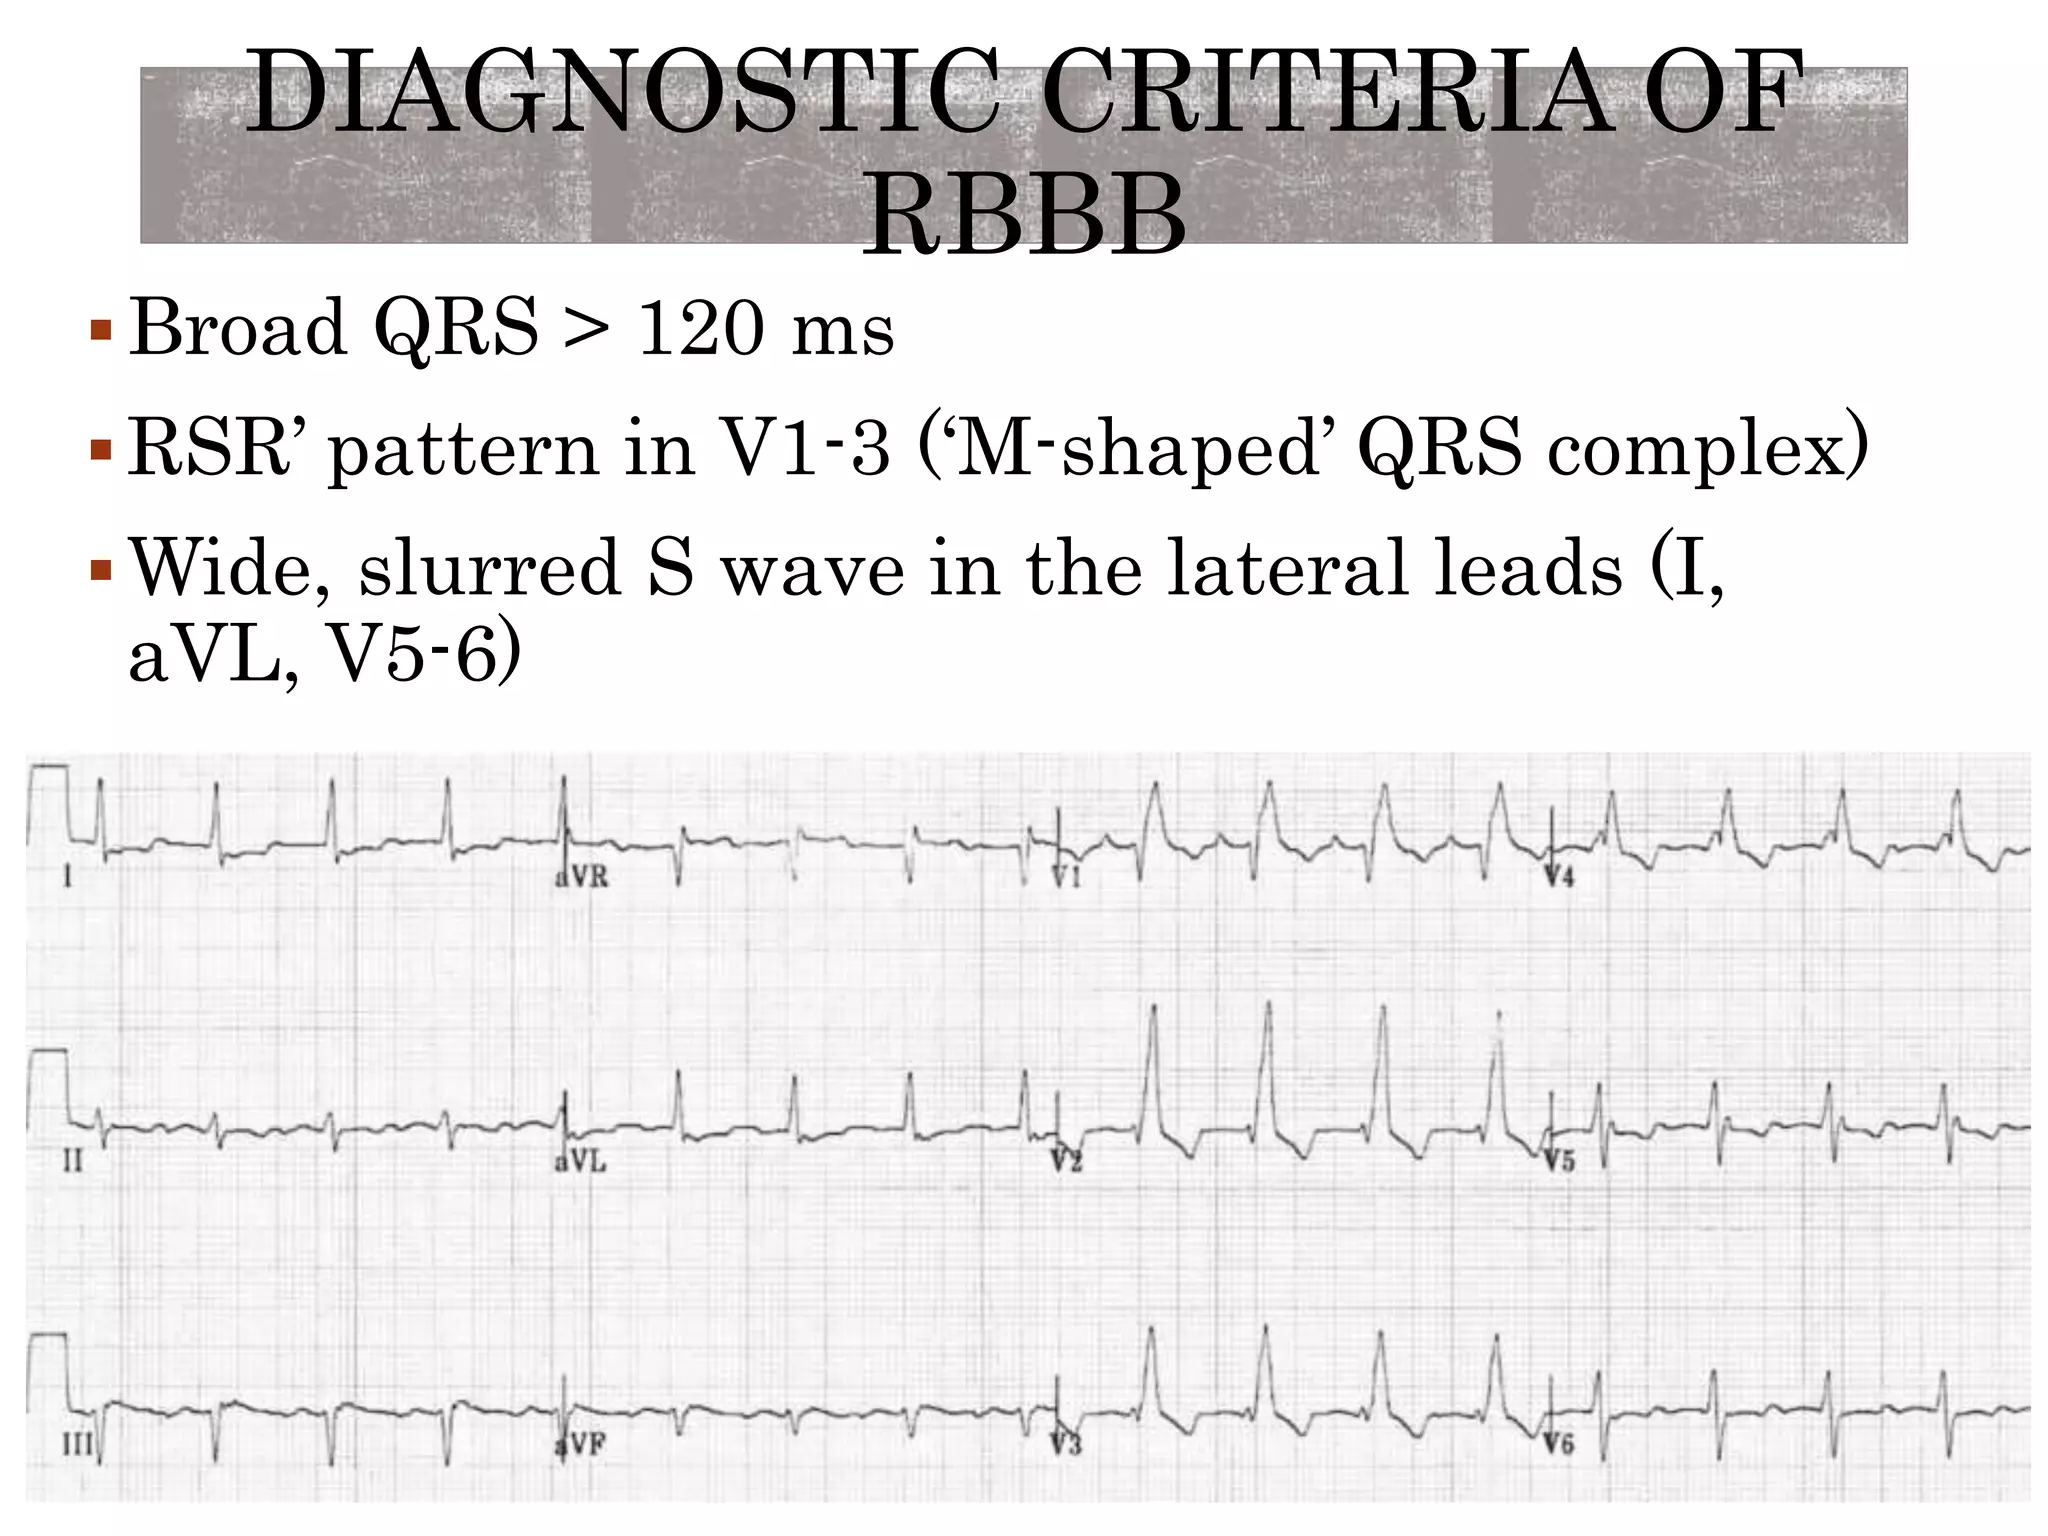
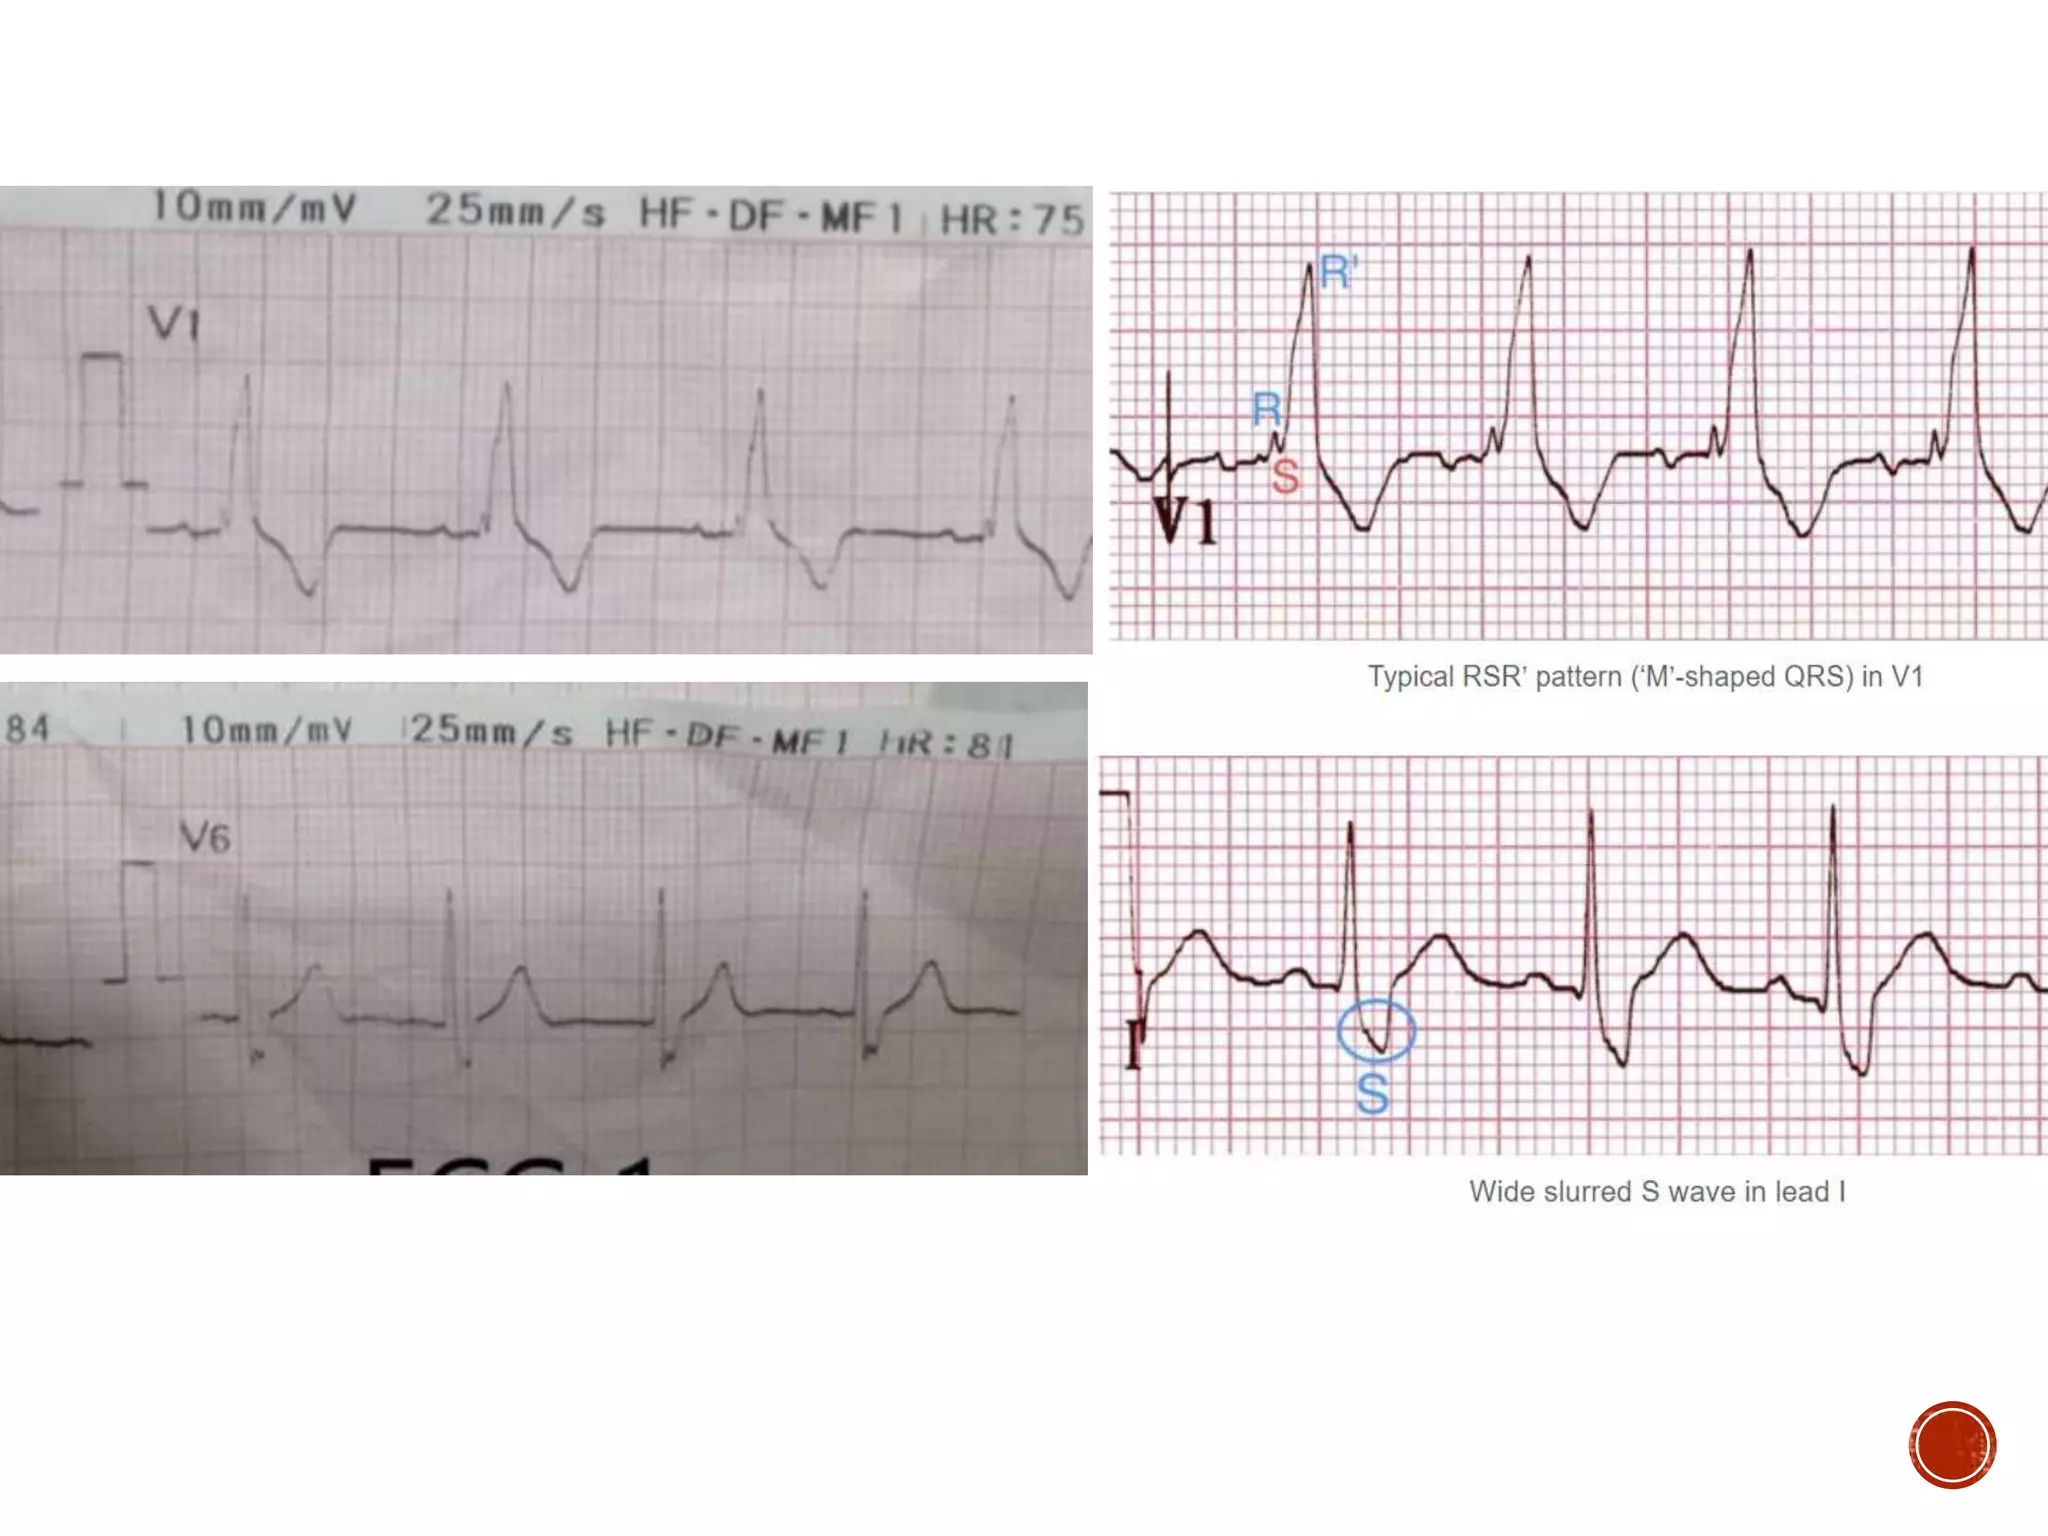
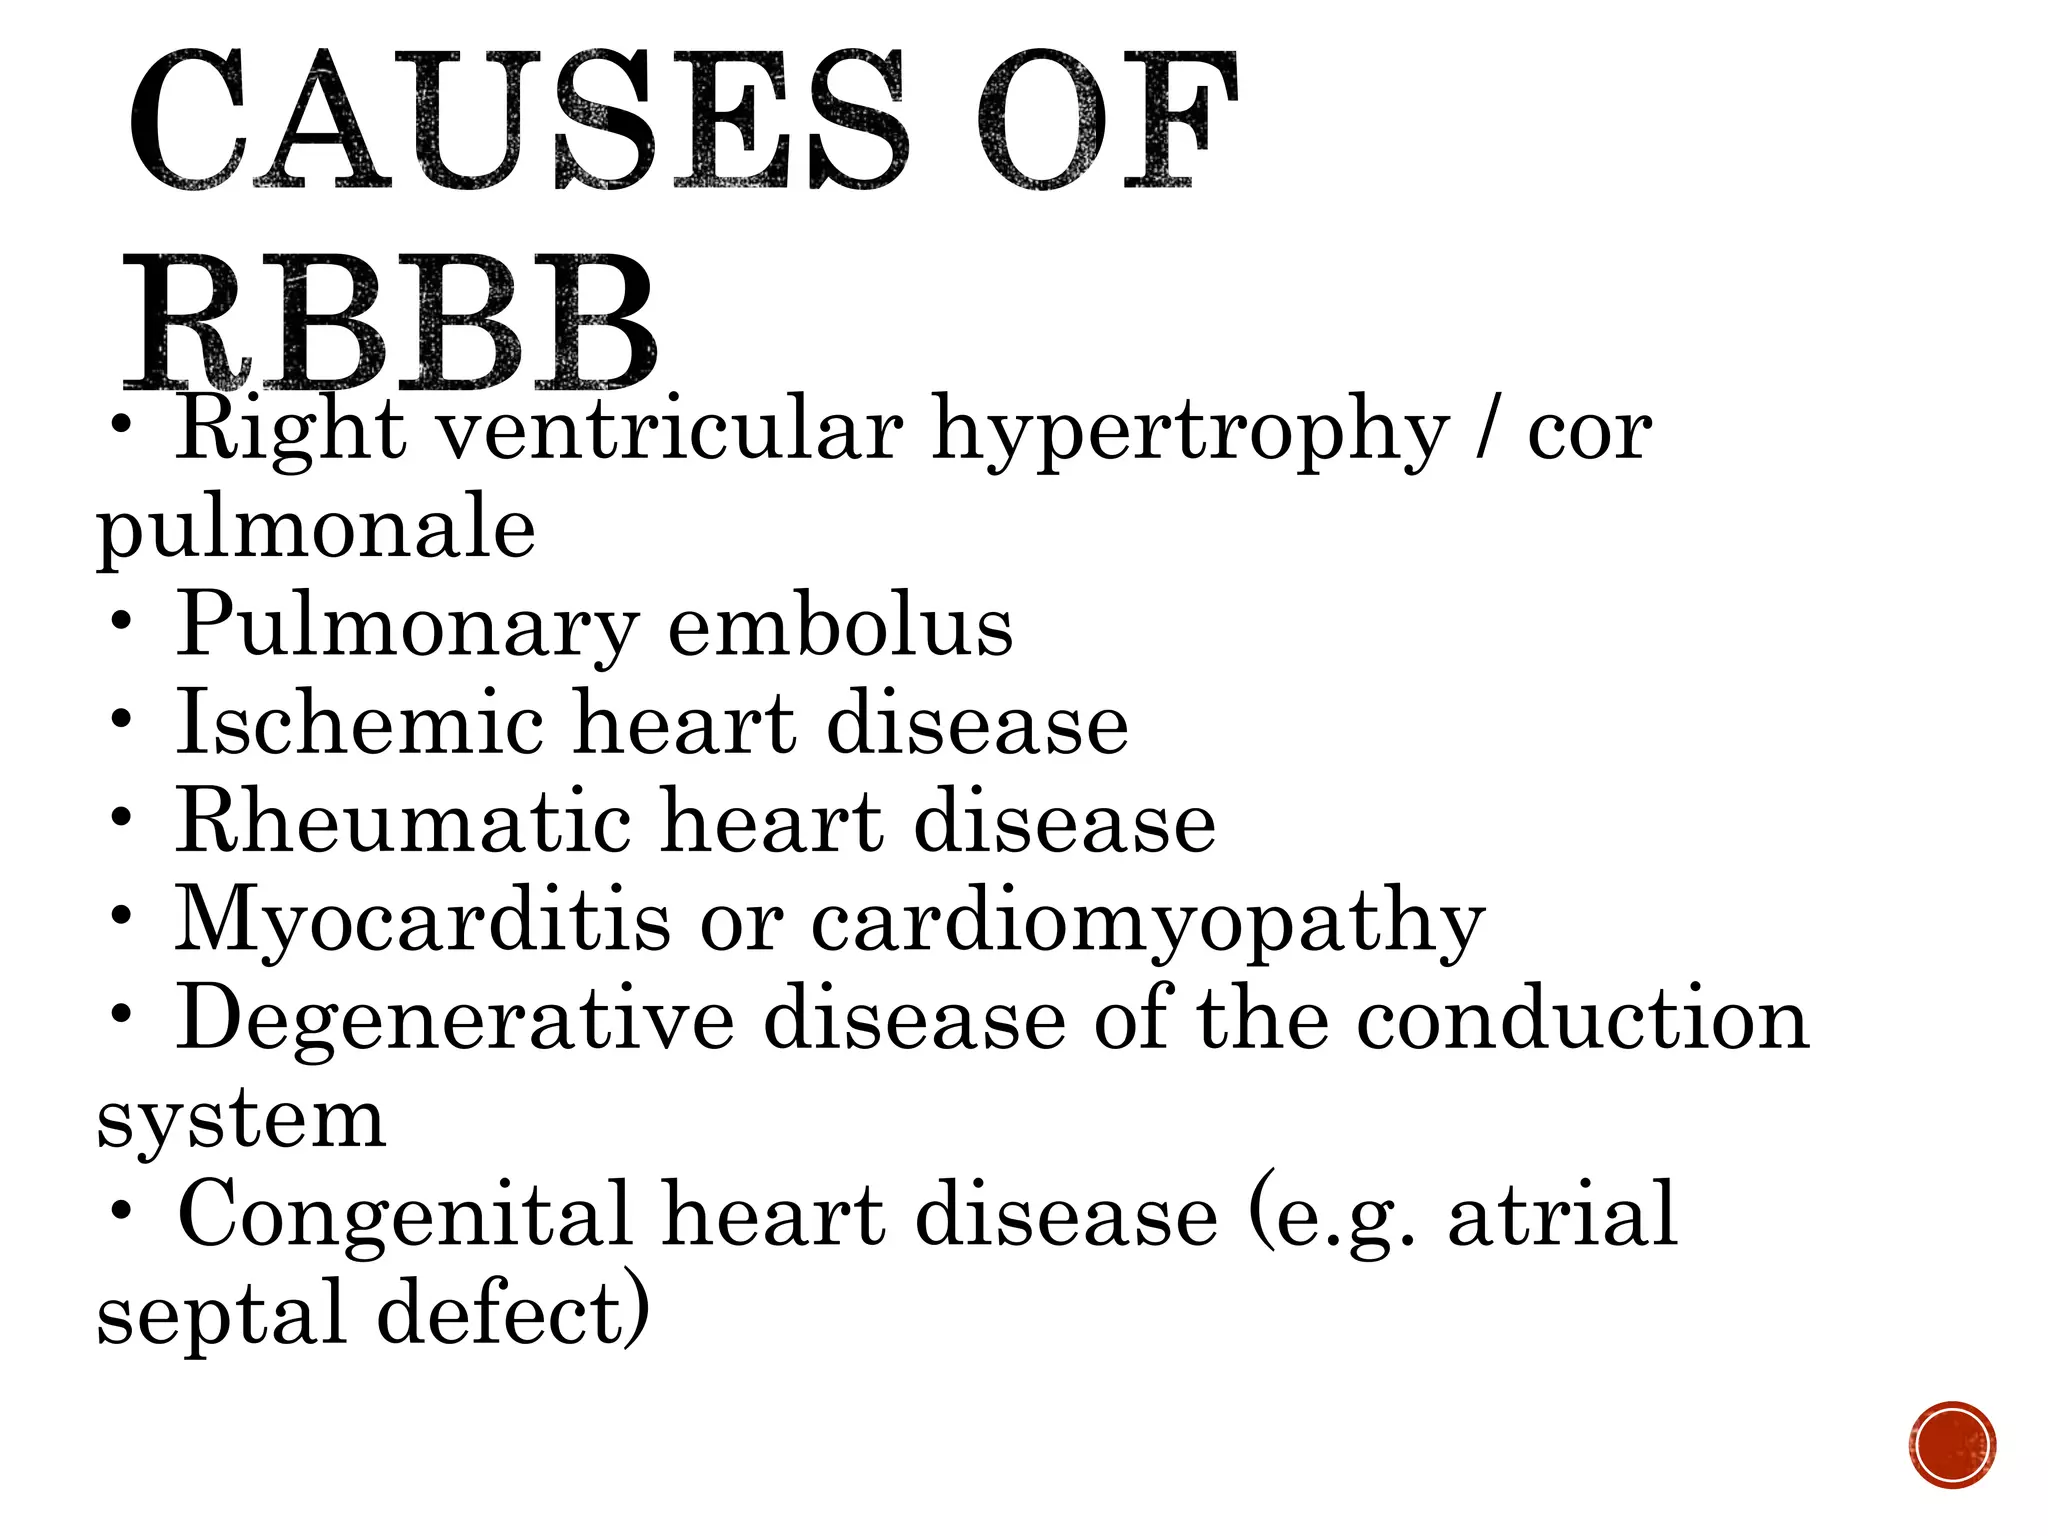
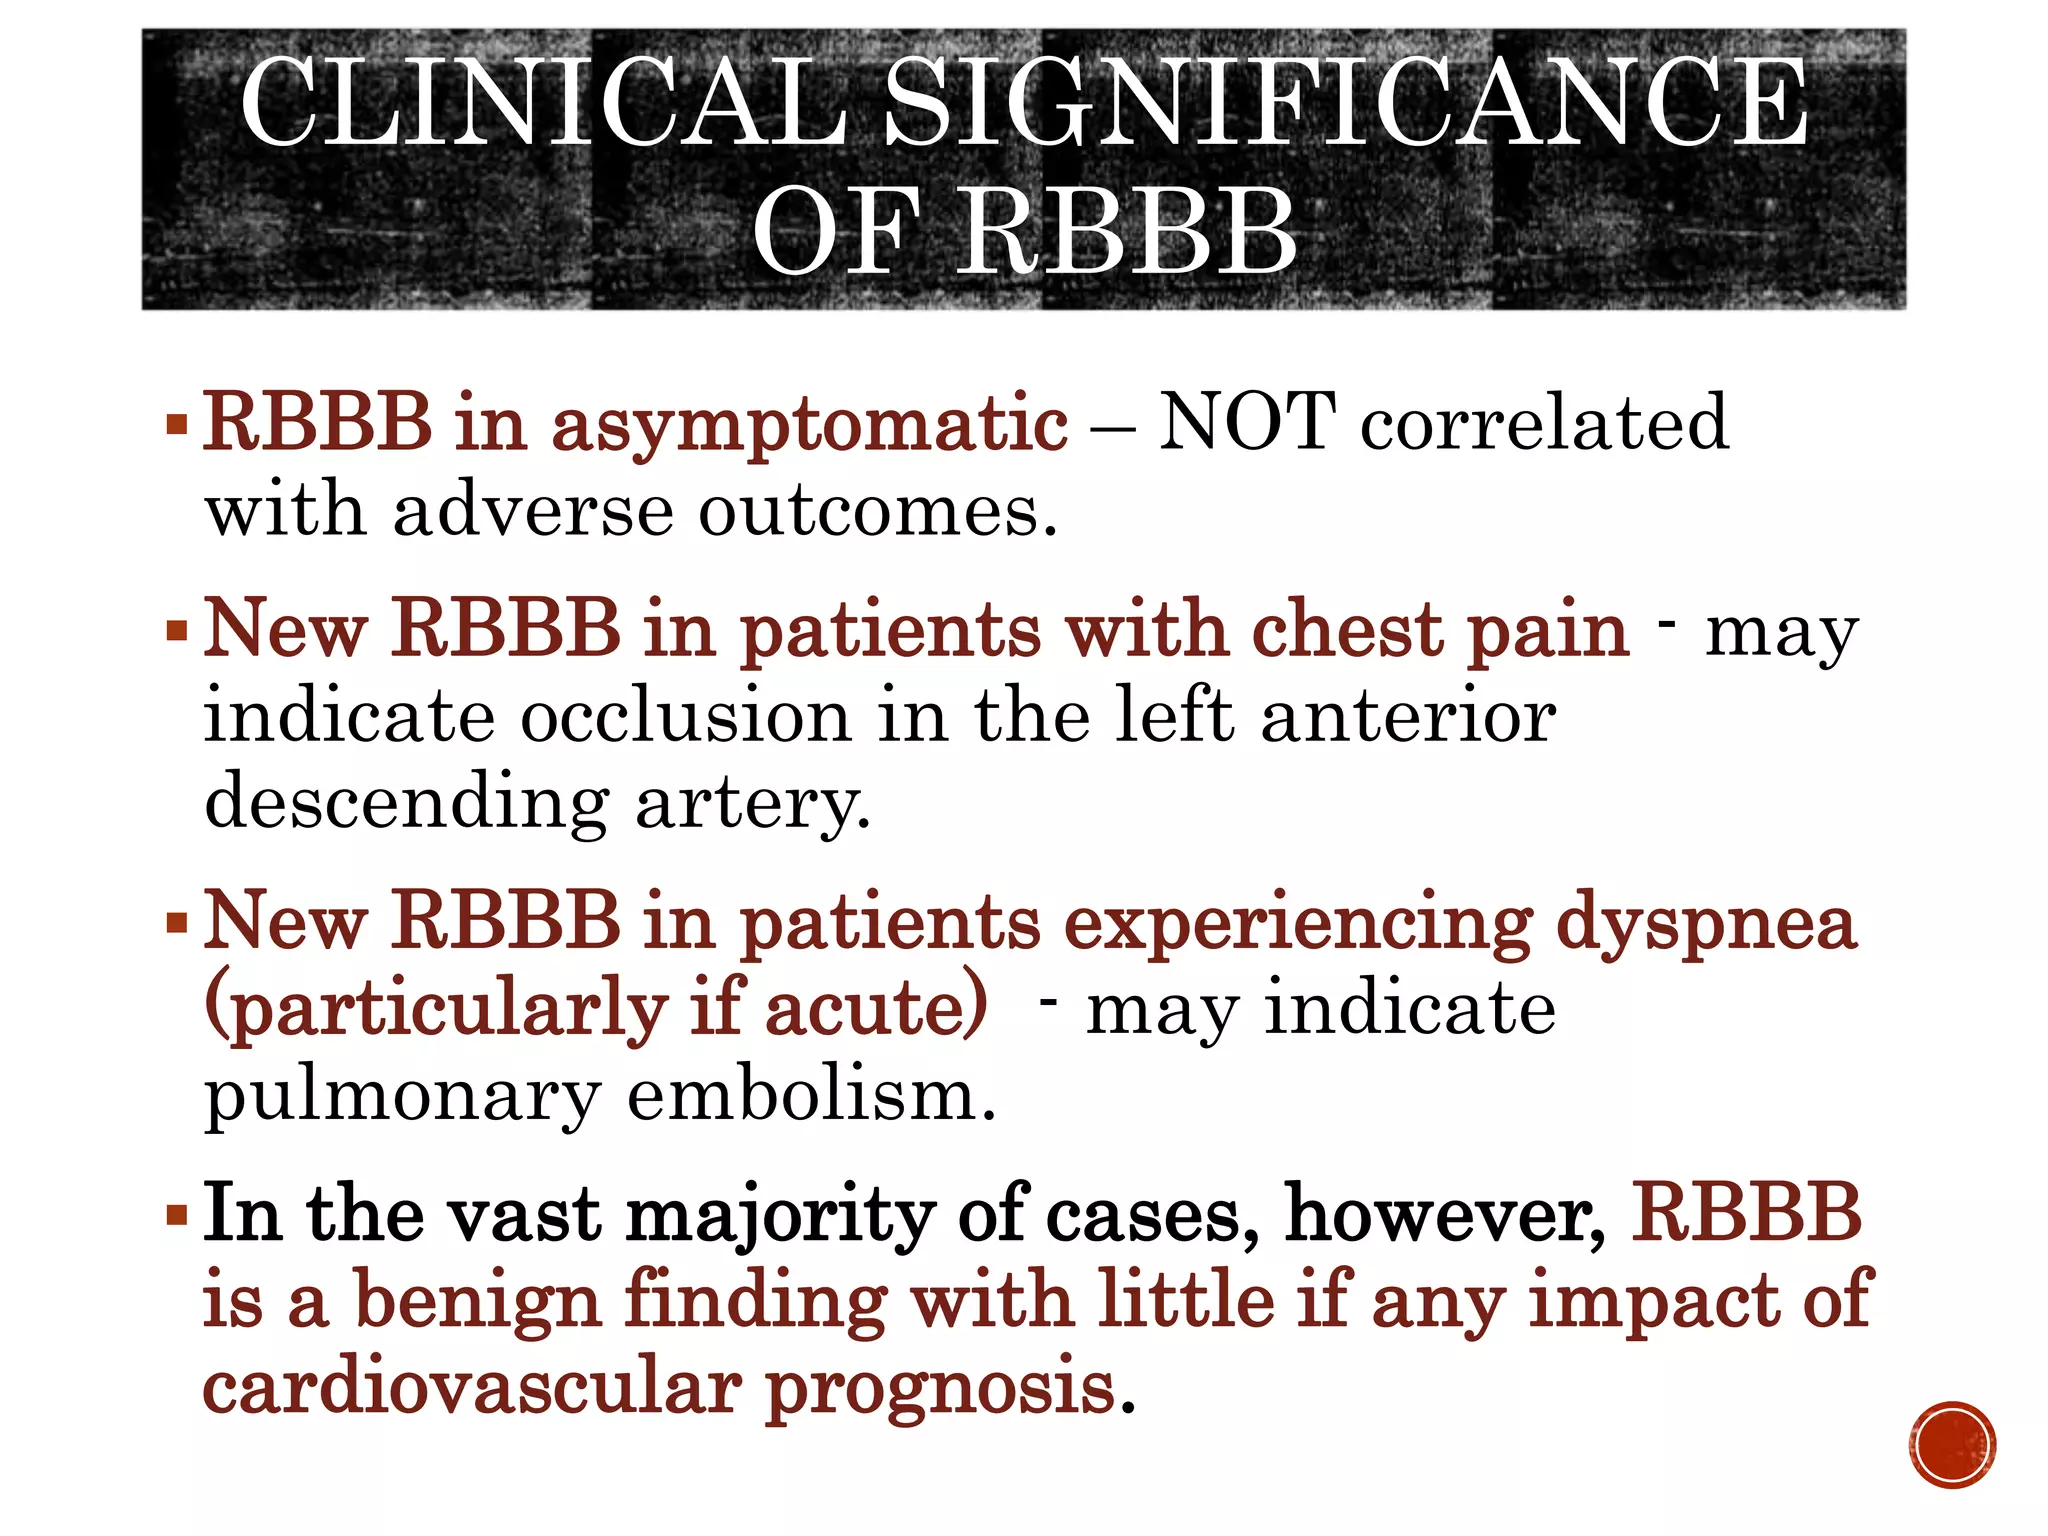
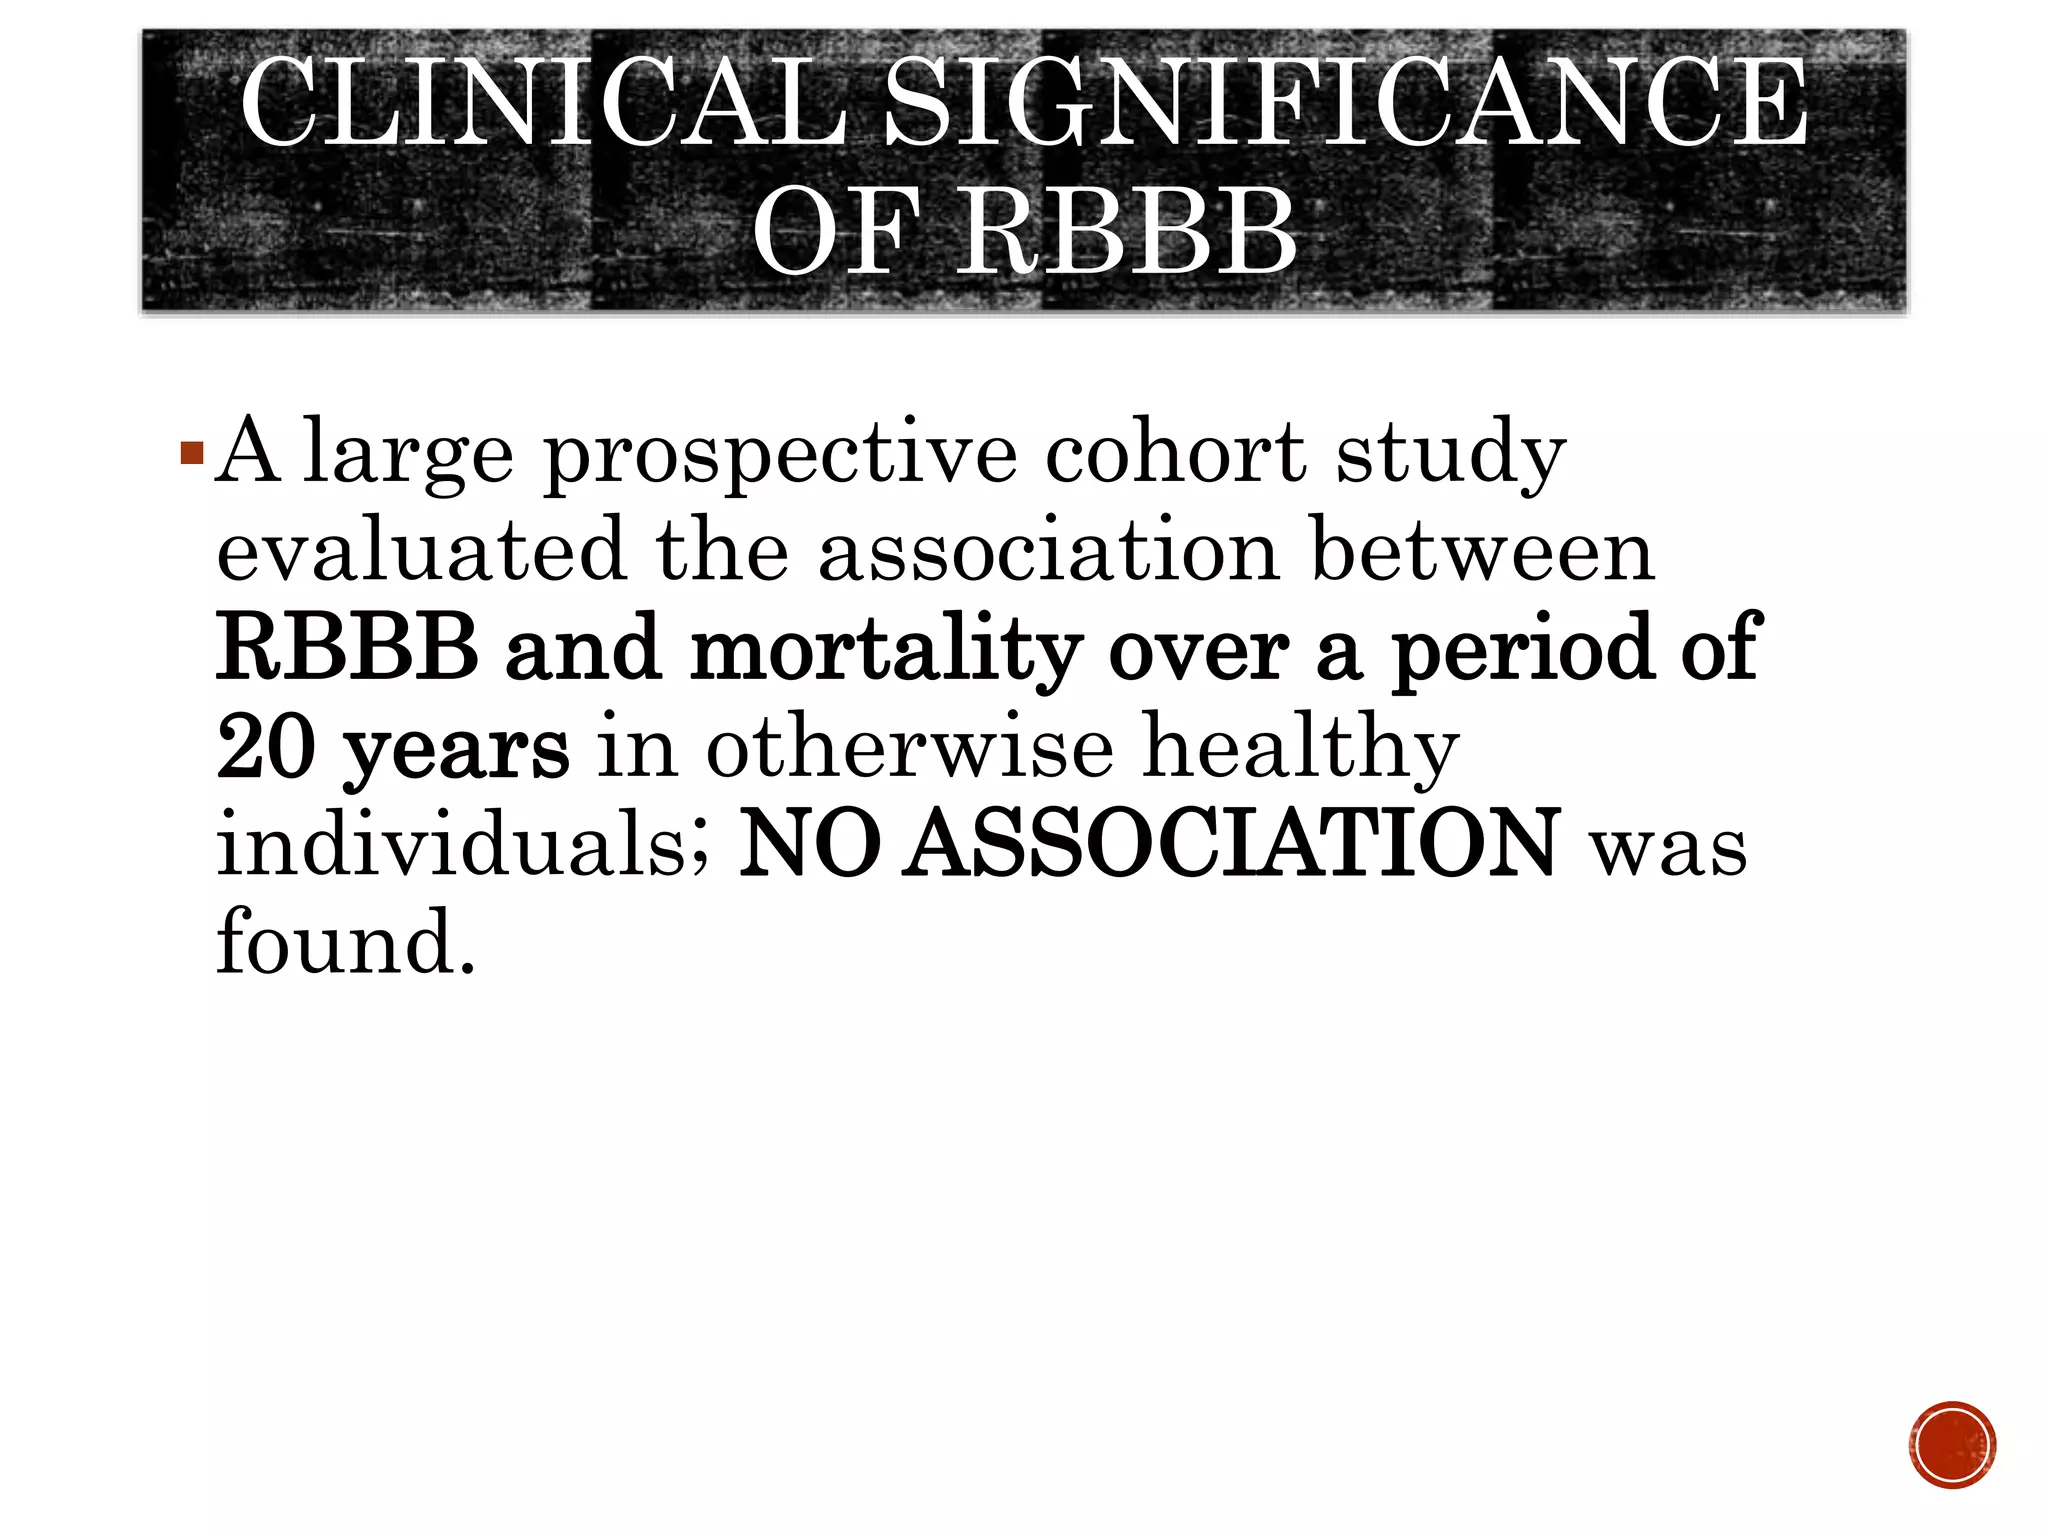
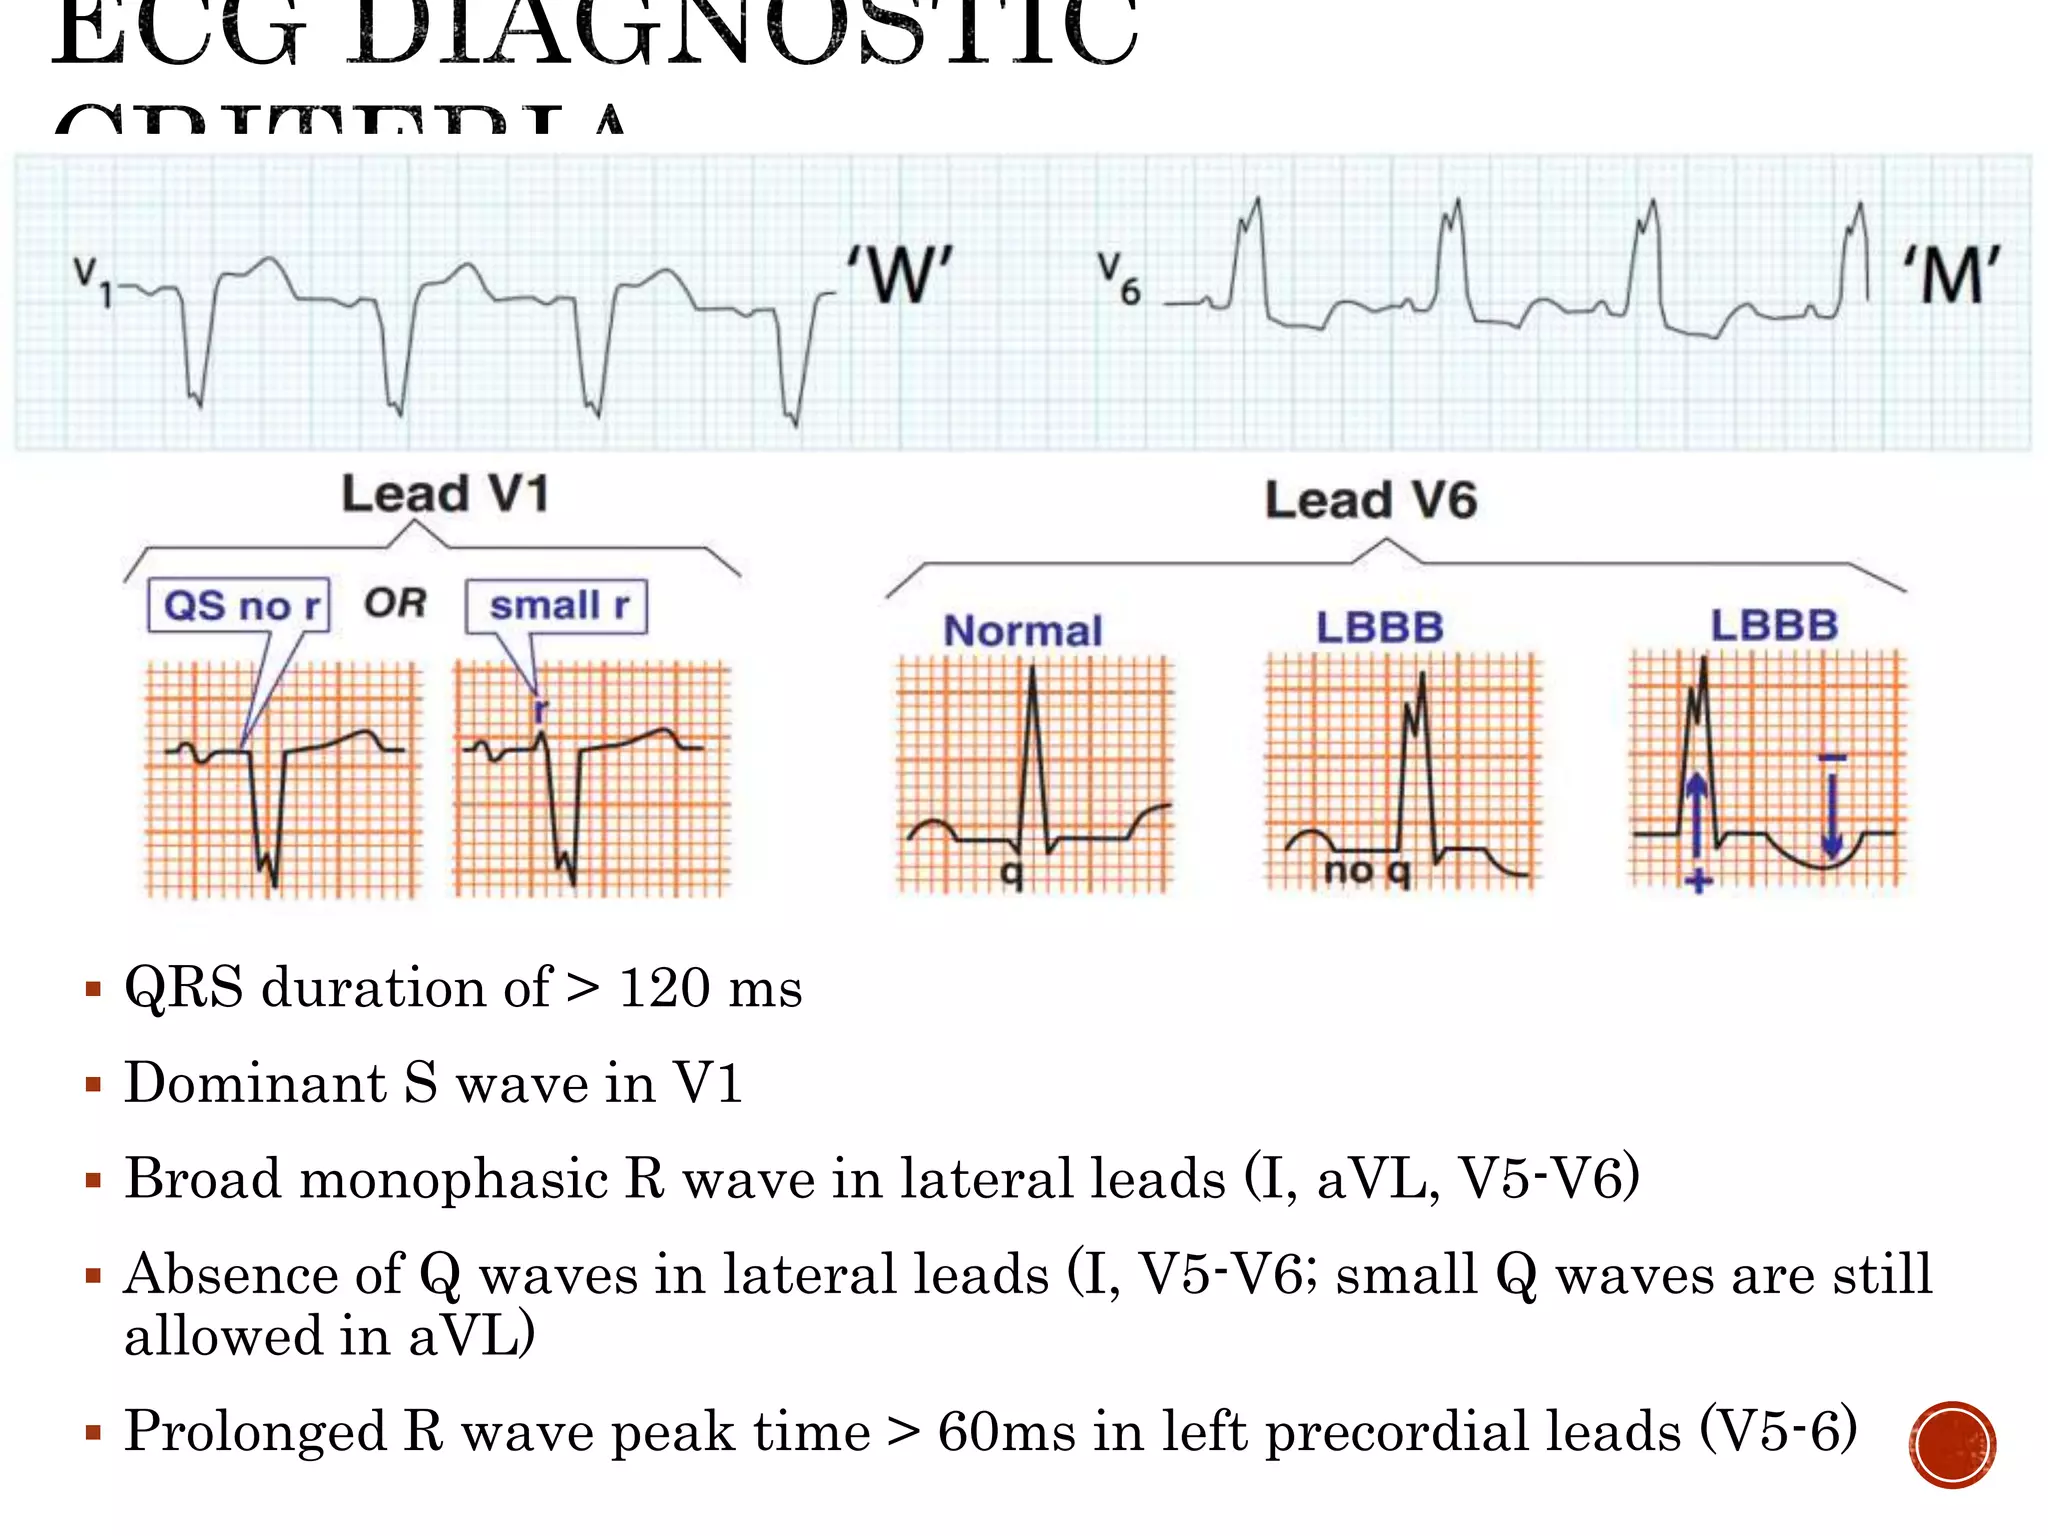
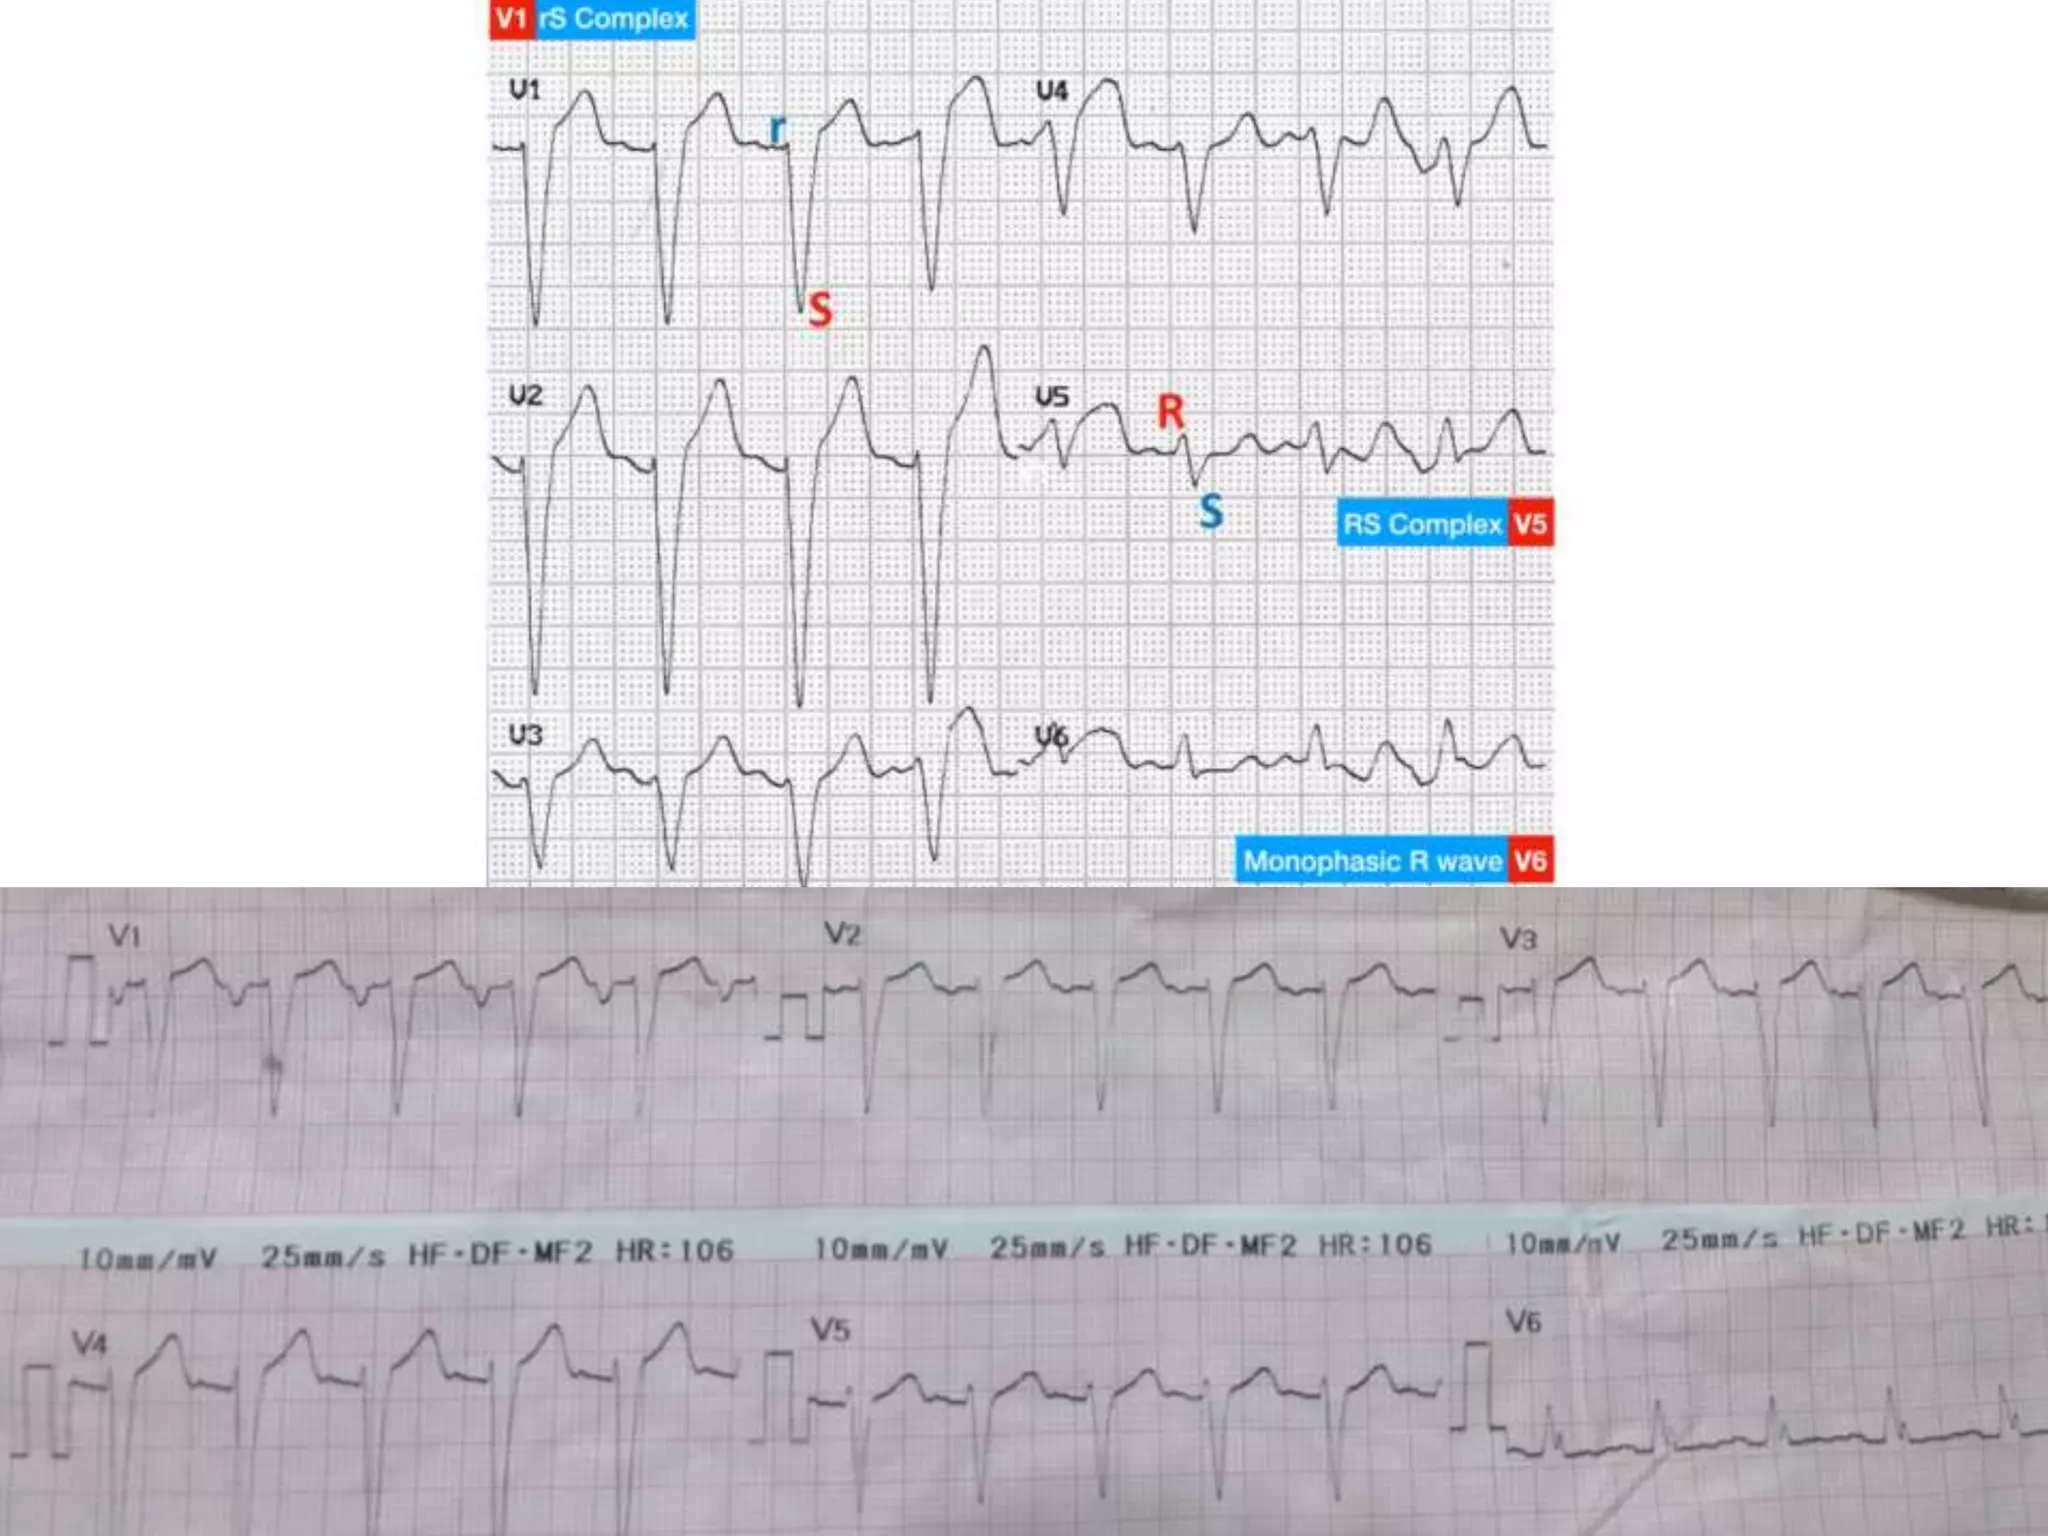
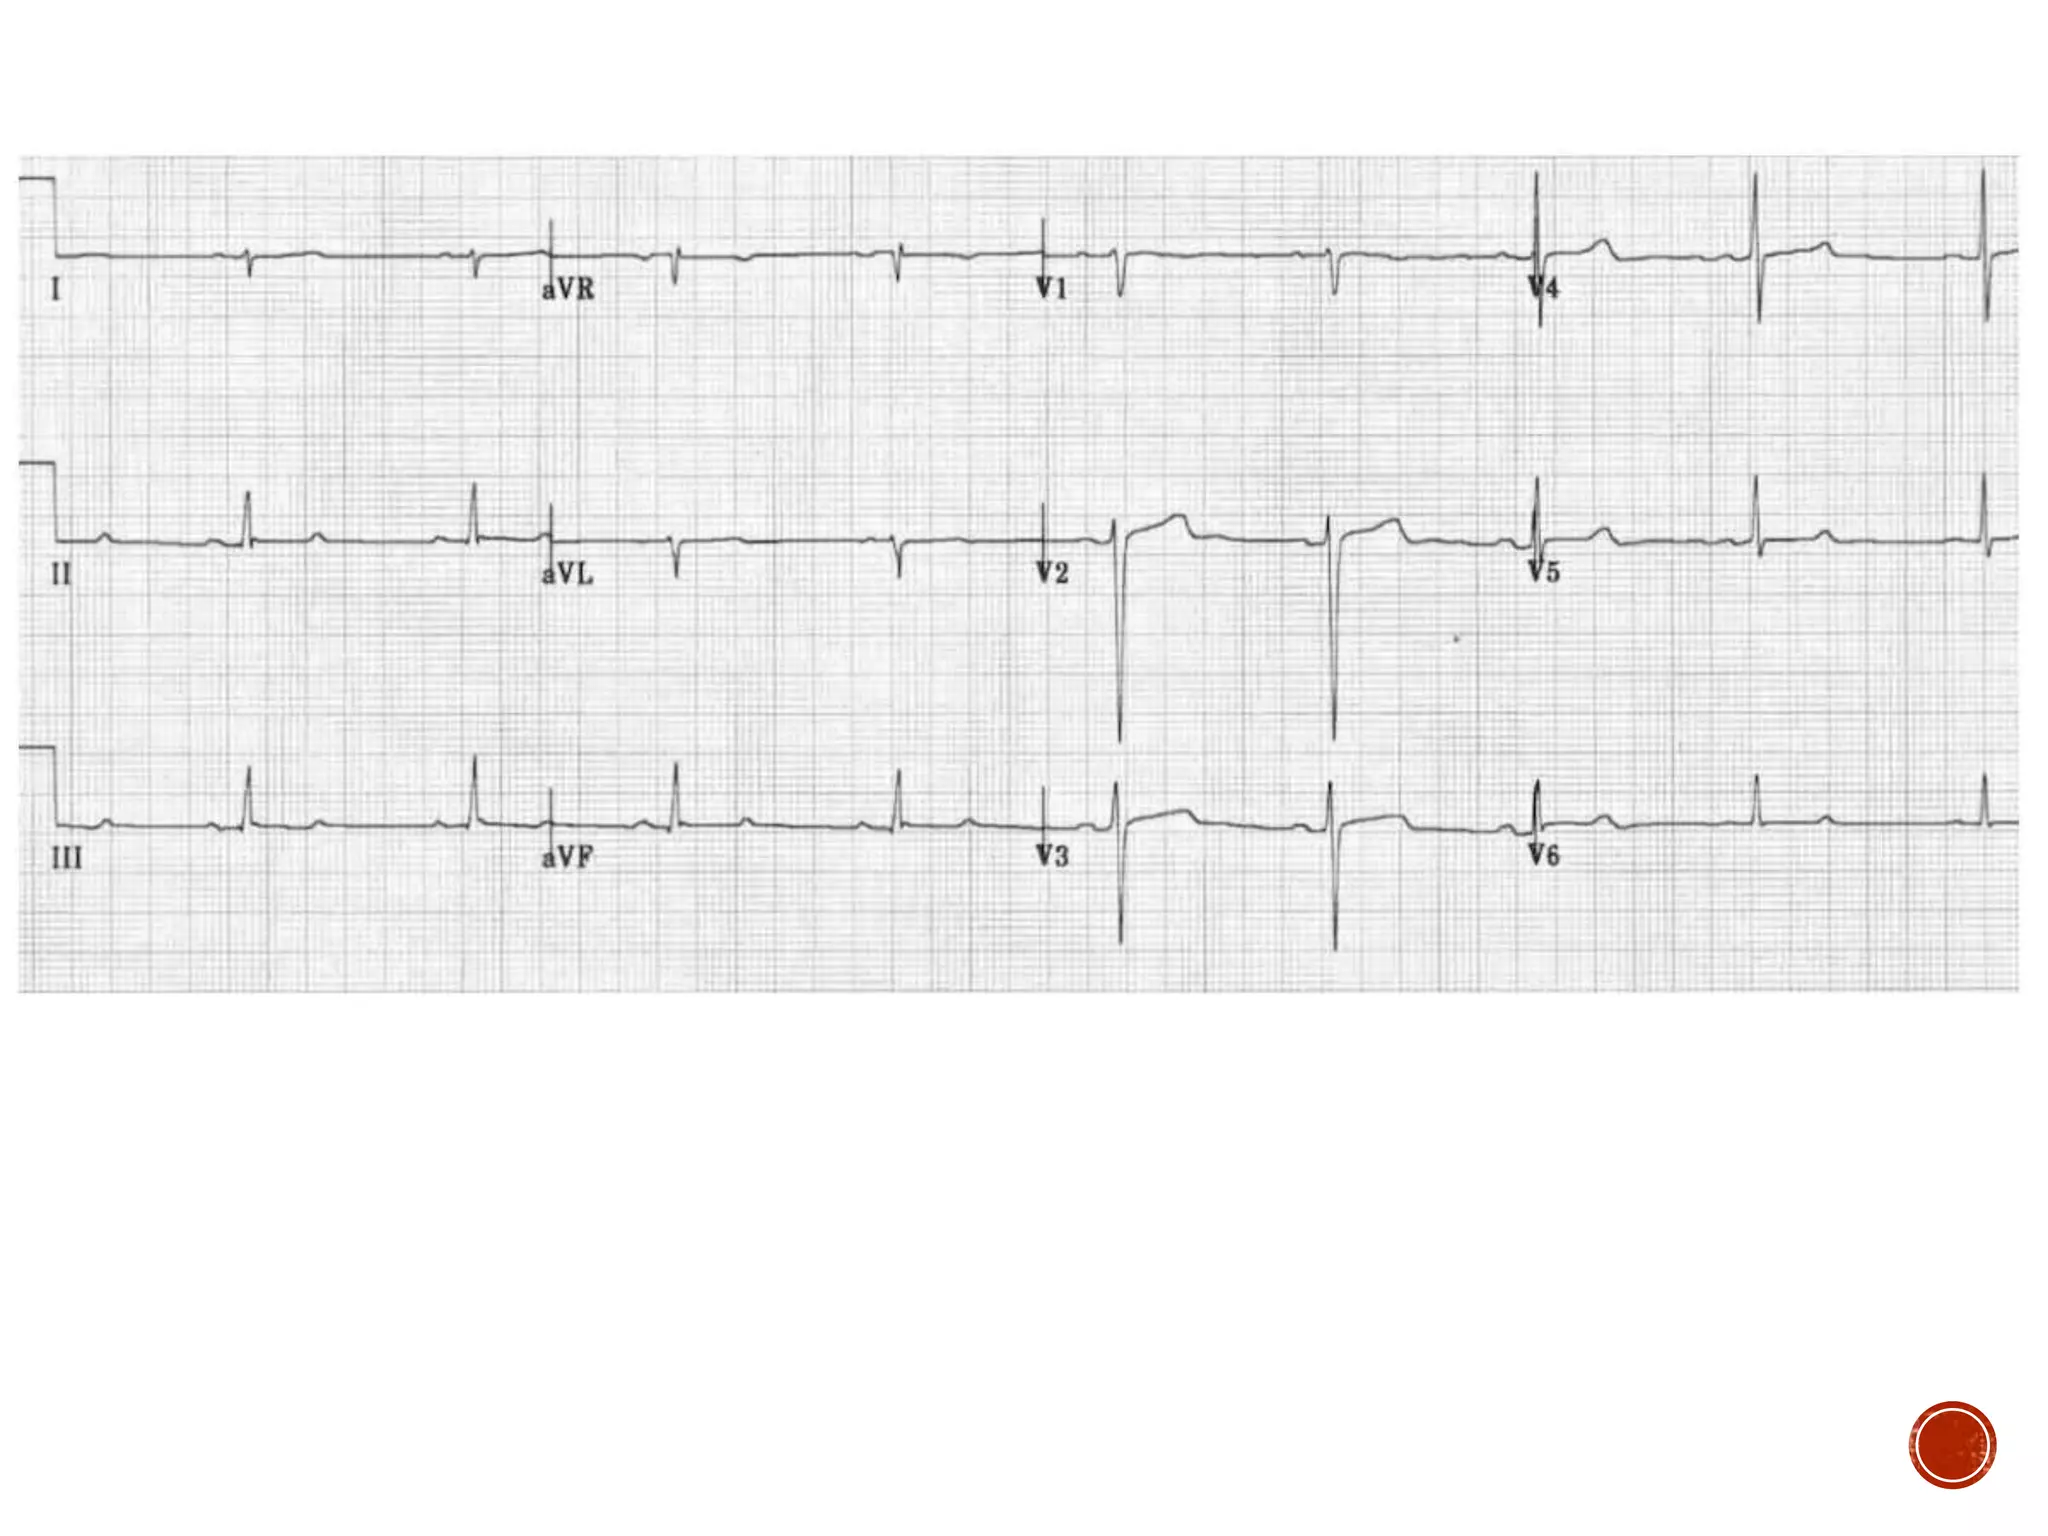
This document discusses right bundle branch block (RBBB). It defines RBBB and its diagnostic criteria. Potential causes of RBBB are listed, including pulmonary embolism and ischemic heart disease. The document notes that RBBB is generally not clinically significant in asymptomatic patients and has little impact on prognosis, though it can indicate issues in patients with symptoms like chest pain or dyspnea. Large studies have found no association between RBBB and increased mortality in otherwise healthy individuals.
1) The document defines wide complex tachycardia as a rhythm with a QRS duration ≥120ms and heart rate >100 bpm.
2) The main causes listed are ventricular tachycardia (80% of cases) and supraventricular tachycardia with aberrancy.
3) Key features that can help differentiate the underlying rhythm include QRS duration, axis, morphology, and the presence or absence of AV dissociation on electrocardiogram.
This document discusses localization of accessory pathways using electrocardiography. It describes that accessory pathways can be located in eight anatomical positions along the tricuspid and mitral valve annuli. Several algorithms are proposed to determine the location based on delta wave polarity and amplitude in various leads. The most accurate is the Arruda approach, which uses step-wise analysis of delta wave characteristics in leads I, II, aVL, aVF and V1 to identify the specific accessory pathway location with 90% sensitivity and 99% specificity. Characteristic ECG patterns are presented that help localize right anteroseptal, right posteroseptal, left lateral and right free wall accessory pathways.
1) Atrioventricular nodal reentrant tachycardia (AVNRT) is the most common type of supraventricular tachycardia. It involves a reentrant circuit utilizing the fast and slow pathways within the AV node.
2) There are typical and atypical forms of AVNRT depending on the direction of conduction through the fast and slow pathways. In typical AVNRT, antegrade conduction is down the slow pathway and retrograde up the fast pathway. In atypical AVNRT the directions are reversed.
3) Ablation of the slow pathway is an effective treatment for AVNRT and can be performed without damaging the AV node since only a portion of the circuit
1. AVNRT and AVRT are types of supraventricular tachycardia involving abnormal pathways for electrical conduction between the atria and ventricles.
2. AVNRT is caused by a reentry circuit within the AV node, while AVRT involves an accessory pathway bypassing the AV node.
3. There are different subtypes of AVNRT and AVRT depending on which pathways are involved in the antegrade and retrograde directions. Typical AVNRT involves a slow-fast pathway while typical AVRT involves orthodromic conduction over an accessory pathway.
This document discusses ECG patterns in congenital heart disease. It begins by outlining the significance of ECG in diagnosing congenital heart defects. It then provides an overview of normal ECG changes in children and how they evolve over time as hemodynamics change. Next, it describes how ECG can help identify situs and ventricular position. It then discusses the characteristic ECG patterns seen in common acyanotic defects like atrial septal defects and ventricular septal defects. It also covers cyanotic defects like transposition of the great arteries. The document provides detailed information on ECG features, associated conditions, complications and evolution over time for many different congenital heart defects.
This document provides an overview of the approach to evaluating and diagnosing wide complex tachycardias. It begins with definitions of terms like wide complex tachycardia, ventricular tachycardia, and supraventricular tachycardia. It then discusses the importance of making an accurate diagnosis to avoid inappropriate treatment. Various ECG criteria are presented to help distinguish ventricular from supraventricular rhythms based on features like AV dissociation, QRS morphology, axis, and precordial patterns. Specific criteria for right bundle branch block and left bundle branch block morphologies are also outlined. The document emphasizes taking a stepwise approach and considering clinical history in narrowing the differential diagnosis of wide complex tachycardias.
The document discusses various electrocardiogram (ECG) criteria for differentiating between ventricular tachycardia (VT) and supraventricular tachycardia (SVT) with aberrancy presenting with a wide QRS complex tachycardia. It outlines criteria from Sandler and Marriott (1965), Wellens (1978), Kindwall (1988), Brugada (1991), Vereckei (2008) and Pava (2010). Key criteria that favor VT include QRS duration >140ms, extreme left axis, AV dissociation, monophasic R wave in V1, R/S ratio <1 in V6, and notching of the S wave in V1.
The document discusses electrocardiogram (ECG) patterns associated with cardiac chamber enlargement, specifically right atrial enlargement (RAE) and left atrial enlargement (LAE). RAE is suggested by a tall, peaked P wave in leads II, III, AVF and a positive P wave in V1. LAE results in prolongation of the left atrial component of the P wave, increased posterior deviation of the left atrial vector, and left axis deviation of the P wave. The diagnostic accuracy of ECG findings for chamber enlargement is limited but can provide clues when correlated with imaging studies.
A 73-year-old male presented with dizziness for 1 year and chest pain for 2 days. His ECG showed left bundle branch block (LBBB) and first-degree atrioventricular block, consistent with possible trifascicular block. Trifascicular block must be confirmed with bundle of His electrogram. The patient has abnormal conduction through one or more divisions of the intraventricular conduction system distal to the bundle of His, presenting as LBBB and first-degree AV block. This suggests involvement of the left and right bundles as well as the AV node, consistent with trifascicular block.
Tachycardias are broadly categorized based upon the width of the QRS complex on the electrocardiogram (ECG). A narrow QRS complex (<120 milliseconds) reflects rapid activation of the ventricles via the normal His-Purkinje system, which in turn suggests that the arrhythmia originates above or within the His bundle (ie, a supraventricular tachycardia). The site of origin may be in the sinus node, the atria, the atrioventricular (AV) node, the His bundle, or some combination of these sites. A widened QRS (≥120 milliseconds) occurs when ventricular activation is abnormally slow. The most common reason that a QRS is widened is because the arrhythmia originates below the His bundle in the bundle branches, Purkinje fibers, or ventricular myocardium (eg, ventricular tachycardia). Alternatively, a supraventricular arrhythmia can produce a widened QRS if there are either pre-existing or rate-related abnormalities within the His-Purkinje system (eg, supraventricular tachycardia with aberrancy), or if conduction occurs over an accessory pathway. Thus, wide QRS complex tachycardias may be either supraventricular or ventricular in origin.
1) Transthoracic and transesophageal echocardiography are important modalities for assessing atrial septal defects (ASDs). TTE can identify RV volume overload and septal flattening, while TEE precisely measures defect size and evaluates rim morphology.
2) The four main types of ASDs - ostium secundum, ostium primum, sinus venosus, and coronary sinus defects - have distinguishing echo features. Doppler can demonstrate shunt direction and magnitude.
3) Echocardiography guides percutaneous ASD closure by assessing defect and rim anatomy, device sizing, and post-procedure result. Understanding echo features is key to ensuring procedure success.
A 45-year-old female presented with difficulty breathing, palpitations, and sweating for 4 hours. An ECG showed Wolff-Parkinson-White (WPW) syndrome, characterized by a short PR interval, delta wave, and widened QRS complex. WPW is a congenital condition involving an accessory pathway that allows supraventricular impulses to bypass the AV node and activate the ventricles early. Treatment options include antiarrhythmic drugs or radiofrequency ablation to destroy the accessory pathway.
This document discusses techniques for localizing the site of origin of ventricular tachycardia based on electrocardiogram characteristics. It describes that right ventricular outflow tract tachycardias typically present with left bundle branch block morphology while left ventricular sites may present with either right or left bundle branch block depending on exit site. Specific leads are discussed that can provide clues about anterior vs posterior, septal vs free wall origin within the outflow tracts. Other areas like fascicles, papillary muscles and mitral/tricuspid annuli are also summarized.
Ventricular tachycardia can occur in structurally normal hearts. It is classified based on origin, morphology, response to exercise and drugs. Non-life threatening VT is often monomorphic and originates from sites like outflow tracts and fascicles. Outflow tract VT commonly originates from the right ventricular outflow tract. Other sites include the left ventricular outflow tract and aortic cusps. Treatment includes medications, ablation, and implantable cardioverter-defibrillators for more severe cases. Life-threatening VT is often polymorphic and associated with genetic ion channel disorders like long QT syndrome.
A lecture on the echocardiographic evaluation of hypertrophic cardiomyopathy. Starts with an overview of the topic then a systematic approach to diagnosis and then a differential diagnosis followed by take-home messages and conclusion.
This document discusses the echocardiographic assessment of atrial septal defects (ASDs). It describes the main types of ASDs and notes that 80% are secundum defects. Echocardiography is used to identify and characterize ASDs, detect associated anomalies, diagnose complications, and guide treatment. Transthoracic echocardiography is the initial study, while transesophageal echocardiography provides better views of the atrial septum. Key measurements include ASD size, location, rim dimensions, and quantifying shunt severity with Qp/Qs. Echocardiography guides decisions about ASD device closure or surgery.
This document discusses left ventricular hypertrophy (LVH) and right ventricular hypertrophy (RVH). It defines LVH as an increase in left ventricle mass due to increased wall thickness or cavity size. There are two types of LVH - systolic overload from conditions like hypertension which compromise the left ventricle during systole, and diastolic overload from things like valvular diseases which compromise it during diastole. The document outlines ECG criteria for diagnosing LVH including Sokolov-Lyon and Cornell voltage criteria. It also discusses RVH manifestations on ECG like right axis deviation, tall R waves in right precordial leads, and an S1S2S3 pattern.
Echo assessment of lv systolic function and swmaFuad Farooq
This document discusses various techniques for assessing left ventricular systolic function using echocardiography, including:
- Visual assessment of endocardial motion and wall thickening to evaluate global and regional function
- Quantitative measures like fractional shortening, ejection fraction, and volumes
- Tissue Doppler imaging of mitral annular velocities
- Tissue tracking and strain imaging to evaluate timing and extent of myocardial contraction
- Wall motion scoring to characterize regional abnormalities
This document summarizes the echocardiographic assessment of mitral stenosis (MS). It describes the anatomy of the mitral valve and causes of MS. Methods for assessing MS severity include measuring the pressure gradient, mitral valve area using planimetry and pressure half-time, and pulmonary artery pressure. Suitability for percutaneous transvenous mitral commissurotomy is evaluated. Concomitant valve lesions are also identified. Stress echocardiography may be used when symptoms are equivocal. Transesophageal echocardiography is recommended in some cases.
ECHOCARDIOGRAPHIC EVALUATION OF MITRAL VALVE DISEASEPraveen Nagula
MITRAL VALVE ANATOMY , M MODE FINDINGS IN MITRAL STENOSIS,EVALUATION OF THE SEVERITY OF LESION,CALCIFIC MS,CCMA,CONGENITAL LESIONS,GUIDELINES ALL IN DETAIL....
This document discusses coarctation of the aorta, including its embryology, nomenclature, pathophysiology, natural history, and clinical features. Some key points include:
- Coarctation of the aorta is a congenital narrowing of the aorta near the ductus arteriosus. Left untreated, 50% of patients will die within 10 years primarily due to heart failure.
- Associated anomalies include ventricular septal defects (40% of cases) and bicuspid aortic valves (46% of cases).
- Long-term complications include hypertension, aneurysm formation, dissection, and rupture.
- Natural history studies show mortality rates increase significantly from 25% at age
1) Atrial septal defects are one of the most common types of pre-tricuspid shunts and can often remain asymptomatic until later in life when they may lead to heart failure, pulmonary hypertension, or arrhythmias if left unrepaired.
2) The natural history and prognosis of atrial septal defects depends on factors like the size of the defect and age at diagnosis, with smaller defects having higher rates of spontaneous closure and repair at a younger age leading to better outcomes.
3) Device or surgical closure of atrial septal defects can successfully close the defect and improve symptoms, but the best outcomes are seen in those with less elevated pulmonary pressures and cardiac chamber enlargement prior to repair
Echocardiographic evaluation of Aortic stenosisAswin Rm
This document discusses the echocardiographic evaluation of aortic stenosis. It describes assessing the anatomy and severity of AS through 2D and Doppler imaging. Key measurements include peak jet velocity, mean transvalvular pressure gradient, and aortic valve area calculated by the continuity equation. Grading of severity is based on an integrative approach using these Doppler and anatomical measurements. Causes, appearances, and complications of various types of AS are also reviewed.
This document provides a history of the electrocardiogram (EKG/ECG) and describes how it is used to evaluate cardiac electrical activity and identify various cardiac conditions. Some key points:
- The EKG was developed in the late 19th/early 20th century, with scientists like Matteucci, Marey, and Einthoven contributing to its invention and clinical use.
- An EKG records the heart's electrical activity through electrodes on the skin and can be used to detect arrhythmias, ischemia, infarction, and other conditions.
- It analyzes the P wave, QRS complex, ST segment, and T wave to evaluate conduction and identify abnormalities.
This document discusses ECG findings in various congenital heart diseases:
1) Acyanotic CHDs like atrial septal defect (ASD) show findings of right or left ventricular hypertrophy depending on shunt direction, while ventricular septal defect (VSD) shows signs of left or bi-ventricular overload.
2) Cyanotic CHDs like transposition of the great arteries (TGA) show right axis deviation and ventricular hypertrophy initially, evolving to match pulmonary blood flow. Tricuspid atresia typically shows left axis deviation and ventricular hypertrophy.
3) Algorithms are provided to systematically analyze ECG patterns and identify the underlying CHD based on chamber
This document provides an overview of evaluating and treating different types of tachycardia, including:
1) It discusses evaluating the patient's hemodynamic stability, history, and ECG to determine the characteristics and cause of the tachycardia.
2) It describes differentiating between narrow and wide complex tachycardias, and the differential diagnoses for each, including sinus tachycardia, atrial fibrillation, AV nodal reentrant tachycardia, and ventricular tachycardia.
3) It provides guidance on therapies for different tachycardias, such as electrical or chemical cardioversion, rate control, and ablation. The importance of correctly diagnosing wide complex tachycard
Wide QRS tachycardia requires differentiating between ventricular tachycardia (VT) and supraventricular tachycardia with aberrancy (SVT-A). The document discusses various algorithms and criteria for making this distinction using the electrocardiogram. These include Wellens' criteria, Brugada criteria, Vereckei's aVR algorithm, and analyzing features such as QRS morphology and the presence of atrioventricular dissociation. No single algorithm is perfect, so electrophysiological testing may be needed in some cases to make a definitive diagnosis and guide appropriate treatment.
The document discusses the conduction system of the heart and bundle branch blocks. It notes that a bundle branch block is diagnosed when the QRS duration is over 120ms, there is a dominant S wave in V1, and a broad monophasic R wave in lateral leads. It lists causes of left bundle branch block such as aortic stenosis, dilated cardiomyopathy, and myocardial infarction. It explains how left bundle branch block leads to reversed septal activation and prolonged conduction time to the left ventricle. The document also discusses right bundle branch block and potential causes like pulmonary embolism, ischemic heart disease, and cardiomyopathy.
The document discusses the conduction system of the heart and bundle branch blocks. It notes that a bundle branch block is diagnosed when the QRS duration is over 120ms, there is a dominant S wave in V1, and a broad R wave in lateral leads. It lists causes of bundle branch blocks as conditions like aortic stenosis, dilated cardiomyopathy, and hypertension. The document explains that in left bundle branch block, conduction delay means the left ventricle is activated later via the septum, producing tall R waves in lateral leads and deep S waves in precordial leads, with an extended QRS duration. It also discusses right bundle branch block and criteria for diagnosing a myocardial infarction in the setting of left bundle branch block
The document discusses electrocardiogram (ECG) findings associated with cardiac chamber enlargement. It notes that while ECG is not very sensitive, it can provide clues about underlying heart conditions. Enlargement of cardiac chambers on ECG is seen through changes in wave morphology, amplitude, axis, and duration. Specific criteria are discussed to identify left and right atrial abnormalities as well as left and right ventricular hypertrophy on ECG. Limitations of ECG criteria in the presence of conduction abnormalities are also reviewed.
An electrocardiogram (ECG or EKG) records the electrical signal from your heart to check for different heart conditions. Electrodes are placed on your chest to record your heart's electrical signals, which cause your heart to beat. The signals are shown as waves on an attached computer monitor or printer
This ECG shows signs of Wolff-Parkinson-White syndrome with a likely accessory right posteroseptal pathway. Key features include a frontal QRS axis around -30 degrees, frontal delta wave axis between -30 to -60 degrees, and dominant negative QRS deflection in lead V1 with isoelectric or negative delta wave. The patient presented with palpitations since childhood and exam was unremarkable other than tachycardia.
This document discusses ECG changes that occur due to cardiac chamber enlargement, including left atrial, right atrial, biatrial, left ventricular, right ventricular, and biventricular abnormalities. For each type of chamber enlargement, the document outlines the mechanisms, diagnostic ECG criteria, and examples of ECG patterns. Key findings include prolonged P waves and biphasic P waves in leads indicating left and right atrial enlargement, increased QRS voltages and ST-T wave changes indicating left ventricular pressure overload, and tall R waves in right-sided leads indicating right ventricular hypertrophy. The document provides a detailed reference for understanding ECG manifestations of different cardiac structural abnormalities.
The ECG shows right bundle branch block (RBBB) and left anterior fascicular block (LAFB) in a 60-year-old hypertensive man. RBBB is characterized by a wide QRS complex with a terminal R wave in lead V1 and slurred S wave in lead V6. LAFB presents with left axis deviation and rS waves in lead III. The combination of RBBB and LAFB on an ECG suggests ischemia, as LAFB is commonly seen in acute anterior wall myocardial infarctions supplied by the left anterior descending artery.
A 46-year-old male presented with sudden onset of chest pain radiating to the left arm and shortness of breath. He has risk factors of smoking but no other medical history. On examination, his vitals were stable and heart and lung sounds were normal. The document discusses the arterial supply of the heart and how electrocardiogram leads correspond to different areas of the heart muscle. It provides detailed descriptions of ST segment changes that would indicate occlusions or blocks in different coronary arteries and the regions of the heart affected.
The document discusses an ECG of a 75-year-old female patient presenting with chest pain. The initial ECG showed left bundle branch block (LBBB) and signs of an acute myocardial infarction (MI) in the left anterior descending artery. A repeat ECG after 24 hours showed signs of left ventricular hypertrophy and anterior and inferior wall ischemia. The document then discusses various criteria for diagnosing MI in patients presenting with LBBB, including the Sgarbossa criteria. It also describes different subtypes and variants of LBBB that can complicate the diagnosis of MI.
This document discusses bradyarrhythmias and approach to treatment. It defines various types of sinus node dysfunction and AV conduction blocks including sick sinus syndrome, sinus pause, sinus arrest, tachy-brady syndrome, and different degrees of AV block. It describes evaluation of sinus node function including intrinsic heart rate, sinus node recovery time and SA conduction time. It discusses reversible and irreversible causes of bradyarrhythmias and guidelines for pacemaker implantation for sinus node and AV node dysfunction. Treatment options including medications and permanent pacing are outlined.
This document discusses ECG findings in patients with pulmonary diseases such as chronic obstructive pulmonary disease (COPD) and pulmonary embolism (PE). It describes changes seen in COPD such as right axis deviation, low voltage complexes, and right ventricular hypertrophy. It also outlines typical findings in PE including sinus tachycardia, right ventricular strain pattern, complete or incomplete right bundle branch block, and S1Q3T3 pattern. The document provides details on diagnostic criteria for right atrial enlargement, right ventricular hypertrophy, and right bundle branch block.
This document provides information on ECG changes seen in ischemic heart disease. It discusses the blood supply of the heart and how different coronary artery occlusions can cause specific ECG changes. These include ST segment elevation or depression, T wave changes, and pathologic Q waves indicating injury, ischemia or necrosis in different heart regions. Examples are provided of ECG tracings demonstrating myocardial infarction patterns involving the inferior, lateral, anterior and posterior walls. It also discusses non-Q wave infarction and pseudoinfarction ECG patterns that can mimic myocardial injury. The effects of conditions like electrolyte abnormalities, drugs, and cardiac syndromes on the ECG are summarized.
This document provides an overview of ECG interpretation, including conduction pathways, a systematic method of interpretation, and common abnormalities seen in critical care. It discusses supraventricular and ventricular arrhythmias, bundle branch blocks, heart block, and life-threatening arrhythmias such as ventricular tachycardia, ventricular fibrillation, and asystole. It also covers the basics of 12-lead ECG interpretation including lead placement and axis.
The document discusses how ECG can be used to diagnose acute myocardial infarction (AMI) and locate the culprit artery. It provides details on:
1) Common ECG patterns seen in AMI including ST elevation, Q waves, T wave changes.
2) How ECG patterns can localize the infarct region and suggest the underlying coronary artery, such as ST elevation in certain leads indicating right coronary or left anterior descending artery.
3) Limitations of ECG including inability to detect all AMIs and accurately estimate infarct size due to individual variations in anatomy and collateral circulation. ECG is not optimal for posterior wall infarcts.
This document provides an overview of QRS complexes and abnormalities seen on electrocardiograms (ECGs). It defines the components of the QRS complex and discusses causes of low or high voltage QRS complexes. Specific conditions that can cause left or right ventricular hypertrophy are described. Various conduction abnormalities are also summarized, including right and left bundle branch blocks, fascicular blocks, and bifascicular blocks. Causes of wide QRS complexes like hyperkalemia and certain drugs are mentioned. The document aims to educate on interpreting and analyzing QRS complexes on ECGs.
The document provides an overview of electrocardiography (ECG) fundamentals. It defines what an ECG is and discusses the cardiac cycle and interpretation of different ECG components such as waves, intervals, complexes, and segments. Key points covered include the components of the ECG, abnormalities that can be identified from the ECG, cardiac electrical conduction pathways, lead placements, and common causes of ECG abnormalities.
1. The document discusses electrocardiographic (ECG) interpretation including determining cardiac rate and rhythm, identifying conduction disturbances, myocardial ischemia or infarction, and other abnormalities.
2. It provides details on properly placing ECG leads and determining the cardiac axis. Common rhythms, conduction blocks, hypertrophy, and other ECG findings are explained.
3. A mnemonic device, RRAHIM, is presented to guide the systematic interpretation of an ECG, covering rate, rhythm, axis, hypertrophy, ischemia/infarction, and other findings.
Similar to 8 ECG WORKSHOP BUNDLE BRANCH BLOCK & FASCICULAR BLOCK.pptx (20)
The document discusses the benefits of exercise for mental health. Regular physical activity can help reduce anxiety and depression and improve mood and cognitive function. Exercise causes chemical changes in the brain that may help protect against mental illness and improve symptoms.
The document outlines a presentation on hypertension and hypertensive disorders for allied health workers. It begins with an introduction and outline covering hypertension and hypertensive disorders of pregnancy. The outline discusses risk factors and diagnosis of hypertension, as well as management of hypertensive crisis. Guidelines for diagnosing and treating hypertension from sources like the 2020 Philippine CPG are also summarized.
Cerebrovascular disease is an umbrella term for any abnormality in the brain resulting from a vascular process such as vessel occlusion, altered blood flow, or vessel rupture. Stroke specifically refers to cerebrovascular disease caused by ischemia or hemorrhage. The presentation of stroke depends on the location and size of the brain lesion. Imaging such as CT scans are used to identify infarcts, bleeds, and other findings. Timely management of ischemic and hemorrhagic strokes involves prevention or treatment of secondary complications.
This document presents a case of a 52-year-old female with fluid and electrolyte imbalance. She was admitted for shortness of breath and found to have hyponatremia and pulmonary congestion secondary to heart failure. Laboratory results showed low sodium, high BUN, and abnormal electrolyte ratios. She was diagnosed with hypervolemic hyponatremia and treated with diuretics and fluid restriction, resulting in improved sodium levels over five days. The document then discusses key principles of fluid balance, electrolytes, hypovolemia, and their management.
This document summarizes diagnostic algorithms for ventricular tachycardia (VT), including the Brugada algorithm and Vereckei algorithm. The Brugada algorithm uses three steps - absence of RS complex, R-S interval over 100ms, and checking for AV dissociation. The Vereckei algorithm only uses lead aVR and analyzes initial R wave dominance, QRS width over 40ms, notching, and V initial/V terminal ratio. The document also discusses differentiating VT from supraventricular tachycardia with aberrancy based on morphology, duration, and symptoms.
This document provides an outline for a physical examination focused on cardiovascular health. It begins with an introduction on cardiac anatomy, sounds, and conduction. The physical examination section describes inspecting, palpating, and auscultating the skin, head, neck, chest, abdomen, and extremities. Vital signs and common findings are also reviewed, including assessing jugular venous distention and lymph nodes in the neck. Key cardiac sounds and murmurs are defined. References include textbooks on internal medicine, physical examination, and cardiology.
Cestodes, or tapeworms, are flat segmented parasitic worms that infect the intestines of humans and other animals. They range in size from a few millimeters to several meters in length. The body consists of a head (scolex) and chain of segments (proglottids) that contain reproductive organs. Two major orders that infect humans are Pseudophyllidea and Cyclophyllidea. Pseudophyllidea have slit-like grooves instead of suckers, while Cyclophyllidea have cup-like suckers. Common tapeworms infecting humans include Diphyllobothrium latum (fish tapeworm), Taenia saginata (beef tapeworm), Taenia sol
1. Medical arthropods can directly or indirectly harm humans. Direct harms include injury from bites or acting as parasites while indirect harms include transmitting pathogens.
2. Five classes of arthropods are medically important - Insecta, Arachnida, Chilopoda, Diplopoda, and Crustacea. Within Arachnida, ticks and mites can transmit diseases.
3. Control of medical arthropods involves integrated approaches like environmental management, chemical, biological and genetic methods. Personal protection is also important.
Trematodes are flatworm parasites that are dorsoventrally flattened and unsegmented. They have two suckers and incomplete digestive tracts. Blood flukes include schistosomes which have complex multi-host life cycles involving snail and human hosts. The three main types that infect humans are Schistosoma japonicum, S. mansoni, and S. haematobium. Lung flukes include Paragonimus westermani which uses crabs as an intermediate host. Intestinal flukes include Fasciolopsis buski, a large fluke found in the intestines, and Echinostoma ilocanum, known as Garrison's fluke, which
This document summarizes several medically important protozoans that infect the Philippines, including their lifecycles and modes of transmission. It describes the trophozoite and cyst stages of Naegleria fowleri and Acanthamoeba, and notes they can infect through broken skin or nasal passages. Balantidium coli, Giardia lamblia, and Trichomonas vaginalis are described as having cyst infective stages transmitted through fecal-oral routes. Cryptosporidium parvum and Cyclospora cayetanensis are sporozoan parasites transmitted through contaminated food or water via oocysts. Toxoplasma gondii can infect
1) The document summarizes key information about medically important trematodes found in the Philippines, including their life cycles, intermediate and definitive hosts, diagnostic stages, and symptoms caused in humans.
2) It provides a table outlining 14 trematode species, their first and second intermediate hosts, definitive host, and diagnostic stage. A second table provides details on the ova, adult worms, pathogenesis, and drug of choice for each species.
3) The document concludes with a table comparing characteristics of the three major Schistosoma species affecting humans such as testes morphology, ovary features, intestine length, egg properties, intermediate host, and definitive host.
The respiratory system uses two types of respiration - internal and external. External respiration involves the exchange of gases between the external environment and cellular respiration, occurring through bulk transport via breathing and gas exchange in the lungs and blood circulated by the heart. Organisms use different respiratory structures depending on whether they reside in water or air, such as gills for fish and lungs for air-breathing organisms.
The mammalian circulatory system consists of a four-chambered heart that pumps blood through the body. The heart has four valves that ensure blood flows in one direction. It pumps deoxygenated blood to the lungs and oxygenated blood to the body in a continuous closed circuit. The cardiac cycle involves repeated ventricular contraction and relaxation. Contraction is driven by electrical signals that cause the muscles to depolarize and repolarize. This pumps blood out of the heart and allows it to refill between beats.
The document discusses various types of carboxylic acids including monocarboxylic acids containing one carboxyl group, dicarboxylic acids containing two carboxyl groups, and tricarboxylic acids containing three carboxyl groups. Examples are provided for each type. The document also discusses several saturated fatty acids found in nature including lauric acid, myristic acid, palmitic acid, stearic acid, oleic acid, and linoleic acid. Their chemical formulas, structures, sources, and uses are described.
The document summarizes lipid metabolism and fat oxidation. Lipids are broken down into fatty acids and glycerol during digestion. These products are absorbed and transported to the liver via the lymphatic and circulatory systems. In the liver, fatty acids can be used to form phospholipids or stored as fat. Fatty acids undergo beta-oxidation in the cell to produce acetyl-CoA for the Krebs cycle and ATP generation through oxidative phosphorylation. Oxidation of fatty acids yields more energy than carbohydrates.
Lipids are a broad group of organic compounds that includes fats, waxes, sterols, fat-soluble vitamins, and others. They are insoluble in water but soluble in nonpolar solvents and contain carbon, hydrogen, oxygen, and sometimes nitrogen or phosphorus. Lipids serve as a food source and include fatty acids, triglycerides, phospholipids, and other compounds important to plant and animal metabolism. Fatty acids are the main constituents of lipids and can be saturated or unsaturated, affecting their melting points.
Muktapishti is a traditional Ayurvedic preparation made from Shoditha Mukta (Purified Pearl), is believed to help regulate thyroid function and reduce symptoms of hyperthyroidism due to its cooling and balancing properties. Clinical evidence on its efficacy remains limited, necessitating further research to validate its therapeutic benefits.
Integrating Ayurveda into Parkinson’s Management: A Holistic ApproachAyurveda ForAll
Explore the benefits of combining Ayurveda with conventional Parkinson's treatments. Learn how a holistic approach can manage symptoms, enhance well-being, and balance body energies. Discover the steps to safely integrate Ayurvedic practices into your Parkinson’s care plan, including expert guidance on diet, herbal remedies, and lifestyle modifications.
Adhd Medication Shortage Uk - trinexpharmacy.comreignlana06
The UK is currently facing a Adhd Medication Shortage Uk, which has left many patients and their families grappling with uncertainty and frustration. ADHD, or Attention Deficit Hyperactivity Disorder, is a chronic condition that requires consistent medication to manage effectively. This shortage has highlighted the critical role these medications play in the daily lives of those affected by ADHD. Contact : +1 (747) 209 – 3649 E-mail : sales@trinexpharmacy.com
- Video recording of this lecture in English language: https://youtu.be/kqbnxVAZs-0
- Video recording of this lecture in Arabic language: https://youtu.be/SINlygW1Mpc
- Link to download the book free: https://nephrotube.blogspot.com/p/nephrotube-nephrology-books.html
- Link to NephroTube website: www.NephroTube.com
- Link to NephroTube social media accounts: https://nephrotube.blogspot.com/p/join-nephrotube-on-social-media.html
ABDOMINAL TRAUMA in pediatrics part one.drhasanrajab
Abdominal trauma in pediatrics refers to injuries or damage to the abdominal organs in children. It can occur due to various causes such as falls, motor vehicle accidents, sports-related injuries, and physical abuse. Children are more vulnerable to abdominal trauma due to their unique anatomical and physiological characteristics. Signs and symptoms include abdominal pain, tenderness, distension, vomiting, and signs of shock. Diagnosis involves physical examination, imaging studies, and laboratory tests. Management depends on the severity and may involve conservative treatment or surgical intervention. Prevention is crucial in reducing the incidence of abdominal trauma in children.
NVBDCP.pptx Nation vector borne disease control programSapna Thakur
NVBDCP was launched in 2003-2004 . Vector-Borne Disease: Disease that results from an infection transmitted to humans and other animals by blood-feeding arthropods, such as mosquitoes, ticks, and fleas. Examples of vector-borne diseases include Dengue fever, West Nile Virus, Lyme disease, and malaria.
Local Advanced Lung Cancer: Artificial Intelligence, Synergetics, Complex Sys...Oleg Kshivets
Overall life span (LS) was 1671.7±1721.6 days and cumulative 5YS reached 62.4%, 10 years – 50.4%, 20 years – 44.6%. 94 LCP lived more than 5 years without cancer (LS=2958.6±1723.6 days), 22 – more than 10 years (LS=5571±1841.8 days). 67 LCP died because of LC (LS=471.9±344 days). AT significantly improved 5YS (68% vs. 53.7%) (P=0.028 by log-rank test). Cox modeling displayed that 5YS of LCP significantly depended on: N0-N12, T3-4, blood cell circuit, cell ratio factors (ratio between cancer cells-CC and blood cells subpopulations), LC cell dynamics, recalcification time, heparin tolerance, prothrombin index, protein, AT, procedure type (P=0.000-0.031). Neural networks, genetic algorithm selection and bootstrap simulation revealed relationships between 5YS and N0-12 (rank=1), thrombocytes/CC (rank=2), segmented neutrophils/CC (3), eosinophils/CC (4), erythrocytes/CC (5), healthy cells/CC (6), lymphocytes/CC (7), stick neutrophils/CC (8), leucocytes/CC (9), monocytes/CC (10). Correct prediction of 5YS was 100% by neural networks computing (error=0.000; area under ROC curve=1.0).
14. Delayed RV activation -
secondary R wave (R’) in
the right precordial leads
(V1-3)
Wide, slurred S wave in
the lateral leads.
Delayed activation of the
RV ST depression and
T wave inversion in the
right precordial leads.
15. DIAGNOSTIC CRITERIA OF
RBBB
Broad QRS > 120 ms
RSR’ pattern in V1-3 (‘M-shaped’ QRS complex)
Wide, slurred S wave in the lateral leads (I,
aVL, V5-6)
16.
17. • Right ventricular hypertrophy / cor
pulmonale
• Pulmonary embolus
• Ischemic heart disease
• Rheumatic heart disease
• Myocarditis or cardiomyopathy
• Degenerative disease of the conduction
system
• Congenital heart disease (e.g. atrial
septal defect)
18. CLINICAL SIGNIFICANCE
OF RBBB
RBBB in asymptomatic – NOT correlated
with adverse outcomes.
New RBBB in patients with chest pain - may
indicate occlusion in the left anterior
descending artery.
New RBBB in patients experiencing dyspnea
(particularly if acute) - may indicate
pulmonary embolism.
In the vast majority of cases, however, RBBB
is a benign finding with little if any impact of
cardiovascular prognosis.
19. A large prospective cohort study
evaluated the association between
RBBB and mortality over a period of
20 years in otherwise healthy
individuals; NO ASSOCIATION was
found.
CLINICAL SIGNIFICANCE
OF RBBB
26. R to L overall depolarization
tall R waves in the lateral
leads (I, V5-6)
deep S waves in the right
precordial leads (V1-3)
LAD
The ventricles are activated
sequentially (right, then left)
rather than simultaneously
a broad or notched (‘M’-shaped)
R wave in the lateral leads.
27. QRS duration of > 120 ms
Dominant S wave in V1
Broad monophasic R wave in lateral leads (I, aVL, V5-V6)
Absence of Q waves in lateral leads (I, V5-V6; small Q waves are still
allowed in aVL)
Prolonged R wave peak time > 60ms in left precordial leads (V5-6)
28.
29. Appropriate discordance: the ST
segments and T waves always go in the
opposite direction to the main vector of
the QRS complex
Poor R wave progression in the chest
leads
Left axis deviation
30.
31.
32. Aortic stenosis
Ischaemic heart disease
Hypertension
Dilated cardiomyopathy
Anterior MI
Primary degenerative disease (fibrosis) of
the conducting system (Lenegre disease)
Hyperkalaemia
Digoxin toxicity
33. 1. Asymptomatic patients, LBBB appears to
have minimal effect on outcomes in younger,
apparently healthy subjects,
LBBB in older individuals has been
associated with an increase in
mortality
2. LBBB is an independent predictor of all-
cause mortality in patients with known or
suspected coronary heart disease
34. 3. The presence of LBBB is associated with
higher short-term and long-term mortality
following a myocardial infarction
4. LBBB is an independent risk factor for
mortality in patients with heart failure and is
associated with increased all-cause mortality
and sudden death at one year
5. For asymptomatic patients with an isolated
LBBB and no other evidence of cardiac
disease, no specific therapy is
required.
SA node – internodal pathways – AV node – bundle of His – bundle branches – Purkinje fibers
SA node – pacemaker (has the fastest intrinsic autonomic foci)
Intrinsic rates
Parts of the heart depolarized corresponding to the ECG
3 ECGs
. the excitation starts in the sinus node consisting of special pacemaker cells.the electrical impulses spread over the rightand left atria. 2. the aV node is normally the only electrical connection between he atria and the ventricles.the impulses slow down as theytravel through the aV node to reach the bundle of his.3. the bundle of his, the distal part of the aV junction, conductsthe impulses rapidly to the bundle branches.4. the fast conducting right and left bundle branches subdivideinto smaller and smaller branches, the smallest ones connecting to the purkinje fibers.5. the purkinje fibers spread out all over the ventricles beneaththe endocardium and they bring the electrical impulses veryfast to the myocardial cells.all in all it takes the electrical impulses less than 200 ms to travelfrom the sinus node to the myocardial cells in the ventricles
. the excitation starts in the sinus node consisting of specialpacemaker cells.the electrical impulses spread over the rightand left atria.2. the aV node is normally the only electrical connection betweenthe atria and the ventricles.the impulses slow down as theytravel through the aV node to reach the bundle of his.3. the bundle of his, the distal part of the aV junction, conductsthe impulses rapidly to the bundle branches.4. the fast conducting right and left bundle branches subdivideinto smaller and smaller branches, the smallest ones connecting to the purkinje fibers.5. the purkinje fibers spread out all over the ventricles beneaththe endocardium and they bring the electrical impulses veryfast to the myocardial cells.all in all it takes the electrical impulses less than 200 ms to travelfrom the sinus node to the myocardial cells in the ventricles
• In RBBB, activation of the right ventricle is delayed as depolarisation has to spread across theseptum from the left ventricle.• The left ventricle is activated normally, meaning that the early part of the QRS complex isunchanged.• The delayed right ventricular activation produces a secondary R wave (R’) in the right precordialleads (V1-3) and a wide, slurred S wave in the lateral leads.• Delayed activation of the right ventricle also gives rise to secondary repolarization abnormalities,with ST depression and T wave inversion in the right precordial leads.• In isolated RBBB the cardiac axis is unchanged, as left ventricular activation proceeds normallyvia the left bundle branch
• In RBBB, activation of the right ventricle is delayed as depolarisation has to spread across theseptum from the left ventricle.• The left ventricle is activated normally, meaning that the early part of the QRS complex isunchanged.• The delayed right ventricular activation produces a secondary R wave (R’) in the right precordialleads (V1-3) and a wide, slurred S wave in the lateral leads.• Delayed activation of the right ventricle also gives rise to secondary repolarization abnormalities,with ST depression and T wave inversion in the right precordial leads.• In isolated RBBB the cardiac axis is unchanged, as left ventricular activation proceeds normally via the left bundle branch
• In RBBB, activation of the right ventricle is delayed as depolarisation has to spread across theseptum from the left ventricle.• The left ventricle is activated normally, meaning that the early part of the QRS complex isunchanged.• The delayed right ventricular activation produces a secondary R wave (R’) in the right precordialleads (V1-3) and a wide, slurred S wave in the lateral leads.• Delayed activation of the right ventricle also gives rise to secondary repolarization abnormalities,with ST depression and T wave inversion in the right precordial leads.• In isolated RBBB the cardiac axis is unchanged, as left ventricular activation proceeds normallyvia the left bundle branch
The delayed right ventricular activation produces a secondary R wave (R’) in the right precordial leads (V1-3) and a wide, slurred S wave in the lateral leads.
Delayed activation of the right ventricle also gives rise to secondary repolarization abnormalities, with ST depression and T wave inversion in the right precordial leads.
Associated Features
ST depression and T wave inversion in the right precordial leads (V1-3)
RBBB is asymptomatic individuals is not correlated with adverse outcomes. On the other hand, new RBBB in patients with chest pain may indicate occlusion in the left anterior descending artery.
Finally, new RBBB in patients experiencing dyspnea (particularly if acute) may indicate pulmonary embolism.
In the vast majority of cases, however, RBBB is a benign finding with little if any impact of cardiovascular prognosis.
A large prospective cohort study evaluated the association between RBBB and mortality over a period of 20 years in otherwise healthy individuals; no association was found.
. the excitation starts in the sinus node consisting of specialpacemaker cells.the electrical impulses spread over the rightand left atria.2. the aV node is normally the only electrical connection betweenthe atria and the ventricles.the impulses slow down as theytravel through the aV node to reach the bundle of his.3. the bundle of his, the distal part of the aV junction, conductsthe impulses rapidly to the bundle branches.4. the fast conducting right and left bundle branches subdivideinto smaller and smaller branches, the smallest ones connecting to the purkinje fibers.5. the purkinje fibers spread out all over the ventricles beneaththe endocardium and they bring the electrical impulses veryfast to the myocardial cells.all in all it takes the electrical impulses less than 200 ms to travelfrom the sinus node to the myocardial cells in the ventricles
Normally the septum is activated from left to right, producing small Q waves in the lateral leads.
In LBBB, the normal direction of septal depolarisation is reversed (becomes right to left), as the impulse spreads first to the RV via the right bundle branch and then to the LV via the septum.
This sequence of activation extends the QRS duration to > 120 ms and eliminates the normal septal Q waves in the lateral leads.
The overall direction of depolarisation (from right to left) produces tall R waves in the lateral leads (I, V5-6) and deep S waves in the right precordial leads (V1-3), and usually leads to left axis deviation.
As the ventricles are activated sequentially (right, then left) rather than simultaneously, this produces a broad or notched (‘M’-shaped) R wave in the lateral leads.
QRS Morphology in the Lateral Leads
The R wave in the lateral leads may be either:
‘M‘-shaped
Notched
Monophasic
RS complex
QRS Morphology in V1
The QRS complex in V1 may be either:
rS complex (small R wave, deep S wave)
QS complex (deep Q/S wave with no preceding R wave)
V1: rS complex (tiny R wave, deep S wave) and appropriate discordance (ST elevation and upright T wave)
V5: RS complex
V6: Monophasic R wave
The prognosis in patients with LBBB is related largely to the type and severity of any concurrent underlying heart disease and to the possible presence of other conduction disturbances
1. Among asymptomatic patients, LBBB appears to have minimal effect on outcomes in younger, apparently healthy subjects, while LBBB in older individuals has been associated with an increase in mortality
2. LBBB is an independent predictor of all-cause mortality in patients with known or suspected coronary heart disease
3. The presence of LBBB is associated with higher short-term and long-term mortality following a myocardial infarction
4. LBBB is an independent risk factor for mortality in patients with heart failure and is associated with increased all-cause mortality and sudden death at one year
5. For asymptomatic patients with an isolated LBBB and no other evidence of cardiac disease, no specific therapy is required.
3 ECGs
This is a schematic cross section of the left ventricle. The classic sort axis view.
Position of left ant and posterior fascicles. Normally the depolarization spreads circumferentially both on the same time such as the net depolarization vector is partially cancelled.
In LAFB, the myocardium is solely depolarized by the inferoseptal or inferomedial direction, resulting to a left axis deviation.
In LPFB, which is much less common, the ventriocular myocardium is solely depolarized from an anterolateral direction which results in a right axis deviation.
The left anterior fascicle crosses the LV outflow tract and terminates in the Purkinje system of theanterolateral wall of the LV. In “Left Anterior Hemiblock” (LAH), which is also known as “LeftAnterior Fascicular Block” (LAFB), the impulse spreads first through the left posterior fascicle,causing a delay in activation of the anterior and lateral walls of the LV which are normally activatedvia the left anterior fascicle. The main vector moves superiorly and anticlockwise. Thus, the peakof the terminal R wave in aVR occurs later than the peak of the R wave in aVL
In LAH the inferior LV is activated first, giving rise to septal q waves in leads I and aVL and smallinitial r waves in leads II, III, and aVF. The R wave in I and aVL may be tall. The delayed andunopposed activation of the rest of the LV produces a shift in the QRS axis leftward and superiorly,causing a marked left axis deviation. ///This process takes about 20 ms longer than simultaneousactivation by the 2 fascicles on the left side. This results in a QRS duration which is either normal orslightly prolonged but < 0.12 s.
The left posterior fascicle courses along the inflow tract of the LV a site less turbulent than the site ofthe left anterior fascicle. “Left Posterior Hemiblock” (LPH) is rare as an isolated abnormality and itusually occurs together with right bundle branch block. The ECG manifestations of LPH areopposite to those of LAH. The cardiac impulse emerges from the unblocked left anterior fascicleand spreads superiorly and leftward. This causes small q waves in leads II, aVF and III, and small rwaves in I and aVL. The major wave of depolarization then spreads in an inferior and rightwarddirection (in areas normally activated by the left posterior fascicle) generating tall R waves in theinferior leads and large negative voltages (deep S waves) in the lateral leads I and aVL. This leadsto the characteristic rightward axis of +90° to +180°. As with LAH the QRS complex may be normalin duration or increased by < 20 ms. The precordial leads do not contain any diagnostic data.
Left Posterior Fascicular Block (LPFB)
In left posterior fascicular block (previously left posterior hemiblock), impulses are conducted to the left ventricle via the left anterior fascicle, which inserts into the upper, lateral wall of the left ventricle along its endocardial surface.
On reaching the ventricle, the initial electrical vector is therefore directed upwards and leftwards (as excitation spreads outwards from endocardium to epicardium), causing small R waves in the lateral leads (I and aVL) and small Q waves in the inferior leads (II, III and aVF).
The major wave of depolarisation then spreads along the free LV wall in a downward and rightward direction, producing large positive voltages (tall R waves) in the inferior leads and large negative voltages (deep S waves) in the lateral leads.
This process takes up to 20 milliseconds longer than simultaneous conduction via both fascicles, resulting in a slight widening of the QRS.
The impulse reaches the inferior leads later than normal, resulting in a increased R wave peak time (= the time from onset of the QRS to the peak of the R wave) in aVF.