Downloaded 29 times


![ Rule of 300
300/[number of large boxes between two R waves].
only works for regular rhythms !!
300/7.5 large boxes = rate 40
Six second methods
Count the number of R-R intervals in six seconds and multiply by
10
Useful for irregular rhythm average rate
There are 8 R-R intervals
within 30 boxes. Multiply 8 x
10 = Rate 80](https://image.slidesharecdn.com/overviewecg-120723031037-phpapp02/85/Overview-ecg-28-320.jpg)

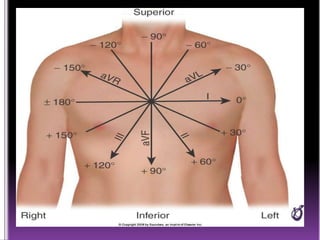
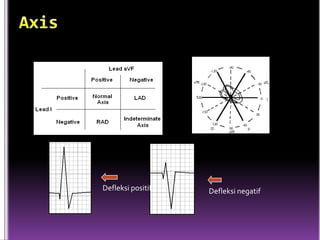
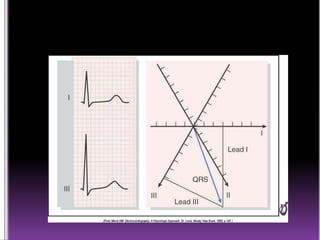
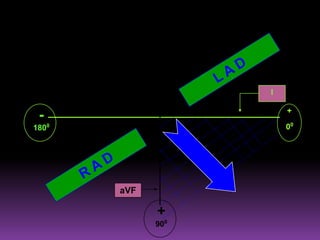
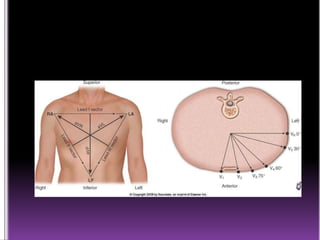
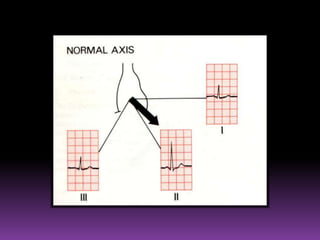
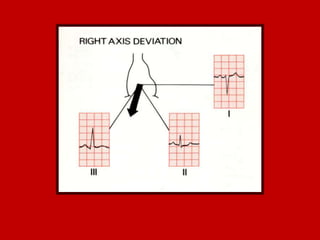
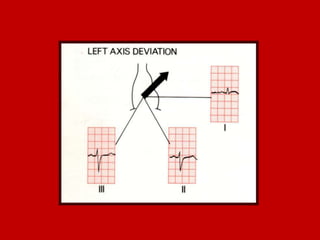


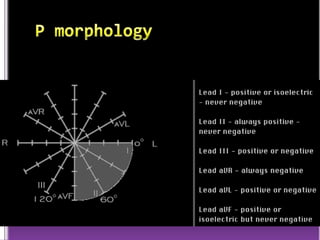
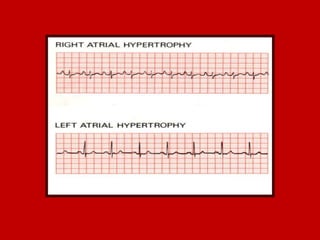


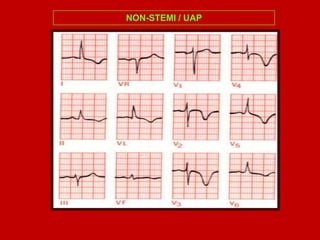

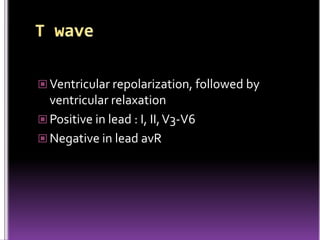
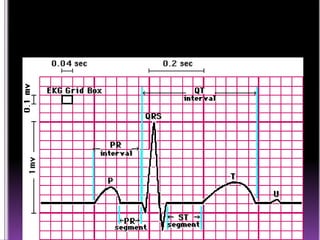

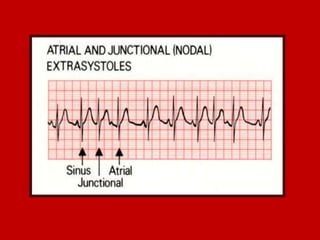


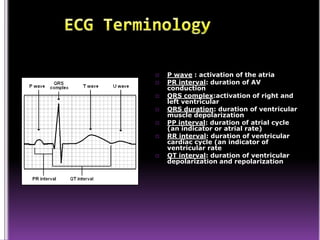
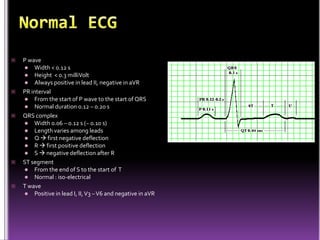
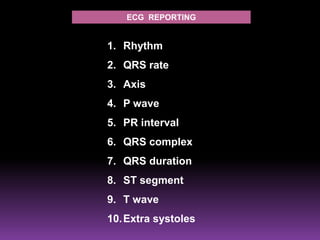
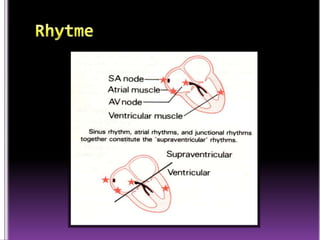
This document contains information about electrocardiography (ECG) including how to interpret various components of the ECG like the P wave, QRS complex, T wave, and intervals. It discusses how to measure heart rate, determine the cardiac axis, identify abnormalities, and report key findings. The document provides details on the normal morphology and measurements of the various waves and intervals that make up the ECG.


