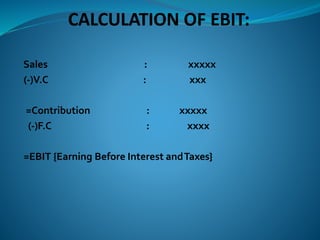
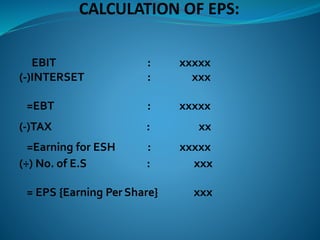
APPROACHES TO
DETERMINEAPPROPRIATE
CAPITALSTRUCTURE- EBIT –
EPSAPPROACH
Submitted & prepared by:
Amandeep Thakur
(Asst.Prof in PG deptt of commerce)
DAV college Hoshiarpur
APPROACHES TO DETERMINE
APPROPRIATE CAPITAL
STRUCTURE
• EBI T – EPSApproach
• ValuationApproach
• Cash FlowApproach
EBI T – EPS Approach –
• The EPS-EBIT approach to capital structure involves selecting the
capital structure that maximizes EPS over the expected range of
EBIT.
• Using ths approach, the emphasis is on maximizing the owners
returns (EPS).
• The EBIT-EPS approach can help balance a company's debt with its
equity.
• Effective business management requires careful planning and
decision-making about the balance of debt and equity used in
financing the business.
EBI T – EPS Approach –
• The EBIT-EPS approach is one method available to managers
to guide them in making decisions about capital structure.
• The EBIT-EPS approach is one tool managers use to decide on
the right mix of debt and equity financing in a business's
capital structure.
• To benefit from the EBIT-EPS approach, it helps to understand
the basics of how it works, as well as its advantages and
drawbacks.
EBI T – EPS Approach –
• In the EBIT-EPS approach, the business plots graphs of its
performance at different possible debt-to-equity ratios, such as
40 percent debt to 60 percent equity.
• In a basic graph, the earnings per share as a data point is
plotted for each level of earnings before interest and taxes at
different debt-to-equity ratios.
• The graph is then analyzed to determine the ideal level of debt-
to-equity for the business.
EBIT/EPS ANALYSIS
• It design various alternatives of debt, equity and preference shares in
order to maximize the EPS at a given level of EBIT.
• It examines how different capital structures affect earnings available
to shareholders (Earning Per Share).
• It is the analysis of the effect of financing alternatives on earnings
per share.
• To design the capital structure of the firm in such a way so as to
minimize the cost of capital.
• EBIT-EPS analysis is a method to study the effect of leverage under
alternative methods of financing.
CALCULATION OF EBIT:
Sales : xxxxx
(-)V.C : xxx
=Contribution : xxxxx
(-)F.C : xxxx
=EBIT {Earning Before Interest andTaxes}
CALCULATION OF EPS:
EBIT : xxxxx
(-)INTERSET : xxx
=EBT : xxxxx
(-)TAX : xx
=Earning for ESH : xxxxx
(÷) No. of E.S : xxx
= EPS {Earning Per Share} xxx
EBIT – EPS BREAK EVEN ANALYSIS:
• The EBIT level at which the EPS is the same for two
alternative financial plan is referred to as the indifference
point/level.
• Financial break even point obtained by a company at a given
level of EBIT for which the firm’s EPS is zero.
• If EBIT is less than financial break even point, then the EPS is
negative.
• If EBIT is more than the financial break even point, then more
and more fixed cost financing option can be used by a firm.
DRAWBACKS
• The EBIT-EPS approach is not always the best tool for making
decisions about capital structuring.
• The EBIT-EPS approach places heavy emphasis on maximizing
earnings per share rather than controlling costs and limiting risk.
• It's important to keep in mind that as debt financing increases,
investors should expect a higher return to account for the greater
risk; this is known as a risk premium.
• The EBIT-EPS approach does not factor this risk premium into the
cost of financing, which can have the effect of making a higher level
of debt seem more advantageous for investors than it actually is.
LEVERAGE
Leverage is the employment of an asset/source of finance for
which firm pay fixed cost/fixed return. It may of three types:
• Operating Leverage
• Financial Leverage
• Combined Leverage
OPERATING LEVERAGE
• It may be defined as the firm’s ability to use fixed operating
costs to magnify the effects of changes in sales on its earnings
before interest and taxes.
• Operating leverage is associated with investment (assets
acquisition) activities.
• Degree of Operating Leverage (DOL) = Percentage change in
EBIT / Percentage change in sales
FINANCIAL LEVERAGE
• Financial leverage is the ability of the firm to use fixed
financial charges to magnify the effects of changes in EBIT on
the firm’s earnings per share.
• Degree of financial leverage (DFL)= Percentage change in
EPS divided by Percentage change in EBIT
COMBINED LEVERAGE
• The degree of combined leverage may be defined as the
percentage change in EPS due to the percentage change in
sales.
• Thus the combined leverage is:
CL
%Changein EBIT
%changein sales
*
%Changein EPS
%Changein EBIT
%changein EPS
%Changesales
Stay At home , Stay safe
BE A RESPONSIBLE CITIZEN!!
THANKS & REGARDS

Ebit-Eps Analysis

  • 1.
    APPROACHES TO DETERMINEAPPROPRIATE CAPITALSTRUCTURE- EBIT– EPSAPPROACH Submitted & prepared by: Amandeep Thakur (Asst.Prof in PG deptt of commerce) DAV college Hoshiarpur
  • 2.
    APPROACHES TO DETERMINE APPROPRIATECAPITAL STRUCTURE • EBI T – EPSApproach • ValuationApproach • Cash FlowApproach
  • 3.
    EBI T –EPS Approach – • The EPS-EBIT approach to capital structure involves selecting the capital structure that maximizes EPS over the expected range of EBIT. • Using ths approach, the emphasis is on maximizing the owners returns (EPS). • The EBIT-EPS approach can help balance a company's debt with its equity. • Effective business management requires careful planning and decision-making about the balance of debt and equity used in financing the business.
  • 4.
    EBI T –EPS Approach – • The EBIT-EPS approach is one method available to managers to guide them in making decisions about capital structure. • The EBIT-EPS approach is one tool managers use to decide on the right mix of debt and equity financing in a business's capital structure. • To benefit from the EBIT-EPS approach, it helps to understand the basics of how it works, as well as its advantages and drawbacks.
  • 5.
    EBI T –EPS Approach – • In the EBIT-EPS approach, the business plots graphs of its performance at different possible debt-to-equity ratios, such as 40 percent debt to 60 percent equity. • In a basic graph, the earnings per share as a data point is plotted for each level of earnings before interest and taxes at different debt-to-equity ratios. • The graph is then analyzed to determine the ideal level of debt- to-equity for the business.
  • 6.
    EBIT/EPS ANALYSIS • Itdesign various alternatives of debt, equity and preference shares in order to maximize the EPS at a given level of EBIT. • It examines how different capital structures affect earnings available to shareholders (Earning Per Share). • It is the analysis of the effect of financing alternatives on earnings per share. • To design the capital structure of the firm in such a way so as to minimize the cost of capital. • EBIT-EPS analysis is a method to study the effect of leverage under alternative methods of financing.
  • 7.
    CALCULATION OF EBIT: Sales: xxxxx (-)V.C : xxx =Contribution : xxxxx (-)F.C : xxxx =EBIT {Earning Before Interest andTaxes}
  • 8.
    CALCULATION OF EPS: EBIT: xxxxx (-)INTERSET : xxx =EBT : xxxxx (-)TAX : xx =Earning for ESH : xxxxx (÷) No. of E.S : xxx = EPS {Earning Per Share} xxx
  • 9.
    EBIT – EPSBREAK EVEN ANALYSIS: • The EBIT level at which the EPS is the same for two alternative financial plan is referred to as the indifference point/level. • Financial break even point obtained by a company at a given level of EBIT for which the firm’s EPS is zero. • If EBIT is less than financial break even point, then the EPS is negative. • If EBIT is more than the financial break even point, then more and more fixed cost financing option can be used by a firm.
  • 10.
    DRAWBACKS • The EBIT-EPSapproach is not always the best tool for making decisions about capital structuring. • The EBIT-EPS approach places heavy emphasis on maximizing earnings per share rather than controlling costs and limiting risk. • It's important to keep in mind that as debt financing increases, investors should expect a higher return to account for the greater risk; this is known as a risk premium. • The EBIT-EPS approach does not factor this risk premium into the cost of financing, which can have the effect of making a higher level of debt seem more advantageous for investors than it actually is.
  • 11.
    LEVERAGE Leverage is theemployment of an asset/source of finance for which firm pay fixed cost/fixed return. It may of three types: • Operating Leverage • Financial Leverage • Combined Leverage
  • 12.
    OPERATING LEVERAGE • Itmay be defined as the firm’s ability to use fixed operating costs to magnify the effects of changes in sales on its earnings before interest and taxes. • Operating leverage is associated with investment (assets acquisition) activities. • Degree of Operating Leverage (DOL) = Percentage change in EBIT / Percentage change in sales
  • 13.
    FINANCIAL LEVERAGE • Financialleverage is the ability of the firm to use fixed financial charges to magnify the effects of changes in EBIT on the firm’s earnings per share. • Degree of financial leverage (DFL)= Percentage change in EPS divided by Percentage change in EBIT
  • 14.
    COMBINED LEVERAGE • Thedegree of combined leverage may be defined as the percentage change in EPS due to the percentage change in sales. • Thus the combined leverage is: CL %Changein EBIT %changein sales * %Changein EPS %Changein EBIT %changein EPS %Changesales
  • 15.
    Stay At home, Stay safe BE A RESPONSIBLE CITIZEN!! THANKS & REGARDS