Downloaded 266 times


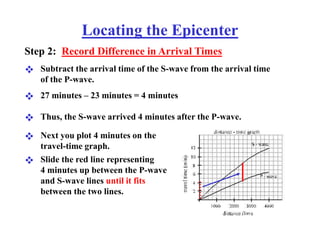
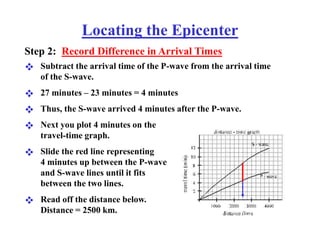
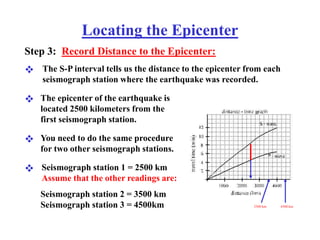
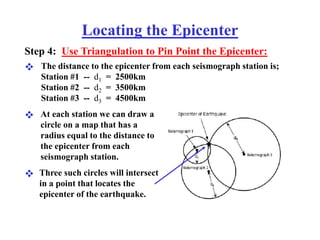
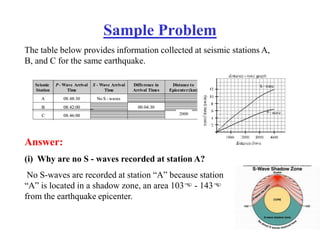

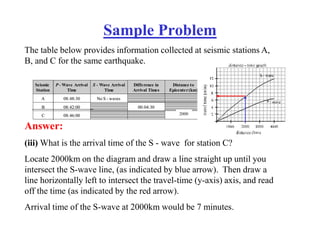

The document describes how to locate an earthquake's epicenter using data from three seismograph stations. For each station, the difference in arrival times between the P and S waves is calculated and plotted on a travel-time graph to determine the distance to the epicenter. Triangulation is then used to pinpoint the exact epicenter location where the distance circles from each station intersect.