The document describes how to locate the epicenter of an earthquake using data from three seismic stations. Key steps include:
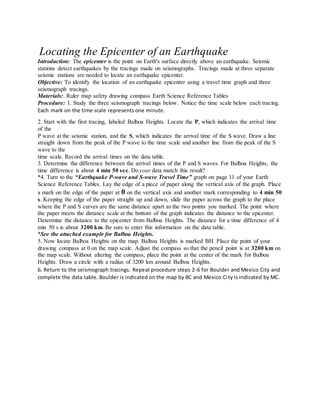
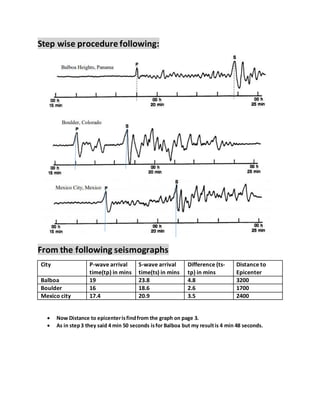
1. Recording the arrival times of P and S waves from each station's seismograph tracing.
2. Calculating the time difference between P and S wave arrivals.
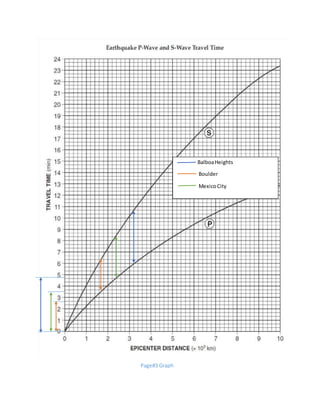
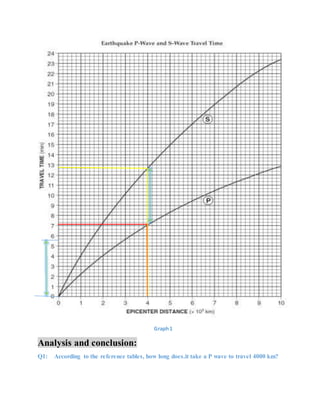
3. Using a travel time graph to determine the distance from each station to the epicenter based on the time difference.
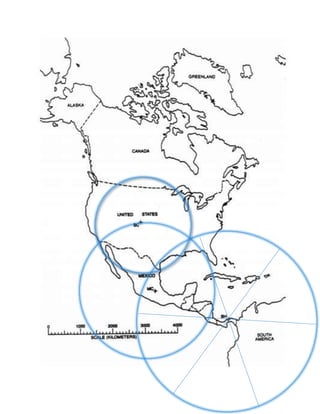
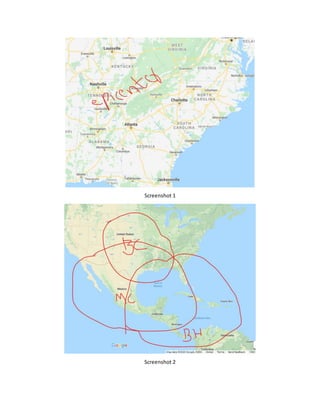
4. Drawing circles around each station with radii equal to the distance to the epicenter. The intersection of all three circles locates the epicenter.
In 1977, after decades of tediously collecting and mapping ocean sonar data, scientists began to see a fairly accurate picture of the seafloor emerge. The Tharp-Heezen map illustrated the geological features that characterize the seafloor and became a crucial factor in the acceptance of the theories of plate tectonics and continental drift. Today, these theories serve as the foundation upon which we understand the geologic processes that shape the Earth.
https://www.nationalgeographic.org/media/plate-tectonics/#:~:text=The%20theory%20of%20plate%20tectonics,upper%20portion%20of%20the%20mantle.&text=Thus%2C%20at%20divergent%20boundaries%2C%20oceanic%20crust%20is%20created.
A fault is a break or fracture between two blocks of rocks in response to stress.
One block has moved relative to the other block.
The surface along which the blocks move is called a fault plane.
Faulting produced the earthquakes.
Thus earthquakes may occur because:
a) Rocks are initially broken to produce a fault.
b) Movement or re-activation of an already existing fault.
Fault is a fracture discontinuity along which the rocks on either side have moved past each other . It describes about the parts and types of fault an also the various field evidences for the occurrence of a fault .
Published by Mining Matters this secondary school thematic resources uses the topic of diamonds to explore Earth's structure and process, the mining cycle as well a careers in the minerals industry.
The 21 activities in Discovering Diamonds bring in elements from every area of Earth Science – from earthquakes to environment, cratons to chemicals. Activities are presented in sequence in five topics, starting with the large-scale structure of the earth, moving into tectonic and surficial processes, and finishing with a look at the mining industry, including exploration, mining, processing, and mining’s importance to Canadians.
Students will learn about Canada’s world-class diamond-bearing deposits, diamond formation, and the modern technology being applied to the discovery, extraction, and processing of diamonds. The diamond industry uses cutting-edge technology; current information about this industry makes a valuable addition to the school Earth Science curriculum.
ACEP Magazine edition 4th launched on 05.06.2024Rahul
This document provides information about the third edition of the magazine "Sthapatya" published by the Association of Civil Engineers (Practicing) Aurangabad. It includes messages from current and past presidents of ACEP, memories and photos from past ACEP events, information on life time achievement awards given by ACEP, and a technical article on concrete maintenance, repairs and strengthening. The document highlights activities of ACEP and provides a technical educational article for members.
HEAP SORT ILLUSTRATED WITH HEAPIFY, BUILD HEAP FOR DYNAMIC ARRAYS.
Heap sort is a comparison-based sorting technique based on Binary Heap data structure. It is similar to the selection sort where we first find the minimum element and place the minimum element at the beginning. Repeat the same process for the remaining elements.
NUMERICAL SIMULATIONS OF HEAT AND MASS TRANSFER IN CONDENSING HEAT EXCHANGERS...ssuser7dcef0
Power plants release a large amount of water vapor into the
atmosphere through the stack. The flue gas can be a potential
source for obtaining much needed cooling water for a power
plant. If a power plant could recover and reuse a portion of this
moisture, it could reduce its total cooling water intake
requirement. One of the most practical way to recover water
from flue gas is to use a condensing heat exchanger. The power
plant could also recover latent heat due to condensation as well
as sensible heat due to lowering the flue gas exit temperature.
Additionally, harmful acids released from the stack can be
reduced in a condensing heat exchanger by acid condensation. reduced in a condensing heat exchanger by acid condensation.
Condensation of vapors in flue gas is a complicated
phenomenon since heat and mass transfer of water vapor and
various acids simultaneously occur in the presence of noncondensable
gases such as nitrogen and oxygen. Design of a
condenser depends on the knowledge and understanding of the
heat and mass transfer processes. A computer program for
numerical simulations of water (H2O) and sulfuric acid (H2SO4)
condensation in a flue gas condensing heat exchanger was
developed using MATLAB. Governing equations based on
mass and energy balances for the system were derived to
predict variables such as flue gas exit temperature, cooling
water outlet temperature, mole fraction and condensation rates
of water and sulfuric acid vapors. The equations were solved
using an iterative solution technique with calculations of heat
and mass transfer coefficients and physical properties.
6th International Conference on Machine Learning & Applications (CMLA 2024)ClaraZara1
6th International Conference on Machine Learning & Applications (CMLA 2024) will provide an excellent international forum for sharing knowledge and results in theory, methodology and applications of on Machine Learning & Applications.
A review on techniques and modelling methodologies used for checking electrom...nooriasukmaningtyas
The proper function of the integrated circuit (IC) in an inhibiting electromagnetic environment has always been a serious concern throughout the decades of revolution in the world of electronics, from disjunct devices to today’s integrated circuit technology, where billions of transistors are combined on a single chip. The automotive industry and smart vehicles in particular, are confronting design issues such as being prone to electromagnetic interference (EMI). Electronic control devices calculate incorrect outputs because of EMI and sensors give misleading values which can prove fatal in case of automotives. In this paper, the authors have non exhaustively tried to review research work concerned with the investigation of EMI in ICs and prediction of this EMI using various modelling methodologies and measurement setups.
Understanding Inductive Bias in Machine LearningSUTEJAS
This presentation explores the concept of inductive bias in machine learning. It explains how algorithms come with built-in assumptions and preferences that guide the learning process. You'll learn about the different types of inductive bias and how they can impact the performance and generalizability of machine learning models.
The presentation also covers the positive and negative aspects of inductive bias, along with strategies for mitigating potential drawbacks. We'll explore examples of how bias manifests in algorithms like neural networks and decision trees.
By understanding inductive bias, you can gain valuable insights into how machine learning models work and make informed decisions when building and deploying them.
Hierarchical Digital Twin of a Naval Power SystemKerry Sado
A hierarchical digital twin of a Naval DC power system has been developed and experimentally verified. Similar to other state-of-the-art digital twins, this technology creates a digital replica of the physical system executed in real-time or faster, which can modify hardware controls. However, its advantage stems from distributing computational efforts by utilizing a hierarchical structure composed of lower-level digital twin blocks and a higher-level system digital twin. Each digital twin block is associated with a physical subsystem of the hardware and communicates with a singular system digital twin, which creates a system-level response. By extracting information from each level of the hierarchy, power system controls of the hardware were reconfigured autonomously. This hierarchical digital twin development offers several advantages over other digital twins, particularly in the field of naval power systems. The hierarchical structure allows for greater computational efficiency and scalability while the ability to autonomously reconfigure hardware controls offers increased flexibility and responsiveness. The hierarchical decomposition and models utilized were well aligned with the physical twin, as indicated by the maximum deviations between the developed digital twin hierarchy and the hardware.
2. Locating the Epicenter of an Earthquake
Introduction: The epicenter is the point on Earth's surface directly above an earthquake. Seismic
stations detect earthquakes by the tracings made on seismographs. Tracings made at three separate
seismic stations are needed to locate an earthquake epicenter.
Objective: To identify the location of an earthquake epicenter using a travel time graph and three
seismograph tracings.
Materials:. Ruler map safety drawing compass Earth Science Reference Tables
Procedure: 1. Study the three seismograph tracings below. Notice the time scale below each tracing.
Each mark on the time scale represents one minute.
2. Start with the first tracing, labeled Balboa Heights. Locate the P, which indicates the arrival time
of the
P wave at the seismic station, and the S, which indicates the arrival time of the S wave. Draw a line
straight down from the peak of the P wave to the time scale and another line from the peak of the S
wave to the
time scale. Record the arrival times on the data table.
3. Determine the difference between the arrival times of the P and S waves. For Balboa Heights, the
time difference is about 4 min 50 sec. Do your data match this result?
*4. Turn to the “Earthquake P-wave and S-wave Travel Time” graph on page 11 of your Earth
Science Reference Tables. Lay the edge of a piece of paper along the vertical axis of the graph. Place
a mark on the edge of the paper at 0 on the vertical axis and another mark corresponding to 4 min 50
s. Keeping the edge of the paper straight up and down, slide the paper across the graph to the place
where the P and S curves are the same distance apart as the two points you marked. The point where
the paper meets the distance scale at the bottom of the graph indicates the distance to the epicenter.
Determine the distance to the epicenter from Balboa Heights. The distance for a time difference of 4
min 50 s is about 3200 km. Be sure to enter this information on the data table.
*See the attached example for Balboa Heights.
5. Now locate Balboa Heights on the map. Balboa Heights is marked BH. Place the point of your
drawing compass at 0 on the map scale. Adjust the compass so that the pencil point is at 3200 km on
the map scale. Without altering the compass, place the point at the center of the mark for Balboa
Heights. Draw a circle with a radius of 3200 km around Balboa Heights.
6. Return to the seismograph tracings. Repeat procedure steps 2-6 for Boulder and Mexico City and
complete the data table. Boulder is indicated on the map by BC and Mexico City is indicated by MC.
3. Step wise procedure following:
From the following seismographs
City P-wave arrival
time(tp) in mins
S-wave arrival
time(ts) in mins
Difference (ts-
tp) in mins
Distance to
Epicenter
Balboa 19 23.8 4.8 3200
Boulder 16 18.6 2.6 1700
Mexico city 17.4 20.9 3.5 2400
Now Distance to epicenterisfindfrom the graph on page 3.
As in step3 they said 4 min 50 seconds isfor Balboa but my resultis 4 min 48 seconds.
7. Answer: From Graph 1 at 4000km the time taken by P wave (tp) is approximately 7 minutes
10 seconds
Q2: Howlong does it take an S wave to travel 4000 km?
Answer:From the Graph 1 at 4000km the time taken by S wave (ts) is approximately 12 minutes 40
seconds.
Q3: Whatis the difference inarrival timesfor a P wave and S wave that have traveled4000 km?
Answer: Sofrom Q1 and Q2 (ts-tp=5.5minutes) sothe differenceis 5 minutesand30 seconds.
Q4: What is the approximate distance to the epicenterifthe difference inthe arrival timesof the P
wave and S wave is 5.5 min?
Answer: FromGraph 1 the approximate distance tothe epicenter is4100Km.
Q5: As the distance to the epicenterincreases,howdoesthe amount of time betweenthe S wave and
the P wave change?
Answer: Fromthe graph as the distance toepicenterisincreasesthe amountof time betweenPandS
increases.
Q6: Afterdrawing the first circle for Balboa Heights,where is the earthquake epicenterlocated
relative to this one circle?
Answer: Fromonlyone circle the earthquake epicenterisatthe circumference of the circle.Itwill all
aroundthe circle boundary.
Q7: Afterdrawing the circle for Boulder,you now have two circleson your map. Relative to these two
circles,where is the earthquake epicenter?
Answer:From nowthe twocircle itis little biteasier.The earthquake epicenterwill be atthat area
where the twocirclesintersecteachother.
Q8: Afterdrawing the circle for MexicoCity,you now have three circleson your map. Relative to the
three circles,where is the earthquake epicenter?
Answer: Nowfromthe three circlesitisveryeasyto the findthe fixedpointof earthquakeepicenter.It
isat that pointwhere the circlesintersecteachother onpage
Q9: Give the location and year of the major earthquake from the past that occurred in the same area
as the epicenteryouhave just located?
Answer: Fromthe Google map I have takenscreenshots.The epicenterisshownin Screenshot2and
areas nearlytothe epicenterisin screenshot1.
Year Location MomentMagnitude Deaths
1886 SouthCarolina 6.9-7.3 60
1906 San Francisco,California 7.9 3000
1989 Loma Prieta,California 6.9 63
1994 Northridge,California 6.7 61
9. Q10: Wouldit be possible foran earthquake at thissame location to be feltwhere you live?Whyor
why not?
Answer:I live in MalakandDargai. Letwe assume earthquake epicenteratMexicoCitysofrom
Malakandto MexicoCitydistance is 13,934Km soit isverydifficulttofeltearthquake.Butitmayor may
not be feltbecause if level of shakingisveryhighsoitis possible tofeel it.
The End