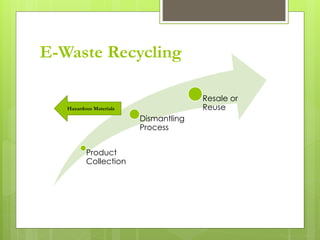
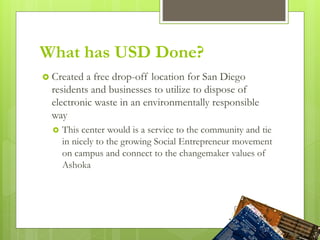
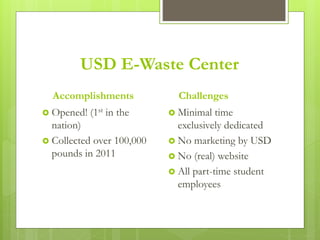
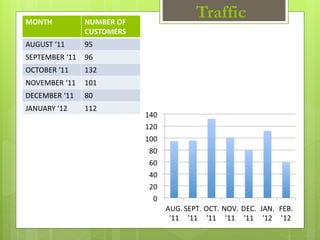
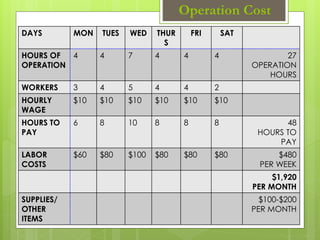
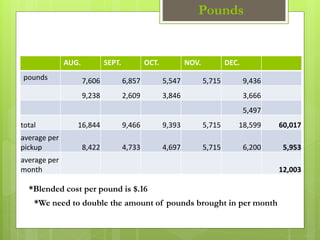
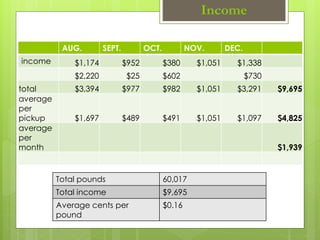
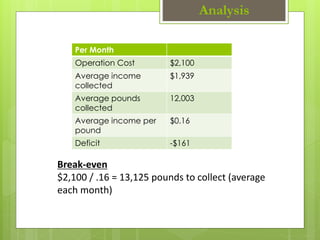
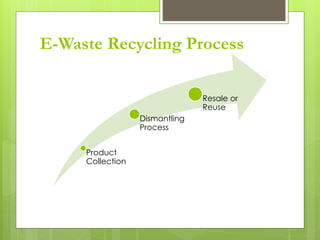
Don’t Throw Away an
Opportunity to Recycle
Michael Catanzaro
University of San Diego
Global
Entrepreneurship
for Social Change
Question:
How many of you
have old
electronics and
computers at your
house or
apartment?
Question:
How many of you
have upgraded
your phone in the
last year?
Question:
How many
different iPods
are there?
October 2001, apple presents first ipod
July 2002, apple presents second generation ipod, compatible with windows
April 2003, third generation ipod
January 2004, ipod mini in five different colors
January 2005, ipod shuffle
September 2005, ipod nano
October 2005, fifth generation ipod plays video
May 2006, Nike + ipod to track runners
September 2006, ipod nano gets new aluminum cover in five different colors
September 2006, new ipod shuffle with built in clip
January 2007, iphone introduced, ipod shuffle available in five colors
September 2007, ipod touch
June 2008, iphone 3g
September 2010, new itouch, new nano, and new shuffle
ipods since 2001 if including GB and colors
2001- 2010: 275 million ipods sold
18 different ipods since 2001
What is electronic waste?
 Obsolete electronic products
• Known as:
 e-waste
 end of life
electronics (EOL)
 waste electronic and
electrical equipment
(WEEE)
(pikeresearch.com
Problem:
 People do not throw their e-waste away because they
know it’s bad for the environment
 Approximately 70% of all electronics produced in the
last 10 years are sitting in people’s homes, garages and
drawers
 When it is disposed of incorrectly it creates pollution,
plastics can leech
 There are international repercussions as much of
improperly disposed of e-waste ends up in China, Ghana
and other developing nations and becomes a social justice
issue
Traditional Disposal
 Linear process
 75% of e-waste is processed this way
Why is it Different?
 Contains both valuable and hazardous materials
E-Waste Recycling
Product
Collection
Dismantling
Process
Resale or
ReuseHazardous Materials
FULL STORY: http://www.cbsnews.com/video/watch/?id=5274959n
60 Minutes (China)
USD Student
Experience on
Semester at Sea
SAS (Ghana)
Market Condition:
E-waste is the fastest growing municipal waste stream
in the U.S.
 Between 2000 and 2006, e-waste generation increased by 52%
(U.S. EPA 2007)
 Will continue to increase with technological advancements
and obsolescence
Bulk of e-waste in the U.S. is thrown into landfills
 Both environmentally and economically unsustainable
 Environmental contamination from toxins
 Necessitates mining for raw materials
Current Trends: Volume Generation
 Fastest growing municipal waste stream
Quantity of EOL Electronics in the U.S.
(US EPA, 2009)
Market Condition Cont’d
Televisions Computer Products Cell Phones
20.6
157.3
126.3
6.3
48.2
14
Trashed Recycled
E-Waste in 2007
No Regulation
Market Condition Cont’d
Market Condition:
One metric ton (t) of electronic scrap from personal
computers (PC’s) contains more gold than that
recovered from 17 t of gold ore.
In 1998, the amount of gold recovered from
electronic scrap in the United States was equivalent to that recovered from
more than 2 million metric tons (Mt) of gold ore and waste. (USGS,
2001)
In contrast with many home appliances, life cycle ener
gy use of a computer is dominated by production (81
%) as opposed to operation (19%).
(Environmental Science & Technology, 2004)
Market Condition Cont’d
 Created a free drop-off location for San Diego
residents and businesses to utilize to dispose of
electronic waste in an environmentally responsible
way
 This center would is a service to the community and tie
in nicely to the growing Social Entrepreneur movement
on campus and connect to the changemaker values of
Ashoka
What has USD Done?
Mission Statement
The University of San Diego supports recycling and
re-using electronic waste, which limits pollution and
reduces the need to mine for raw material. Our E-
Waste Collection Center provides a socially and
environmentally sustainable service to our community.
Our nonprofit organization strives to keep all e-waste
in California as it is recycled safely, securely, and
responsibly. All proceeds from this collection center go
back to providing scholarships for students.
Why USD is Different:
 We collect ALL e-waste
 Computers, cell phones, etc. (EASY)
 Easily sold/repurposed- creates revenue
 Batteries, toner light bulbs (NOT SO EASY)
 Hazardous materials that can cost as much as $4.00 per
pound to dispose of
USD E-Waste Center
Accomplishments
 Opened! (1st in the
nation)
 Collected over 100,000
pounds in 2011
Challenges
 Minimal time
exclusively dedicated
 No marketing by USD
 No (real) website
 All part-time student
employees
TrafficMONTH NUMBER OF
CUSTOMERS
AUGUST ‘11 95
SEPTEMBER ‘11 96
OCTOBER ‘11 132
NOVEMBER ‘11 101
DECEMBER ‘11 80
JANUARY ‘12 112
Operation Cost
DAYS MON TUES WED THUR
S
FRI SAT
HOURS OF
OPERATION
4 4 7 4 4 4 27
OPERATION
HOURS
WORKERS 3 4 5 4 4 2
HOURLY
WAGE
$10 $10 $10 $10 $10 $10
HOURS TO
PAY
6 8 10 8 8 8 48
HOURS TO
PAY
LABOR
COSTS
$60 $80 $100 $80 $80 $80 $480
PER WEEK
$1,920
PER MONTH
SUPPLIES/
OTHER
ITEMS
$100-$200
PER MONTH
Pounds
AUG. SEPT. OCT. NOV. DEC.
pounds 7,606 6,857 5,547 5,715 9,436
9,238 2,609 3,846 3,666
5,497
total 16,844 9,466 9,393 5,715 18,599 60,017
average per
pickup 8,422 4,733 4,697 5,715 6,200 5,953
average per
month 12,003
*Blended cost per pound is $.16
*We need to double the amount of pounds brought in per month
Income
AUG. SEPT. OCT. NOV. DEC.
income $1,174 $952 $380 $1,051 $1,338
$2,220 $25 $602 $730
total $3,394 $977 $982 $1,051 $3,291 $9,695
average
per
pickup $1,697 $489 $491 $1,051 $1,097 $4,825
average
per
month $1,939
Total pounds 60,017
Total income $9,695
Average cents per
pound
$0.16
Analysis
Per Month
Operation Cost $2,100
Average income
collected
$1,939
Average pounds
collected
12,003
Average income per
pound
$0.16
Deficit -$161
Break-even
$2,100 / .16 = 13,125 pounds to collect (average
each month)
E-Waste Recycling Process
Product
Collection
Dismantling
Process
Resale or
Reuse
Product Collection
 We need to double the amount of e-waste we collect
 Targeted Marketing
 Business Partners
 Waste Management
 Sony?
 Qualcomm?
Dismantling Process
 Currently handled in California and Texas by
external vendor
 A different vendor may give us better rates (more $)
 Would need to be e-steward certified
 Mostly this is out of our hands though (we don’t
have much input on this process
Resale or Reuse
 Areas for Major Improvement
 E-Bay
 Cell phone chargers
 Putting useable computers back in classrooms:
 San Diego Futures Foundation (*brand new idea)
 Jamaican Computer Center (*brand new idea)
 Other Reuses?
New Paradigm for Sustainability
Old Paradigm
Social Benefits
considered
seperate
Environmental
benefits
considered
seperate
Economic
Benefits
considered
seperate
Social
EnvironmentEconomic
Sustainability
Social
Environment
Economic
Sustainability
Social
Economic and
Environmental
benefits
considered
together
New Paradigm
Old Paradigm
Partnerships
with Industry
Tons of CO2
avoided.
Not ending up in
landfills
Money from
sold waste
Scholarships
Social
EnvironmentEconomic
Questions?

E waste presentation

  • 1.
    Don’t Throw Awayan Opportunity to Recycle Michael Catanzaro University of San Diego Global Entrepreneurship for Social Change
  • 2.
    Question: How many ofyou have old electronics and computers at your house or apartment?
  • 3.
    Question: How many ofyou have upgraded your phone in the last year?
  • 4.
  • 5.
    October 2001, applepresents first ipod July 2002, apple presents second generation ipod, compatible with windows April 2003, third generation ipod January 2004, ipod mini in five different colors January 2005, ipod shuffle September 2005, ipod nano October 2005, fifth generation ipod plays video May 2006, Nike + ipod to track runners September 2006, ipod nano gets new aluminum cover in five different colors September 2006, new ipod shuffle with built in clip January 2007, iphone introduced, ipod shuffle available in five colors September 2007, ipod touch June 2008, iphone 3g September 2010, new itouch, new nano, and new shuffle ipods since 2001 if including GB and colors 2001- 2010: 275 million ipods sold 18 different ipods since 2001
  • 6.
    What is electronicwaste?  Obsolete electronic products • Known as:  e-waste  end of life electronics (EOL)  waste electronic and electrical equipment (WEEE) (pikeresearch.com
  • 7.
    Problem:  People donot throw their e-waste away because they know it’s bad for the environment  Approximately 70% of all electronics produced in the last 10 years are sitting in people’s homes, garages and drawers  When it is disposed of incorrectly it creates pollution, plastics can leech  There are international repercussions as much of improperly disposed of e-waste ends up in China, Ghana and other developing nations and becomes a social justice issue
  • 8.
    Traditional Disposal  Linearprocess  75% of e-waste is processed this way
  • 9.
    Why is itDifferent?  Contains both valuable and hazardous materials
  • 10.
  • 11.
  • 12.
  • 13.
  • 14.
    Market Condition: E-waste isthe fastest growing municipal waste stream in the U.S.  Between 2000 and 2006, e-waste generation increased by 52% (U.S. EPA 2007)  Will continue to increase with technological advancements and obsolescence Bulk of e-waste in the U.S. is thrown into landfills  Both environmentally and economically unsustainable  Environmental contamination from toxins  Necessitates mining for raw materials
  • 15.
    Current Trends: VolumeGeneration  Fastest growing municipal waste stream Quantity of EOL Electronics in the U.S. (US EPA, 2009) Market Condition Cont’d
  • 16.
    Televisions Computer ProductsCell Phones 20.6 157.3 126.3 6.3 48.2 14 Trashed Recycled E-Waste in 2007
  • 17.
  • 18.
    Market Condition: One metricton (t) of electronic scrap from personal computers (PC’s) contains more gold than that recovered from 17 t of gold ore. In 1998, the amount of gold recovered from electronic scrap in the United States was equivalent to that recovered from more than 2 million metric tons (Mt) of gold ore and waste. (USGS, 2001) In contrast with many home appliances, life cycle ener gy use of a computer is dominated by production (81 %) as opposed to operation (19%). (Environmental Science & Technology, 2004) Market Condition Cont’d
  • 19.
     Created afree drop-off location for San Diego residents and businesses to utilize to dispose of electronic waste in an environmentally responsible way  This center would is a service to the community and tie in nicely to the growing Social Entrepreneur movement on campus and connect to the changemaker values of Ashoka What has USD Done?
  • 20.
    Mission Statement The Universityof San Diego supports recycling and re-using electronic waste, which limits pollution and reduces the need to mine for raw material. Our E- Waste Collection Center provides a socially and environmentally sustainable service to our community. Our nonprofit organization strives to keep all e-waste in California as it is recycled safely, securely, and responsibly. All proceeds from this collection center go back to providing scholarships for students.
  • 21.
    Why USD isDifferent:  We collect ALL e-waste  Computers, cell phones, etc. (EASY)  Easily sold/repurposed- creates revenue  Batteries, toner light bulbs (NOT SO EASY)  Hazardous materials that can cost as much as $4.00 per pound to dispose of
  • 22.
    USD E-Waste Center Accomplishments Opened! (1st in the nation)  Collected over 100,000 pounds in 2011 Challenges  Minimal time exclusively dedicated  No marketing by USD  No (real) website  All part-time student employees
  • 23.
    TrafficMONTH NUMBER OF CUSTOMERS AUGUST‘11 95 SEPTEMBER ‘11 96 OCTOBER ‘11 132 NOVEMBER ‘11 101 DECEMBER ‘11 80 JANUARY ‘12 112
  • 24.
    Operation Cost DAYS MONTUES WED THUR S FRI SAT HOURS OF OPERATION 4 4 7 4 4 4 27 OPERATION HOURS WORKERS 3 4 5 4 4 2 HOURLY WAGE $10 $10 $10 $10 $10 $10 HOURS TO PAY 6 8 10 8 8 8 48 HOURS TO PAY LABOR COSTS $60 $80 $100 $80 $80 $80 $480 PER WEEK $1,920 PER MONTH SUPPLIES/ OTHER ITEMS $100-$200 PER MONTH
  • 25.
    Pounds AUG. SEPT. OCT.NOV. DEC. pounds 7,606 6,857 5,547 5,715 9,436 9,238 2,609 3,846 3,666 5,497 total 16,844 9,466 9,393 5,715 18,599 60,017 average per pickup 8,422 4,733 4,697 5,715 6,200 5,953 average per month 12,003 *Blended cost per pound is $.16 *We need to double the amount of pounds brought in per month
  • 26.
    Income AUG. SEPT. OCT.NOV. DEC. income $1,174 $952 $380 $1,051 $1,338 $2,220 $25 $602 $730 total $3,394 $977 $982 $1,051 $3,291 $9,695 average per pickup $1,697 $489 $491 $1,051 $1,097 $4,825 average per month $1,939 Total pounds 60,017 Total income $9,695 Average cents per pound $0.16
  • 27.
    Analysis Per Month Operation Cost$2,100 Average income collected $1,939 Average pounds collected 12,003 Average income per pound $0.16 Deficit -$161 Break-even $2,100 / .16 = 13,125 pounds to collect (average each month)
  • 28.
  • 29.
    Product Collection  Weneed to double the amount of e-waste we collect  Targeted Marketing  Business Partners  Waste Management  Sony?  Qualcomm?
  • 30.
    Dismantling Process  Currentlyhandled in California and Texas by external vendor  A different vendor may give us better rates (more $)  Would need to be e-steward certified  Mostly this is out of our hands though (we don’t have much input on this process
  • 31.
    Resale or Reuse Areas for Major Improvement  E-Bay  Cell phone chargers  Putting useable computers back in classrooms:  San Diego Futures Foundation (*brand new idea)  Jamaican Computer Center (*brand new idea)  Other Reuses?
  • 32.
    New Paradigm forSustainability
  • 33.
  • 34.
  • 35.
    Old Paradigm Partnerships with Industry Tonsof CO2 avoided. Not ending up in landfills Money from sold waste Scholarships Social EnvironmentEconomic
  • 37.