Download to read offline

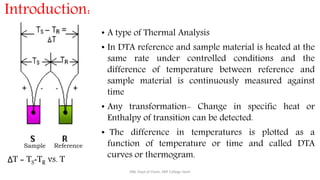
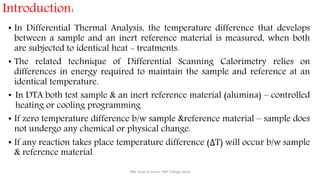
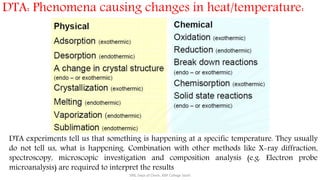
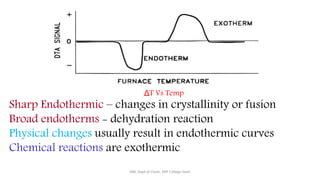
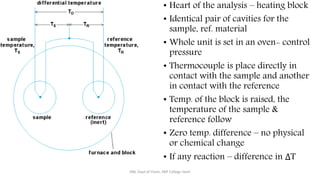
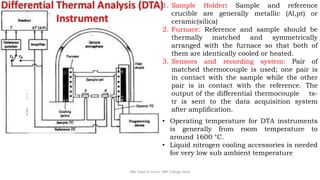


Differential thermal analysis (DTA) measures the temperature difference between a sample and an inert reference material as both are heated or cooled under identical conditions. Any physical or chemical transitions in the sample that involve energy changes, such as melting, crystallization, or decomposition, will result in differences in temperature between the sample and reference. These temperature differences are plotted against temperature or time to produce a DTA curve that can provide information about transition temperatures and energies in the sample.


![DIFFERENTIAL THERMAL ANALYSIS [DTA]](https://cdn.slidesharecdn.com/ss_thumbnails/dtapresentation11-191116170632-thumbnail.jpg?width=640&height=640&fit=bounds)


