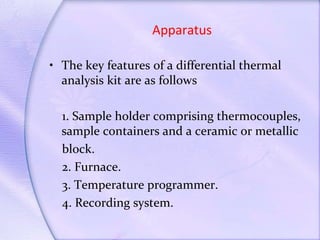
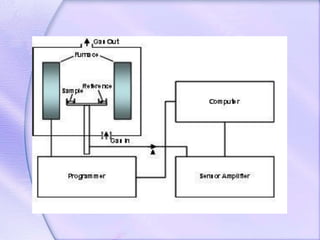
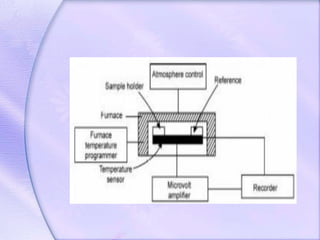
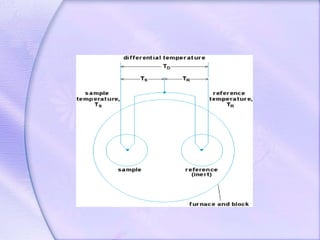
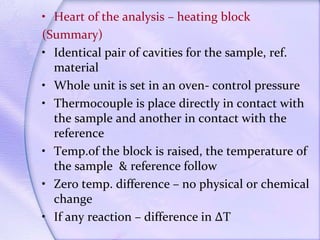
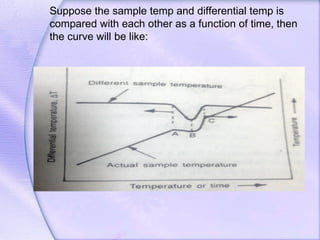
Differential Thermal Analysis (DTA) measures the temperature difference between a sample and an inert reference material during heating to monitor structural and chemical changes. It can provide insights into phase transitions, purity assessments, and various thermal properties, making it valuable in quality control. Key apparatus includes a furnace, thermocouples, and a recording system, with applications in identifying materials, measuring moisture content, and analyzing reactions.

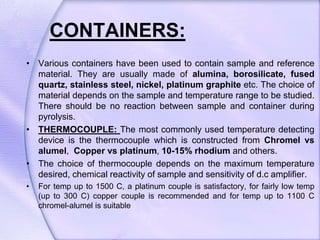


![DIFFERENTIAL THERMAL ANALYSIS [DTA]](https://cdn.slidesharecdn.com/ss_thumbnails/dtapresentation11-191116170632-thumbnail.jpg?width=640&height=640&fit=bounds)


