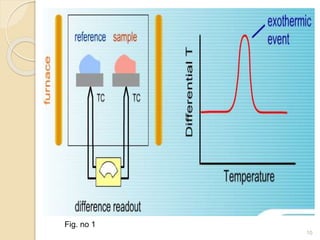
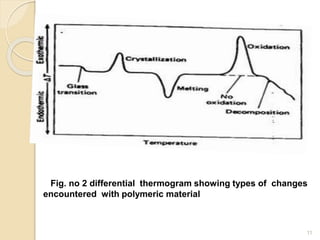
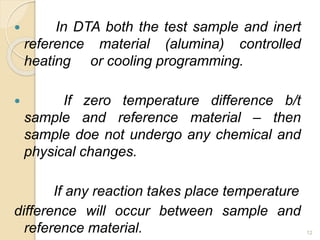
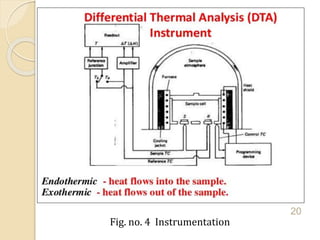
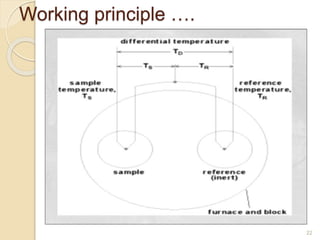
Thermal analysis techniques such as differential thermal analysis (DTA) measure the temperature difference between a sample and an inert reference material as they undergo identical thermal cycles. DTA provides information about physical and chemical changes in a material as it is heated, such as melting, crystallization, and decomposition, by detecting endothermic or exothermic reactions. The DTA instrument consists of sample and reference holders connected to thermocouples within a furnace. Changes in the sample are detected as differences in temperature compared to the unreactive reference. DTA is useful for characterizing materials like minerals, polymers, and pharmaceuticals.
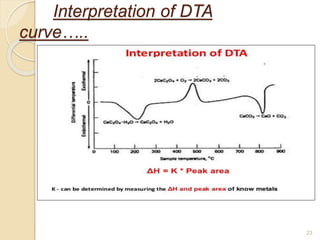
![ Quantitative identification and purity assessment of
material are accomplished by comparing the DTA curve of
sample to that of a reference curve
Impurities may be detected by depression of the M.P.
DTA is widely used in the pharmaceutical] and food
industries.
DTA may be used in cement chemistry mineralogical
research and in environmental studies.
DTA curves may also be used to date bone remains or to
study archaeological materials Using DTA one can obtain
liquids & solidus lines of phase diagrams.
31](https://image.slidesharecdn.com/dtapresentation-161027193717/85/Dta-presentation-31-320.jpg)


![Differential scanning calorimetry [dsc]](https://cdn.slidesharecdn.com/ss_thumbnails/differentialscanningcalorimetrydsc-151225053831-thumbnail.jpg?width=640&height=640&fit=bounds)


![DIFFERENTIAL THERMAL ANALYSIS [DTA]](https://cdn.slidesharecdn.com/ss_thumbnails/dtapresentation11-191116170632-thumbnail.jpg?width=640&height=640&fit=bounds)


![谷歌留痕技术 [ 𝙩𝙤𝙥 𝟮𝟯𝟯. 𝙘 𝙤𝙢 ]](https://cdn.slidesharecdn.com/ss_thumbnails/top233-260130174328-3833018c-thumbnail.jpg?width=640&height=640&fit=bounds)


