Download as PDF, PPTX

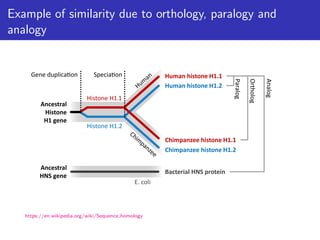
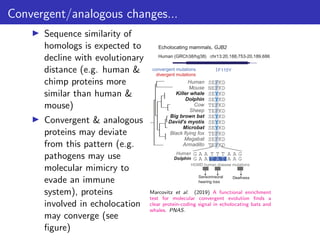
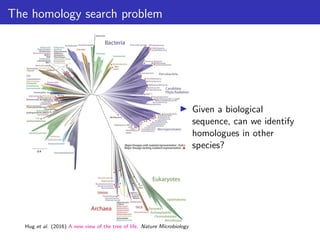
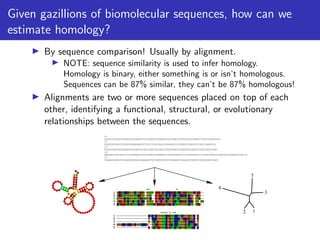
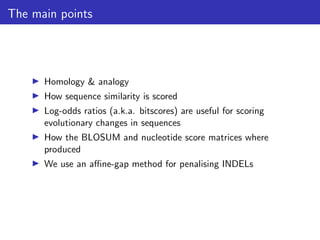
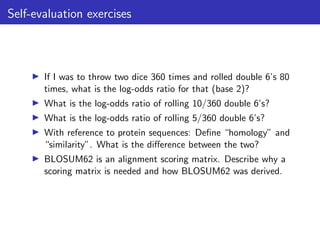
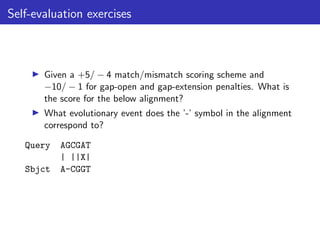
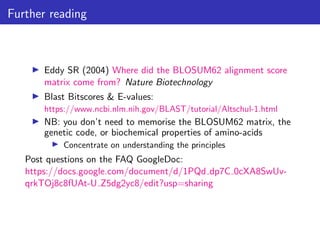


The lecture discusses sequence alignment and comparative genomics, focusing on the distinctions between homology and analogy, how homology is estimated, and the creation of scoring matrices like BLOSUM. It covers the significance of sequence alignments in areas such as genetics, homology search, and evolutionary studies, detailing methods for scoring and interpreting sequence data. The document emphasizes the necessity for geneticists to understand these concepts for effective application in research.


![Polymer [ बहुलक ] Chemistry Notes PDF - Irfanullah Mehar - JJ Sir Chemistry.pdf](https://cdn.slidesharecdn.com/ss_thumbnails/polymerchemistrynotespdf-irfanullahmehar-jjsirchemistry-260210172118-3f9b37f7-thumbnail.jpg?width=640&height=640&fit=bounds)


