Download as PDF, PPTX
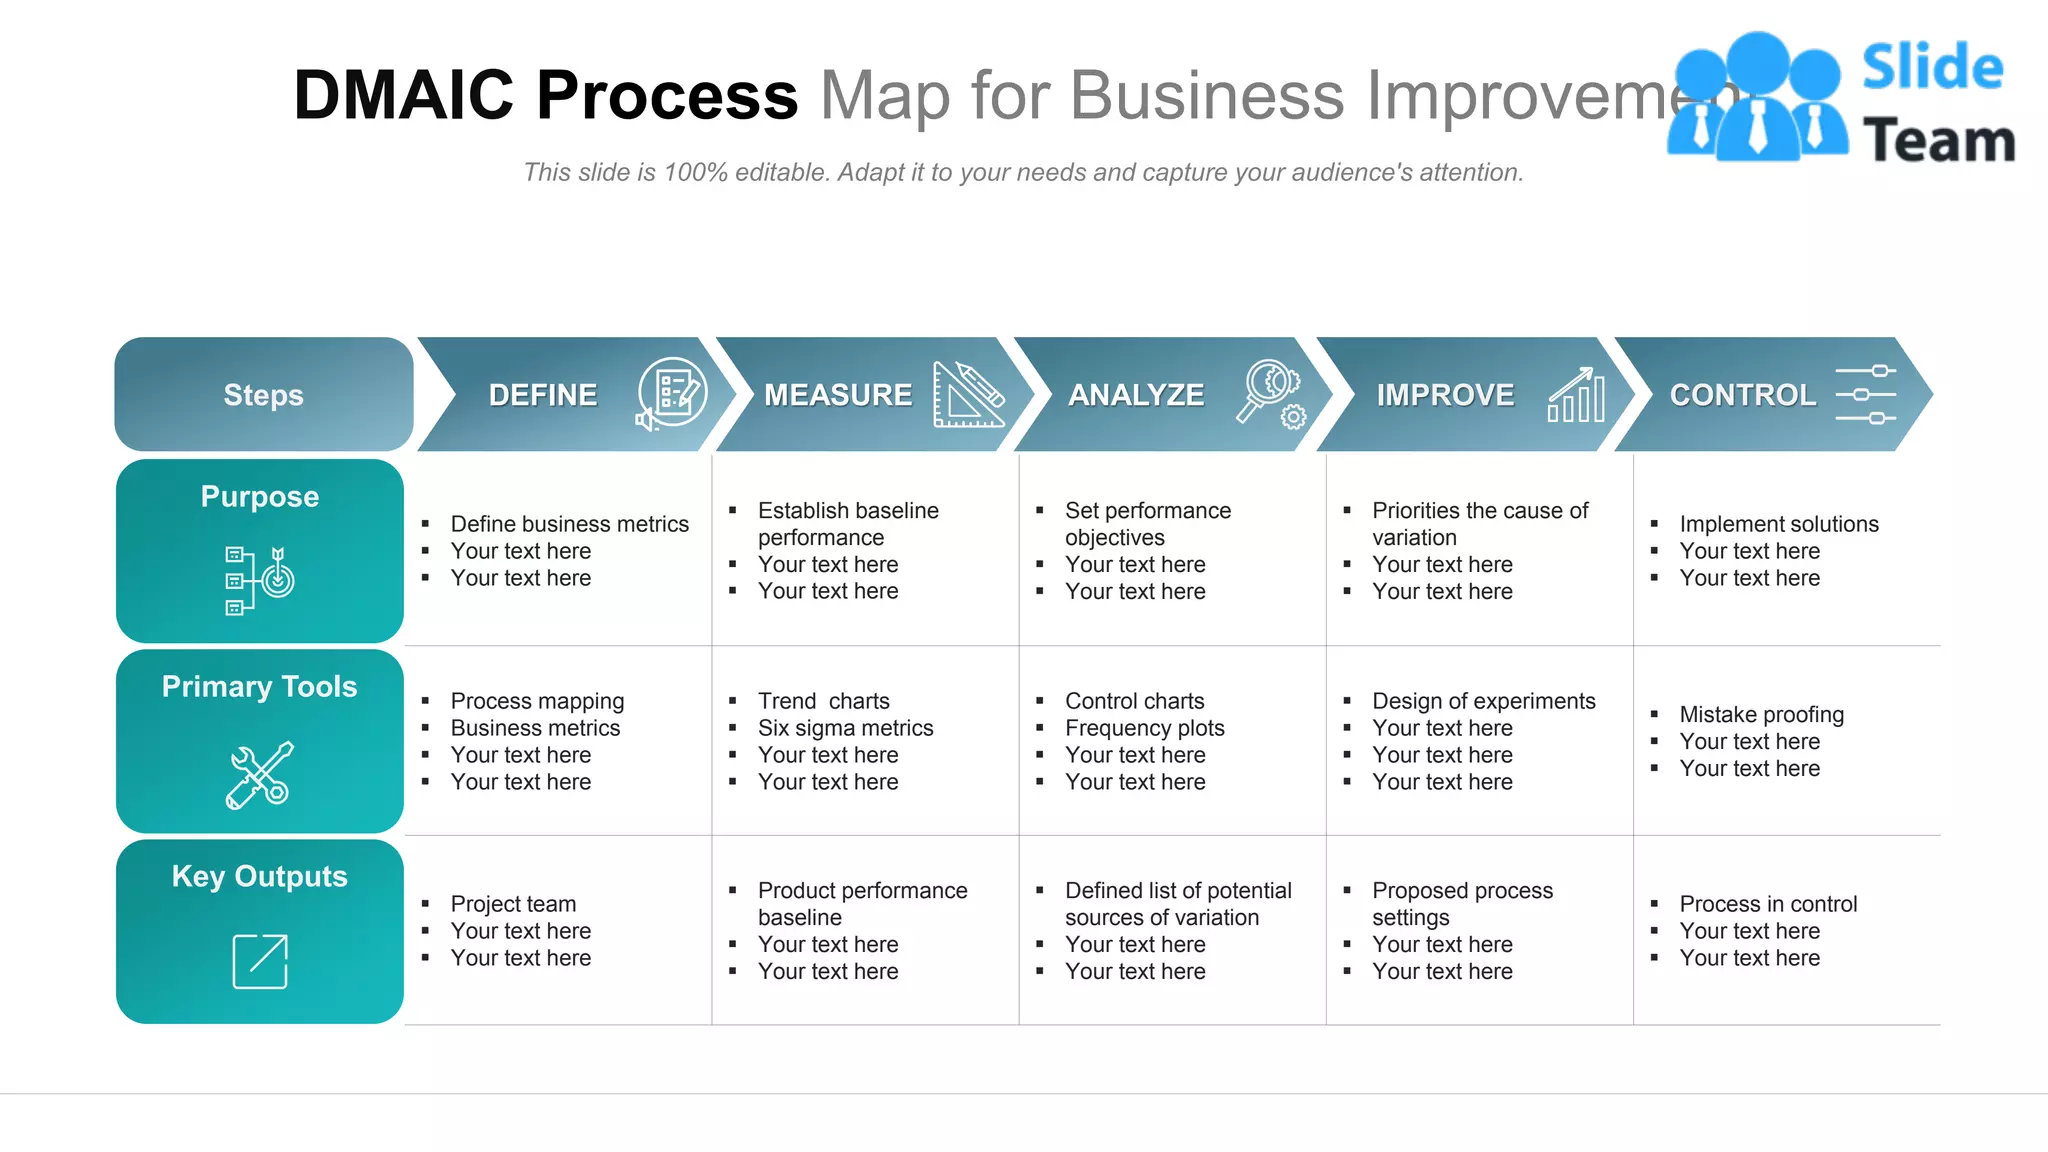

The document outlines the steps and tools for business improvement following the DMAIC process, which includes defining metrics, establishing performance baselines, and implementing solutions. It emphasizes the importance of process mapping, control charts, and trend analysis for measuring and improving performance. Additionally, it provides guidance on customizing presentation materials to effectively convey the information.


