Downloaded 388 times
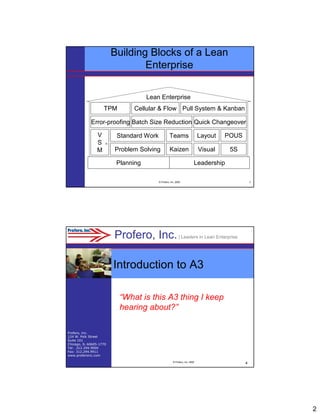
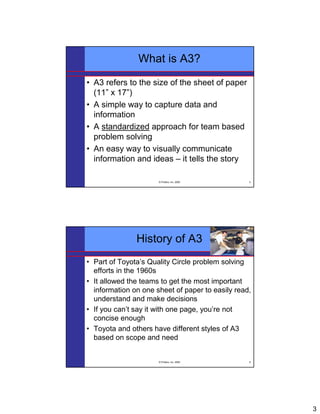


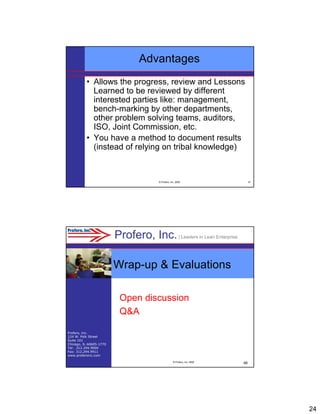

The document provides an introduction to A3 problem solving as part of lean enterprise practices, emphasizing its significance in team-based problem solving and standardized communication. Developed originally by Toyota, A3 is a structured tool used to capture and analyze information on a single page, facilitating decision-making and problem resolution. The document details the A3 process, including its history, application techniques, and the PDCA (Plan-Do-Check-Act) cycle for continuous improvement.


