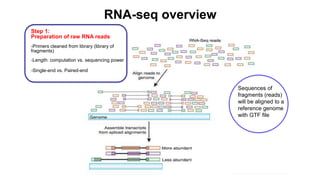
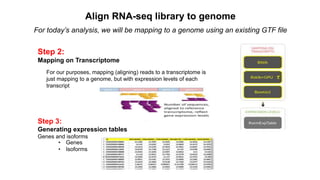
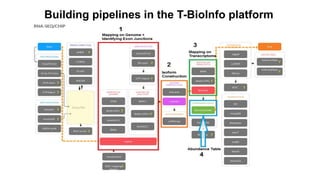
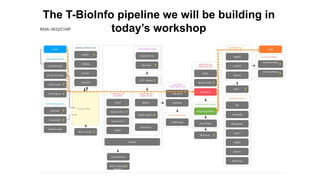
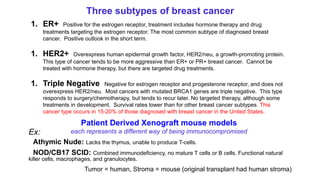
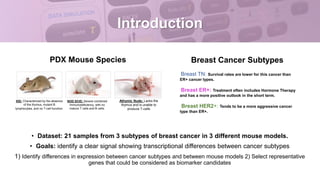
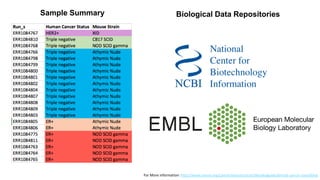
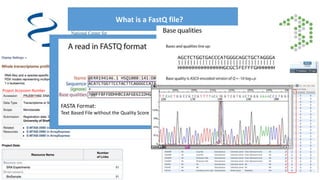
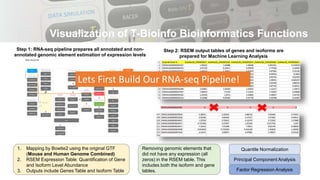
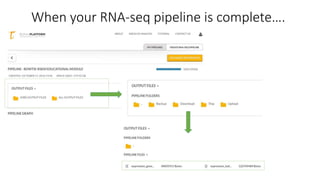
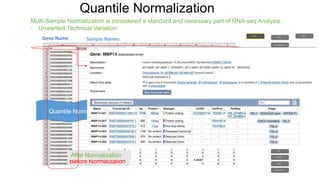
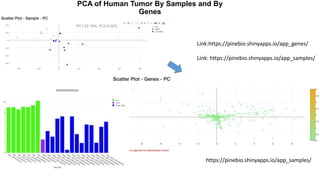
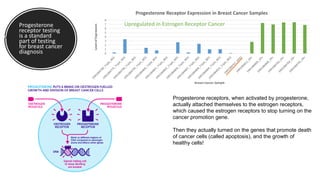
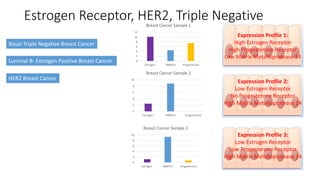
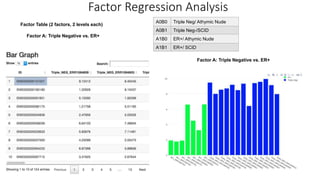
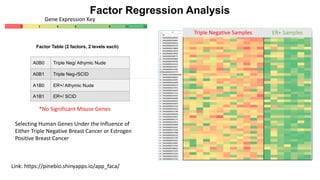
This document provides an overview of RNA-seq analysis using the T-BioInfo platform. It describes analyzing RNA-seq data from breast cancer patient-derived xenograft models to identify differences between cancer subtypes and mouse models. The analysis includes mapping reads, quantifying gene and isoform expression, normalizing data, performing PCA, and identifying biomarker genes for breast cancer subtypes using factor regression analysis. The goal is to gain insights into cancer biology and identify diagnostic or therapeutic targets.
RNA-seq is a revolutionary tool for transcriptomics that has advantages over previous methods like microarrays. It allows for single-base resolution expression profiling, detection of splicing variants and gene fusions, and can detect a wider dynamic range of expression levels. RNA-seq is being used to improve genome annotations by characterizing alternative splicing events and verifying gene boundaries. It is also useful for generating genetic resources for non-model species by performing de novo transcriptome sequencing and annotation. Additionally, RNA-seq can help advance proteomics by providing a reference database to match peptide spectra. Studies are using RNA-seq to examine spatial and temporal transcriptome landscapes in various plants.
The document describes a presentation given by Gunnar Rätsch on tools for RNA-seq analysis and isoform characterization. It discusses the increasing amounts of biological data and challenges in developing accurate analysis algorithms. The presentation covers multiple tools developed by Rätsch's group for analyzing RNA-seq data, including tools for transcript quantification, multiple read mapping, alternative splicing analysis and detection of novel isoforms. The tools aim to improve RNA-seq analysis for large datasets and characterization of transcript isoforms and splicing.
This document provides an overview of RNAseq analysis workflows. It discusses preparing raw sequencing reads, aligning reads to a reference genome or transcriptome, and using tools like Tophat and Cufflinks to assemble transcripts and quantify gene and transcript expression. Key steps include mapping reads, assembling transcripts, quantifying expression at the gene or transcript level, and using the results to identify differentially expressed genes between experimental conditions.
A workshop is intended for those who are interested in and are in the planning stages of conducting an RNA-Seq experiment. Topics to be discussed will include:
* Experimental Design of RNA-Seq experiment
* Sample preparation, best practices
* High throughput sequencing basics and choices
* Cost estimation
* Differential Gene Expression Analysis
* Data cleanup and quality assurance
* Mapping your data
* Assigning reads to genes and counting
* Analysis of differentially expressed genes
* Downstream analysis/visualizations and tables
Course: Bioinformatics for Biomedical Research (2014).
Session: 4.1- Introduction to RNA-seq and RNA-seq Data Analysis.
Statistics and Bioinformatisc Unit (UEB) & High Technology Unit (UAT) from Vall d'Hebron Research Institute (www.vhir.org), Barcelona.
AGRF in conjunction with EMBL Australia recently organised a workshop at Monash University Clayton. This workshop was targeted at beginners and biologists who are new to analysing Next-Gen Sequencing data. The workshop also aimed to provide users with a snapshot of bioinformatics and data analysis tips on how to begin to analyse project data. An introduction to RNA-seq data analysis was presented by AGRF Senior Bioinformatician Dr. Sonika Tyagi.
Presented: 1st August 2012
This document provides information about workshops on next-generation science being held at UNC Charlotte in 2014. It details the schedule, locations, instructors, and teaching assistants for Workshop 1 which will cover designing an RNA-Seq experiment, processing and visualizing the resulting data. The workshop will use a real RNA-Seq dataset from tomato pollen undergoing heat stress treatment, with the goal of understanding genes involved in pollen thermotolerance.
Abstract: The focus in this session will be put on the differences between standard DNA mapping and RNAseq-specific transcript mapping: identifying splice variants and isoforms. The issue of transcript quantification and genomic variants that can be identified from RNAseq data will be discussed.
RNA-seq: A High-resolution View of the TranscriptomeSean Davis
The molecular microscopes that we use to examine human biology have advanced significantly with the advent of next generation sequencing. RNA-seq is one application of this technology that leads to a very high-resolution view of the transcriptome. With these new technologies come increased data analysis and data handling burdens as well as the promise of new discovery. These slides present a high-level overview of the RNA-seq technology with a focus on the analysis approaches, quality control challenges, and experimental design.
RNASeq - Analysis Pipeline for Differential ExpressionJatinder Singh
RNA-Seq is a technique that uses next generation sequencing to sequence RNA transcripts and quantify gene expression levels. It can be used to estimate transcript abundance, detect alternative splicing, and compare gene expression profiles between healthy and diseased tissue. Computational challenges include read mapping due to exon-exon junctions and normalization of read counts. Key steps in RNA-Seq analysis include read mapping, transcript assembly, counting and normalizing reads, and detecting differentially expressed genes.
This document provides an overview of RNA-seq and its applications. It discusses key aspects of RNA-seq including transcriptome profiling, alignment, quantification, differential expression analysis, clustering and visualization. It also covers experimental design considerations and highlights some commonly used tools and software. The document is a comprehensive guide that describes the RNA-seq workflow and analysis from start to finish.
This session will follow up from transcript quantification of RNAseq data and discusses statistical means of identifying differentially regulated transcripts, and isoforms and contrasts these against microarray analysis approaches.
RNA sequencing: advances and opportunities Paolo Dametto
This document summarizes recent advances in transcriptome analysis technologies. It discusses limitations of microarray-based approaches and how next-generation sequencing-based RNA-seq provides more comprehensive transcriptome profiling. RNA-seq can detect thousands of new transcript variants and isoforms. It also describes direct RNA sequencing without cDNA conversion, revealing polyadenylation profiles with single-molecule resolution. Comprehensive polyadenylation maps in human and yeast showed previously unannotated sites and alternative polyadenylation, providing insights into regulatory mechanisms.
The document provides information about RNA-seq analysis using R and Bioconductor. It begins with an introduction to the BCBB branch and its services assisting researchers with bioinformatics and computational projects. The document then discusses RNA-seq, R, and Bioconductor individually before explaining how they can be used together for RNA-seq analysis. Step-by-step tutorials and resources are provided for differential expression analysis and other tasks using R packages like DESeq2.
The document discusses RNA-Seq data analysis. Some key points:
- RNA-Seq involves sequencing steady-state RNA in a sample without prior knowledge of the organism. It can uncover novel transcripts and isoforms.
- Making sense of the large and complex RNA-Seq data depends on the scientific question, such as finding transcribed SNPs for allele-specific expression or novel transcripts in cancer samples.
- Common applications of RNA-Seq include abundance estimation, alternative splicing detection, RNA editing discovery, and finding novel transcripts and isoforms.
- Analysis steps include mapping reads to a reference genome/transcriptome, generating mapping statistics and quality metrics, differential expression analysis, clustering, and pathway analysis using tools like
This document provides an overview and introduction to RNA-seq analysis using Next Generation Sequencing. It discusses the RNA-seq workflow including mapping reads with TopHat2, transcript assembly with Cufflinks, and differential expression analysis. Key points covered include the advantages of RNA-seq over microarrays, the exponential drop in sequencing costs, mapping strategies for junction reads including TopHat, and running TopHat from the command line.
Part 1 of RNA-seq for DE analysis: Defining the goalJoachim Jacob
First part of the training session 'RNA-seq for Differential expression' analysis. We explain how we can detect differential expression based on RNA-seq data. Interested in following this session? Please contact http://www.jakonix.be/contact.html
The document provides an overview of Chip-seq data analysis. It discusses the Chip-seq technology, visualization of genomic data, command line analysis including quality checking, alignment, peak calling, annotation, and motif finding. It also discusses downstream analysis such as comparing samples, analyzing region occupancy, and web resources for Chip-seq analysis.
Knowing Your NGS Upstream: Alignment and VariantsGolden Helix Inc
Alignment algorithms are not just about placing reads in best-matching locations to a reference genome. They are now being expected to handle small insertions, deletions, gapped alignment of reads across intron boundaries and even span breakpoints of structural variations, fusions and copy number changes. At the same time, variant-calling algorithms can only reach their full potential by being intimately matched to the aligner's output or by doing local assemblies themselves. Knowing when these tools can be expected to perform well and when they will produce technical artifacts or be incapable of detecting features is critical when interpreting any analysis based on their output.
This presentation will compare the performance of the alignment and variant calling tools used by sequencing service providers including Illumina Genome Network, Complete Genomics and The Broad Institute. Using public samples analyzed by each pipeline, we will look at the level of concordance and dive into investigating problematic variants and regions of the genome.
This document provides an introduction to RNA sequencing (RNA-Seq) applications using next-generation sequencing technologies. It discusses how RNA-Seq can be used to identify which genes are expressed, detect differential gene expression between samples, identify splicing isoforms, and detect genetic variants and structural variations. The document reviews Illumina sequencing by synthesis, the most common platform, outlining the work flow from sample acquisition, RNA extraction and library preparation to sequencing. It also discusses considerations for different sample types and extraction methods.
This document provides an introduction and overview of next-generation sequencing (NGS) data analysis. It discusses the bioinformatics challenges posed by large NGS datasets, including the need for powerful computing infrastructure and data storage. The document outlines common NGS data analysis workflows and applications, such as quality control, metagenomics, de novo assembly, amplicon analysis and variant detection. It also compares different NGS platforms and provides examples of software tools used in NGS data analysis.
Examining gene expression and methylation with next gen sequencingStephen Turner
Slides on RNA-seq and methylation studies using next-gen sequencing given at the University of Miami Hussman Institute for Human Genomics "Genetic Analysis of Complex Human Diseases" course in 2012 (http://hihg.med.miami.edu/educational-programs/analysis-of-complex-human-diseases/genetic-analysis-of-complex-human-diseases/)
Data Management for Quantitative Biology - Data sources (Next generation tech...QBiC_Tue
Introduction to next generation sequencing (NGS); NGS data; data management of NGS data; third generation sequencing; NGS pipelines; NGS experimental design
The document describes an analysis of RNA-seq data from 21 breast cancer samples representing 3 subtypes (TNBC, ER+, HER2+) profiled in 3 different mouse PDX models. The goals were to identify transcriptional differences between cancer subtypes and mouse models in order to select biomarker candidate genes. An overview of the RNA-seq analysis pipeline is provided, including mapping, quantification, normalization, and downstream analyses like PCA, factor regression, and tumor-stroma association studies.
The document discusses various topics related to molecular profiling and personalized medicine. It describes first generation molecular profiling techniques like gene sequencing, microarrays, and PCR. It then covers next generation sequencing technologies like Roche 454, Illumina, and ABI SOLID. It also discusses second generation techniques for DNA and RNA profiling including exome sequencing, ChIP-seq, and RNA-seq. Finally, it briefly mentions third generation sequencing and epigenetic profiling.
Genome in a bottle for ashg grc giab workshop 181016GenomeInABottle
Genome in a Bottle (GIAB) provides benchmark genomes to evaluate the accuracy of variant calling from whole genome sequencing. GIAB has characterized 7 human genomes to date, including difficult variants. The benchmark calls continue to evolve as new data and methods are integrated. While current benchmarks enable validation of "easier" variants, GIAB is working to characterize more difficult variants and regions. This will allow validation of clinical tests focused on difficult sites. GIAB data and analyses are openly available to support method development and technology optimization.
This document provides an overview of bioinformatics and computational genomics. It discusses key topics including DNA structure and function, genetic code, DNA replication, mutations, epigenetics, chromatin structure, histone modifications, DNA methylation, cancer stem cells, personalized medicine using biomarkers, and molecular profiling. The document contains diagrams explaining concepts like DNA packaging into chromatin, basic epigenetic mechanisms involving histone modifications and DNA methylation, and how epigenetic changes can alter chromatin structure and regulate gene expression.
Molecular techniques for pathology research - MDX .pdfsabyabby
This document discusses molecular techniques used in pathology research such as PCR, microarrays, next generation sequencing, immunohistochemistry, ELISA, and Western blotting. It provides details on each technique including the basic principles, applications in research, and examples of uses in studies of gene expression, cancer, bone disease, and growth retardation. The learning outcomes are to understand these techniques and their uses in basic and clinical research.
Analyzing Genomic Data with PyEnsembl and VarcodeAlex Rubinsteyn
PyEnsembl and Varcode are two new libraries being developed at Mount Sinai's Hammerlab to facilitate the analysis of genomic variants with an eye toward Pythonic interfaces, data representations, and coding conventions. PyEnsembl provides access to genomic sequence and annotation data. PyEnsembl's API consists primarily of objects such as Gene, Transcript, and Exon, along with methods for querying these objects by properties such as their chromosomal locations. PyEnsembl can be used to answer fundamental questions such as "which genes overlap a genomic location?" and "what is the nucleotide sequence of a particular transcript?". Varcode sits on top of PyEnsembl and uses it to annotate genomic mutations. Varcode can be used to quickly answer questions such as "what's the degree of overlap between two sets of mutations" and "which genes are affected by each mutation?". Additionally, Varcode can predict the altered amino acid sequence arising from a mutation, which is useful for predicting properties of the mutant protein (such as presentation to the adaptive immune system). This talk will show some basic examples of PyEnsembl and Varcode in action and give a brief glimpse of how they can be used as part of a personalized cancer vaccine pipeline.
This document summarizes the Genome in a Bottle (GIAB) project, which develops reference materials and benchmarks for evaluating human genome sequencing and variant detection. GIAB has characterized 7 human genomes to high accuracy using diverse sequencing technologies. It provides extensive public sequencing data for benchmarking along with well-characterized variants. GIAB aims to improve benchmarks for difficult variants using linked reads, long reads, and diploid genome assemblies. The project collaborates widely and its reference materials and data are openly available to support innovation in genome sequencing and analysis.
The Genome in a Bottle (GIAB) project provides reference materials and benchmarks for validating genome sequencing and variant calling. It has characterized variants in five human genomes, including common and difficult variants. While it currently enables benchmarking of easier variants, GIAB is working to characterize more difficult variants and regions. Many challenges remain in benchmarking structural variants and regions with lower confidence, and collaborations are welcome to help address these challenges.
This document summarizes the Genome in a Bottle (GIAB) Consortium's efforts to characterize structural variants in human genomes to serve as benchmarks. The GIAB Consortium has generated structural variant calls for 7 human genomes using diverse data types and analysis methods. The document describes the GIAB Consortium's process for integrating these data to identify high-confidence structural variant calls to include in version 0.6 of the structural variant benchmark set. It provides examples of different types of structural variants characterized and evaluates the trustworthiness of the benchmark calls based on independent validation. The document also discusses ongoing efforts to further improve structural variant characterization using emerging long-read technologies.
DNA microarrays allow researchers to analyze the expression levels of many genes simultaneously. They work by attaching DNA fragments from thousands of genes to a microchip, then measuring how much cDNA from a cell binds to each fragment. This reveals which genes are more or less active. The document describes how microarrays are prepared and used, and how the resulting gene expression data can help classify diseases and guide treatment. It proposes an interactive class exercise where students mimic genes on a microarray to recognize patterns in cancer patients' gene expression that could predict drug responses.
Total RNA Discovery for RNA Biomarker Development WebinarQIAGEN
Precision medicine offers to transform patient care by targeting treatment to those with most to gain. To date the most significant advances have been at the level of DNA, for example, the use of somatic DNA alterations as diagnostic indicators of disease and for prediction of pharmacodynamic response. Development of RNA expression signatures as biomarkers has been more problematic. While RNA expression analysis has yielded valuable insights into the biological mechanisms of disease, RNA is a more unstable molecule than DNA, and more easily damaged or degraded during sample collection and isolation. In addition, RNA levels are inherently dynamic and gene expression signatures are extraordinarily complex. Recently, much progress has been made in identifying key changes in gene expression in cancer and other diseases, as well as identifying expression signatures in circulating nucleic acid that have the potential to be developed into diagnostic and prognostic indicators.
The document summarizes the Genome in a Bottle (GIAB) project, which aims to develop reference materials and benchmarks for evaluating human genome sequencing. GIAB has characterized 7 human genomes to high accuracy using multiple sequencing technologies and bioinformatics analyses. The characterized genomes and variant calls are made publicly available to benchmark sequencing performance. Recently, GIAB has incorporated linked and long read sequencing to expand reference benchmarks to more difficult genomic regions and develop benchmarks for structural variants.
This document provides an overview of genomics and proteomics tools and techniques. It discusses genomics and the study of genomes, including structural and functional genomics. It also covers proteomics and the study of the proteome. The document then describes several key techniques in more detail, including DNA gel electrophoresis, polymerase chain reaction (PCR), reverse transcription PCR (RT-PCR), DNA sequencing, microarrays, enzyme-linked immunosorbent assay (ELISA), blotting techniques like Western blotting, and SDS-PAGE gel electrophoresis. It provides information on the principles, applications, and procedures for each technique.
Systems biology aims to understand biological processes through modeling dynamic networks representing interactions between components. It analyzes multi-omics data from projects like TCGA using bioinformatics tools. TCGA collected genomic data from thousands of cancer patients across 20 tumor types to identify common pathways. Combinatorial Adaptive Resistance Therapy aims to target upregulated survival pathways and downregulated cell death pathways that cause adaptive resistance to targeted agents through rational drug combinations. Future strategies will use deep profiling of patients to define molecularly targeted drug cocktails and adapt therapies based on longitudinal molecular monitoring.
Course: Bioinformatics for Biomedical Research (2014).
Session: 2.1.2- Next Generation Sequencing. Technologies and Applications. Part II: NGS Applications I.
Statistics and Bioinformatisc Unit (UEB) & High Technology Unit (UAT) from Vall d'Hebron Research Institute (www.vhir.org), Barcelona.
whole genome analysis
history
needs
steps involved
human genome data
NGS
pyrosequencing
illumina
SOLiD
Ion torrent
PacBio
applications
problems
benefits
This document discusses Polymerase Chain Reaction (PCR), including its history, components, process, applications, advantages, and disadvantages. PCR was developed in 1983 by Kary Mullis and allows amplification of specific DNA sequences. It involves cycling between heating and cooling steps to denature and extend DNA using DNA polymerase. Key applications of PCR include detecting infectious diseases, genetic testing, forensics, cancer diagnostics, and cloning.
As increasing numbers of people choose to have their genomes sequenced and made available for research, more genomic data is available for analysis by machine learning approaches. Single Nucleotide Polymorphisms (SNPs) are known to be a major factor influencing many physical traits, diseases and other phenotypes. Using publicly available data and tools we predict phenotype from genotype using SNP data (1 to 2 million SNPs). We utilize data analysis and machine learning approaches only, no domain knowledge, so that our automated approach may be generally used to predict different phenotypes from genotype. In the first application of our method we predicted eye color with 87% accuracy.
Now a day’s, pharma research is facing challenges in
deciphering molecular understanding of disease initiation,
progress and establishment as well as performance
assessment of drug molecule on such phases of disease
development. Emerging of next generation sequencing
bases molecular tools were found to be a key method for
creating genome wide genomics landscape of gene
mutations, gene expression and gene regulation events.
Although NGS is a powerful tool for molecular research but
same time it have its own technical challenges. Few major
challenges of NGS based pharmacogenomics is
summarized below
Global Situational Awareness of A.I. and where its headedvikram sood
You can see the future first in San Francisco.
Over the past year, the talk of the town has shifted from $10 billion compute clusters to $100 billion clusters to trillion-dollar clusters. Every six months another zero is added to the boardroom plans. Behind the scenes, there’s a fierce scramble to secure every power contract still available for the rest of the decade, every voltage transformer that can possibly be procured. American big business is gearing up to pour trillions of dollars into a long-unseen mobilization of American industrial might. By the end of the decade, American electricity production will have grown tens of percent; from the shale fields of Pennsylvania to the solar farms of Nevada, hundreds of millions of GPUs will hum.
The AGI race has begun. We are building machines that can think and reason. By 2025/26, these machines will outpace college graduates. By the end of the decade, they will be smarter than you or I; we will have superintelligence, in the true sense of the word. Along the way, national security forces not seen in half a century will be un-leashed, and before long, The Project will be on. If we’re lucky, we’ll be in an all-out race with the CCP; if we’re unlucky, an all-out war.
Everyone is now talking about AI, but few have the faintest glimmer of what is about to hit them. Nvidia analysts still think 2024 might be close to the peak. Mainstream pundits are stuck on the wilful blindness of “it’s just predicting the next word”. They see only hype and business-as-usual; at most they entertain another internet-scale technological change.
Before long, the world will wake up. But right now, there are perhaps a few hundred people, most of them in San Francisco and the AI labs, that have situational awareness. Through whatever peculiar forces of fate, I have found myself amongst them. A few years ago, these people were derided as crazy—but they trusted the trendlines, which allowed them to correctly predict the AI advances of the past few years. Whether these people are also right about the next few years remains to be seen. But these are very smart people—the smartest people I have ever met—and they are the ones building this technology. Perhaps they will be an odd footnote in history, or perhaps they will go down in history like Szilard and Oppenheimer and Teller. If they are seeing the future even close to correctly, we are in for a wild ride.
Let me tell you what we see.
The Ipsos - AI - Monitor 2024 Report.pdfSocial Samosa
According to Ipsos AI Monitor's 2024 report, 65% Indians said that products and services using AI have profoundly changed their daily life in the past 3-5 years.
The Building Blocks of QuestDB, a Time Series Databasejavier ramirez
Talk Delivered at Valencia Codes Meetup 2024-06.
Traditionally, databases have treated timestamps just as another data type. However, when performing real-time analytics, timestamps should be first class citizens and we need rich time semantics to get the most out of our data. We also need to deal with ever growing datasets while keeping performant, which is as fun as it sounds.
It is no wonder time-series databases are now more popular than ever before. Join me in this session to learn about the internal architecture and building blocks of QuestDB, an open source time-series database designed for speed. We will also review a history of some of the changes we have gone over the past two years to deal with late and unordered data, non-blocking writes, read-replicas, or faster batch ingestion.
Enhanced Enterprise Intelligence with your personal AI Data Copilot.pdfGetInData
Recently we have observed the rise of open-source Large Language Models (LLMs) that are community-driven or developed by the AI market leaders, such as Meta (Llama3), Databricks (DBRX) and Snowflake (Arctic). On the other hand, there is a growth in interest in specialized, carefully fine-tuned yet relatively small models that can efficiently assist programmers in day-to-day tasks. Finally, Retrieval-Augmented Generation (RAG) architectures have gained a lot of traction as the preferred approach for LLMs context and prompt augmentation for building conversational SQL data copilots, code copilots and chatbots.
In this presentation, we will show how we built upon these three concepts a robust Data Copilot that can help to democratize access to company data assets and boost performance of everyone working with data platforms.
Why do we need yet another (open-source ) Copilot?
How can we build one?
Architecture and evaluation
STATATHON: Unleashing the Power of Statistics in a 48-Hour Knowledge Extravag...sameer shah
"Join us for STATATHON, a dynamic 2-day event dedicated to exploring statistical knowledge and its real-world applications. From theory to practice, participants engage in intensive learning sessions, workshops, and challenges, fostering a deeper understanding of statistical methodologies and their significance in various fields."
2. RNA-seq: whole transcriptome analysis
Noncoding RNA:
RNA functions directly, based on its own
shape
Messenger RNA:
Codes for proteins, which function based
on their shape
Types of noncoding RNA:
• tRNA (transfer RNA)
• rRNA (ribosomal RNA)
• ribozymes (RNA enzymes)
• miRNA (micro RNA)
• snRNA (small nuclear RNA)
• siRNA (small interfering RNA)
• piRNA (Piwi-interacting RNA)
• Xist
• Many more
3. Exons, introns, and isoforms from NGS data
Alternative splicing can generate different isoforms from the same
RNA gene product:
* Noncoding RNAs can have introns, too! Examples: Xist, HOTAIR, other lincRNAs
4. Why do a whole transcriptome analysis?
• Unknown disease correlations
Finding what you’re looking for when you don’t know exactly what you are
looking for. “Hypothesis Free Approach”
Example: 70% treatment efficacy = 30% poor response/no response
–Whole transcriptome analysis- compare responders and non-responders
–Computer can identify differences, even in the absence of a hypothesis
–Computer can present unexpected results that a researcher would not look for
due to preconceptions about the disease biology
• Disease correlations with post-transcription events
e.g. gene fusions and alternative splicing
• Species without a reference genome (GTF)
unsequenced species, poorly annotated genome, environmental sequencing
• Power: can outperform microarrays
5. Microarray vs. RNA-seq
Microarrays: can only detect sequences the
array was designed to detect (must know in
advance what to put on the chip)
Certain analyses not possible with
microarray, such as:
• Distinguish mature mRNA from unspliced
RNA, as well as different isoforms/splice
variants
• Strandedness
• Single cell analysis
RNA-seq: "fuzzy" overview; facilitates novel
transcript discovery
RNA-seq lends itself to further and
confirmatory analyses
Lower error rate + problems like cross-
hybridization avoided in RNA-seq
6. NGS
Steps:
1.fragment RNA
2.reverse transcribe => cDNA
3.High-throughput sequencing
Length: Long = more information
but more errors + expensive
Variety of machines:
-choose based on experimental
design and cost
-output: 7.5 Gb to 1800 Gb
-max reads/run: 25 million to 6
billion
-max read length: 2 x 150bp to 2
x 300 bp
7. RNA-seq overview
de novo
Step 1:
Preparation of raw RNA reads
-Primers cleaned from library (library of
fragments)
-Length: computation vs. sequencing power
-Single-end vs. Paired-end
Sequences of
fragments (reads)
will be aligned to a
reference genome
with GTF file
8. Align RNA-seq library to genome
For today’s analysis, we will be mapping to a genome using an existing GTF file
• Genes
• Isoforms
Step 2:
Mapping on Transcriptome
Step 3:
Generating expression tables
Genes and isoforms
For our purposes, mapping (aligning) reads to a transcriptome is
just mapping to a genome, but with expression levels of each
transcript
11. So, the pipeline will give us a table of transcripts.
Now what?
• Normalization: Methods for overcoming variance due to
technical issues or other issues not related to the experiment
• Post-processing:
• Principal Component Analysis (PCA): provides visual overview
of the data
• Statistical analysis (e.g. T-test)
• Machine learning techniques
• Biological interpretation of results: use databases to find out
more about the identified genes, e.g. publications,
correlations
12. Output you will
see (Excel table):
First two components
(“principle components”)
can be plotted on a 2D
graph to detect clustering:
“Shadow” (does not
show the whole picture)
Benchmark: 40% of variability
PCA
Dimension reduction technique for reducing a lot of data into a subset that captures the essence
of the original data.
13. A brief explanation of machine learning
Using a training set to teach a computer to categorize
Duck vs. Not Duck:
14. Three subtypes of breast cancer
1. ER+ Positive for the estrogen receptor, treatment includes hormone therapy and drug
treatments targeting the estrogen receptor. The most common subtype of diagnosed breast
cancer. Positive outlook in the short term.
1. HER2+ Overexpress human epidermal growth factor, HER2/neu, a growth-promoting protein.
This type of cancer tends to be more aggressive than ER+ or PR+ breast cancer. Cannot be
treated with hormone therapy, but there are targeted drug treatments.
1. Triple Negative Negative for estrogen receptor and progesterone receptor, and does not
overexpress HER2/neu. Most cancers with mutated BRCA1 genes are triple negative. This type
responds to surgery/chemotherapy, but tends to recur later. No targeted therapy, although some
treatments in development. Survival rates lower than for other breast cancer subtypes. This
cancer type occurs in 15-20% of those diagnosed with breast cancer in the United States.
Patient Derived Xenograft mouse models
each represents a different way of being immunocompromisedEx:
Athymic Nude: Lacks the thymus, unable to produce T-cells.
NOD/CB17 SCID: Combined immunodeficiency, no mature T cells or B cells. Functional natural
killer cells, macrophages, and granulocytes.
Tumor = human, Stroma = mouse (original transplant had human stroma)
15. Whole Transcriptome Profiling of
Cancer Tumors in Mouse PDX Models
http://www.impactjournals.com/oncotarget/index.php?journal=oncotarget&page=article&op=view&path%5B%5D=80
14
Based on breast cancer samples taken from the publication “Whole transcriptome profiling
of patient-derived xenograft models as a tool to identify both tumor and stromal specific
biomarkers” (James R. Bradford et. al.; DOI: 10.18632/oncotarget.8014)
16. Introduction
• Dataset: 21 samples from 3 subtypes of breast cancer in 3 different mouse models.
• Goals: identify a clear signal showing transcriptional differences between cancer subtypes
1) Identify differences in expression between cancer subtypes and between mouse models 2) Select representative
genes that could be considered as biomarker candidates
PDX Mouse Species
XID: Characterized by the absence
of the thymus, mutant B
lymphocytes, and no T-cell function.
NOD SCID: Severe combined
immunodeficiency, with no
mature T cells and B cells.
Athymic Nude: Lacks the
thymus and is unable to
produce T-cells
Breast TN: Survival rates are lower for this cancer than
ER+ cancer types.
Breast ER+: Treatment often includes Hormone Therapy
and has a more positive outlook in the short term.
Breast HER2+: Tends to be a more aggressive cancer
type than ER+.
Breast Cancer Subtypes
17. Sample Summary
For More information: http://www.cancer.org/cancer/breastcancer/detailedguide/breast-cancer-classifying
Biological Data Repositories
18. What is a FastQ file?
Project Accession Number
FASTA Format:
Text Based File without the Quality Score
19. Step 1: RNA-seq pipeline prepares all annotated and non-
annotated genomic element estimation of expression levels
Removing genomic elements that
did not have any expression (all
zeros) in the RSEM table. This
includes both the isoform and gene
tables.
Quantile Normalization
Principal Component Analysis
Step 2: RSEM output tables of genes and isoforms are
prepared for Machine Learning Analysis
1. Mapping by Bowtie2 using the original GTF
(Mouse and Human Genome Combined)
2. RSEM Expression Table: Quantification of Gene
and Isoform Level Abundance
3. Outputs include Genes Table and Isoform Table Factor Regression Analysis
Visualization of T-Bioinfo Bioinformatics Functions
Lets First Build Our RNA-seq Pipeline!
21. Quantile Normalization
Before Normalization
After Normalization
Gene Name Sample Names
Multi-Sample Normalization is considered a standard and necessary part of RNA-seq Analysis.
- Unwanted Technical Variation
Quantile Normalization
23. Now back to the T-BioInfo Platform!
1. Start a PCA Pipeline
2. Create a Scatter Plot Image from our Results
3. Utilize DAVID and ENSEMBL to investigate Biological Meaning
4. Learn about other Machine Learning Methods
5. Understand a “real” RNA-seq project timeline
T-Bio.Info Platform: http://tbioinfopb1.pine-biotech.com:3000
24. PCA of Human Tumor By Samples and By
Genes
Link:https://pinebio.shinyapps.io/app_genes/
Link: https://pinebio.shinyapps.io/app_samples/
https://pinebio.shinyapps.io/app_samples/
PC1:22.16%, PC2:9.22%
25. • Extracellular
Matrix
Remodeling
• Cell
Migration
• Tumor
Growth
• Angiogenesis
0
2
4
6
8
10
12
LevelofExpression
Breast Cancer Samples
Matrix Metalloprotease 14 Expression in Breast Cancer Samples
Upregulated in Triple Negative Cancer Samples
Defining the Breast Cancer Subtypes
26. • Estrogen
Regulated
Proteins
• Oncogenic
• Bone
Metastasis
TFF3 is a promoter of angiogenesis in Breast
Cancer . This protein is secreted from
mammary carcinoma cells to promote
angiogenesis
TFF3 also promotes angiogenesis by direct
functional effects on endothelial cellular
processes promoting angiogenesis.
TFF3 stimulates angiogenesis to co-
coordinate with the growth promoting and
metastatic actions of TFF3 in mammary
carcinoma to enhance tumor progression
and dissemination.
0
2
4
6
8
10
12
LevelOfExpression
Breast Cancer Samples
Trefoil Factor 3 in Breast Cancer
27. Upregulated in Estrogen Receptor + Samples
Significance of Hormones to Breast Cancer- Endocrine Therapy
0
2
4
6
8
10
12
LevelOfExpression
Breast Cancer Samples
Estrogen Receptor Expression in Breast Cancer Samples
Estrogen
Stimulates the
cell
proliferation
of the Breast
cancer cell
28. Progesterone
receptor testing
is a standard
part of testing
for breast cancer
diagnosis 0
1
2
3
4
5
6
7
8
LevelofExpression
Breast Cancer Sample
Progesterone Receptor Expression in Breast Cancer Samples
Progesterone receptors, when activated by progesterone,
actually attached themselves to the estrogen receptors,
which caused the estrogen receptors to stop turning on the
cancer promotion gene.
Then they actually turned on the genes that promote death
of cancer cells (called apoptosis), and the growth of
healthy cells!
Upregulated in Estrogen Receptor Cancer
29. Estrogen Receptor, HER2, Triple Negative
Expression Profile 1:
High Estrogen Receptor
High Progesterone Receptor
Low Matrix Metalloprotease 14
Expression Profile 2:
Low Estrogen Receptor
No Progesterone Receptor
High Matrix Metalloprotease 14
Expression Profile 3:
Low Estrogen Receptor
Low Progesterone Receptor
High Matrix Metalloprotease 14
HER2 Breast Cancer
Luminal B- Estrogen Positive Breast Cancer
Basal-Triple Negative Breast Cancer
0
2
4
6
8
10
12
Estrogen MMP14 Progesterone
Breast Cancer Sample 1
0
2
4
6
8
10
Estrogen MMP14 Progesterone
Breast Cancer Sample 3
0
2
4
6
8
10
Estrogen MMP14 Progesterone
Breast Cancer Sample 2
31. RNA-Seq Experiment Overview
Based on Breast Cancer Samples taken from the publication “Whole transcriptome profiling of patient-derived xenograft models
as a tool to identify both tumor and stromal specific biomarkers” (James R. Bradford et. al.; DOI: 10.18632/oncotarget.8014)
HER2 ER+TNBC
NOD SCID XID Athymic CB17 SCID
1. Ribosomal Depleted RNA
2. Fragment RNA
3. TruSeq RNA Sample
Preparation Kit
4. Concatenated Genome
(Mouse/Human)
5. Indexed with star align
Secondary Analysis
Tertiary Analysis
Gene Summary and Ontology Report
1. Mapping using TopHat
2. Finding Isoforms using Cufflinks
3. GTF file of isoforms using Cuffmerge
4. Mapping Bowtie-2t on new transcriptome
Cancer Subtypes
Mouse Species
32. Thanks for Listening!
Any Questions?
Contact: Info@pine-biotech.com
T-Bioinfo Platform : http://tbioinfopb1.pine-biotech.com:3000
Pine Biotech Website: http://pine-biotech.com
Pine Biotech Education Website: http://edu.t-bio.info
33. Factor Regression Analysis
A0B0 Triple Neg/ Athymic Nude
A0B1 Triple Neg-/SCID
A1B0 ER+/ Athymic Nude
A1B1 ER+/ SCID
Factor Table (2 factors, 2 levels each)
Triple Negative Samples ER+ Samples
Selecting Human Genes Under the Influence of
Either Triple Negative Breast Cancer or Estrogen
Positive Breast Cancer
Gene Expression Key
*No Significant Mouse Genes
Link: https://pinebio.shinyapps.io/app_faca/