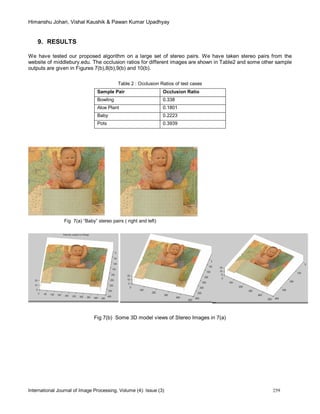
The document presents a method for developing a 3D viewing model from a pair of 2D stereo images by implementing local matching techniques to calculate horizontal disparities and occlusion ratios. It discusses challenges in disparity estimation and describes a novel approach that includes image segmentation, noise reduction, and depth calculation to enhance the quality of the final 3D model output. The results show effective transformations of stereo images into 3D models, with measured occlusion ratios for various test cases.
![Himanshu Johari, Vishal Kaushik & Pawan Kumar Upadhyay
International Journal of Image Processing, Volume (4): Issue (3) 252
We then assign a disparity plane to each segment by associating a segment with the median value of the
disparity values of the pixels associated with it. The disparity that we get at this step filters out most of the noise
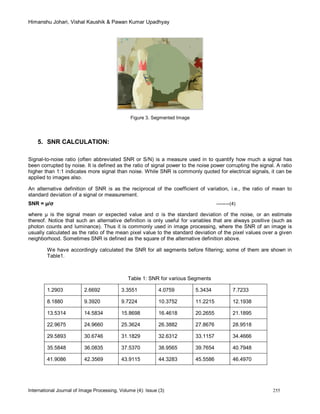
that might hamper the performance of our final output i.e. the 3D model.
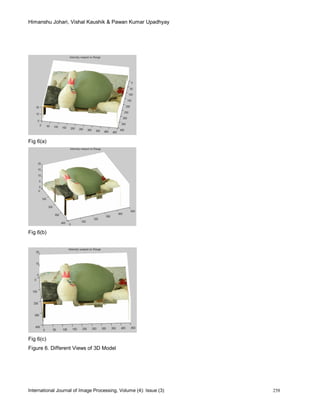
The disparity plot on a 3D mesh gives a pretty fair idea of the relative positions of the various objects in the
images; But to improve the user understandability we try to regain the lost characteristics of the image by
warping the intensity color values of the image on the disparity and plotting it on a 3D view. All the steps will be
explained separately in the course of the paper.
The output we present in our paper should however, not be compared to outputs generated by more than two
stereo images because of mainly two reasons :
i. A large portion of the 3D model remains occluded as we cannot estimate the shape or characteristics of
the occluded portions.
ii. A complete 3D model cannot be generated without having covered all faces of any object, which requires
a minimum of three cameras.
The idea can however be modified and improvised further to generate a complete 3D model provided we have
the complete data set. We in this paper try to analyze the feasibility of our proposed method of generating a 3D
model from a stereo pair.
2. LOCAL MATCHING IN PIXEL DOMAIN
2.1 Cost Estimation
Local matching requires to define a matching score and an aggregation window. The most common dissimilarity
measures are squared intensity differences (SD) and absolute intensity differences (AD) that are strictly
assuming the constant color constraint. Other matching scores such as gradient-based and non-parametric
measures are more robust to changes in camera gain. In our approach[1] we are using a self-adapting
dissimilarity measure that combines sum of absolute intensity differences (SAD) and a gradient based measure
that are defined as follows:
-------(1)
And
|+
-----(2)
where N(x, y) is a 3 × 3 surrounding window at position (x, y), Nx(x, y) a surrounding window without the rightmost
column, Ny(x, y) a surrounding window without the lowest row, rx the forward gradient to the right and ry the
forward gradient to the bottom. Color images are taken into account by summing up the dissimilarity measures
for all channels.
An optimal weighting between CSAD and CGRAD is determined by maximizing the number of reliable
correspondences that are filtered out by applying a cross-checking test (comparing left-to-right and right-to-left
disparity maps) in conjunction with a winner-take-all optimization (choosing the disparity with the lowest matching
cost). The resulting dissimilarity measure is given by:
--------(3)](https://image.slidesharecdn.com/ijip196-160214150440/85/Developing-3D-Viewing-Model-from-2D-Stereo-Pair-with-its-Occlusion-Ratio-2-320.jpg)
![Himanshu Johari, Vishal Kaushik & Pawan Kumar Upadhyay
International Journal of Image Processing, Volume (4): Issue (3) 253
Though this is a simple and robust method there are now better enhanced methods of matching like MACO.[8]. A
comparison between various feature extraction and recognition can be studied and appropriately used [9].
2.2 Horizontal Disparity Calculation
Using the method of cost estimation as explained above we calculate the disparity values for every pixel by
subtracting the positions of correspondingly matched pixels in the two images. We assume a case of zero
horizontal disparity throughout the course of our paper. To improvise on the results obtained we repeat the above
step twice, firstly keeping the right image at the base and sliding the left image over it and vice versa the second
time. The minimum among the two disparity values for every pixel is considered as the final disparity value for
that corresponding pixel.
Figure 1, precisely shows our result of horizontal disparity calculation for a given test case of images.
Figure1. Disparity Map
3. OCCLUSION ESTIMATION
As discussed earlier one of the major challenges in generating a 3D model lies in handling occlusion. We in our
paper have used a simplistic method to show the half occluded regions i.e. those regions which do not have a
corresponding match in the other image.
This method uses the disparity maps generated by the two iterations discussed in the Chapter 2.2. The disparity
maps are subjected to scaling (to optimize our results ) and appropriate thresh holding is done to uniquely
identify the occluded protions.
The extent of half occlusion can be estimated by the absolute occlusion ratio, which is given as :
Aocc. = Nocc / (x * y)
Here, Nocc is the total number occluded pixels and ‘x’ and ‘y’ represent the dimension of the image matrix. The
multiplication of the x and y dimensions of the matrix give us the total number of pixels in the image. Figure 3,
shows the identified half occluded regions. The portions in black are the identified occluded pixels.](https://image.slidesharecdn.com/ijip196-160214150440/85/Developing-3D-Viewing-Model-from-2D-Stereo-Pair-with-its-Occlusion-Ratio-3-320.jpg)
![Himanshu Johari, Vishal Kaushik & Pawan Kumar Upadhyay
International Journal of Image Processing, Volume (4): Issue (3) 254
Figure 2. Occluded Regions
4. COLOUR SEGEMENTATION
a. Adaptive Mean Shift Segmentation and Edge detection
There are many ways of segmenting an image in an like Colour Histograms[7], JND histograms[6] etc. In our
color image segmentation algorithm a five-dimensional feature space was used [2]. The color space was
employed since its metric is a satisfactory approximation to Euclidean, thus allowing the use of spherical
windows. The remaining two dimensions were the lattice coordinates. A cluster in this 5D feature space thus
contains pixels which are not only similar in color but also contiguous in the image.
The quality of segmentation is controlled by the spatial hs, and the color hr, resolution parameters defining the
radii of the (3D/2D) windows in the respective domains. The segmentation algorithm has two major steps. First,
the image is filtered using mean shift in 5D, replacing the value of each pixel with the 3D (color) component of
the
5D mode it is associated to. Note that the filtering is discontinuity preserving. In the second step, the basins of
attraction of the modes, located within -'9;:_< in the color space are recursively fused until convergence. The
resulting large basins of attraction are the delineated regions, and the value of all the pixels within are set to their
average. See [3] and [4] for a complete description and numerous examples of the segmentation algorithm. It is
important to emphasize that the segmenter processes gray level and color images in the same way. The only
difference is that in the former case the feature space has three dimensions, the gray value and the lattice
coordinates.
The mean shift based color image segmentation is already popular in the computer vision community and
several
implementations exist. Along with image segmentation the open source EDISON we have used also does
gradient based edge detection in the image. However, using the gradient magnitude for decisions causes a well
known deficiency, sharp edges with small magnitudes can be detected only at the expense of allowing a large
amount of edge clutter. A recently proposed generalization of the gradient based edge detection procedure
eliminates this trade-off [5].
The result for the above mentioned process is shown in Figure 3. The code was written in MATLAB and the
functions of C++ EDISON code were called using a MEX file.](https://image.slidesharecdn.com/ijip196-160214150440/85/Developing-3D-Viewing-Model-from-2D-Stereo-Pair-with-its-Occlusion-Ratio-4-320.jpg)


![Himanshu Johari, Vishal Kaushik & Pawan Kumar Upadhyay
International Journal of Image Processing, Volume (4): Issue (3) 262
11.REFERENCES
FOR JOURNALS:
[1] Andreas Klaus, Mario Sormann and Konrad Karner : Segment Based Stereo Matching using Belief Propagation and Self
Adapting Dissimilarity Measure, VRVis Research Center, 8010 Graz, Austria, 2006.
[2] Christopher M. Christoudias, Bogdan Georgescu and Peter Meer : Synergism in Low Level Vision, Rutgers University,
2002.
[3] D. Comaniciu and P. Meer. Mean shift analysis and applications. In 7
th
international Conference on computer vision,
pages 1197-1203, Kerkyra, Greece, September 1999.
[4] D. Comaniciu and P. Meer. Mean shift:A robust approach toward feature space analysis. IEEE Trans, Pattern Anal,
Machine Intell,24,May 2002.
[5] T. Pavlidis and Y. T. Liow. Integrating region growing and edge detection. IEEE Trans. Pattern Anal. Machine Intell.,
12:225–233, 1990.
[6] Kishore Bhoyar and Omprakash Kadke, Color Image Segmentation Based On JND Color Histogram, International
Journal of Image Processing(IJIP), Volume(3), Issue(6), 2010
[7] M.Swain and D. Ballard,”Color indexing”, International Journal of Computer Vision, Vol.7, no.1,1991.
[8] XiaoNian Wang and Ping Jiang, “Multiple Ant Colony Optimizations for Stereo Matching”, International Journal of
Image Processing(IJIP), Volume(3), Issue(5), 2010
[9] Luo Juan and Oubong Gwun, “A Comparison of SIFT, PCA-SIFT and SURF” International Journal of Image
Processing(IJIP), Volume(3), Issue(5), 2010
FOR CONFERENCES:
[10] D. Comaniciu and P. Meer. Mean shift analysis and applications. In 7
th
international Conference on computer vision,
Kerkyra, Greece, September 1999.
FOR BOOKS:
Gonzaleez and Woods, Digital Image Processing](https://image.slidesharecdn.com/ijip196-160214150440/85/Developing-3D-Viewing-Model-from-2D-Stereo-Pair-with-its-Occlusion-Ratio-12-320.jpg)