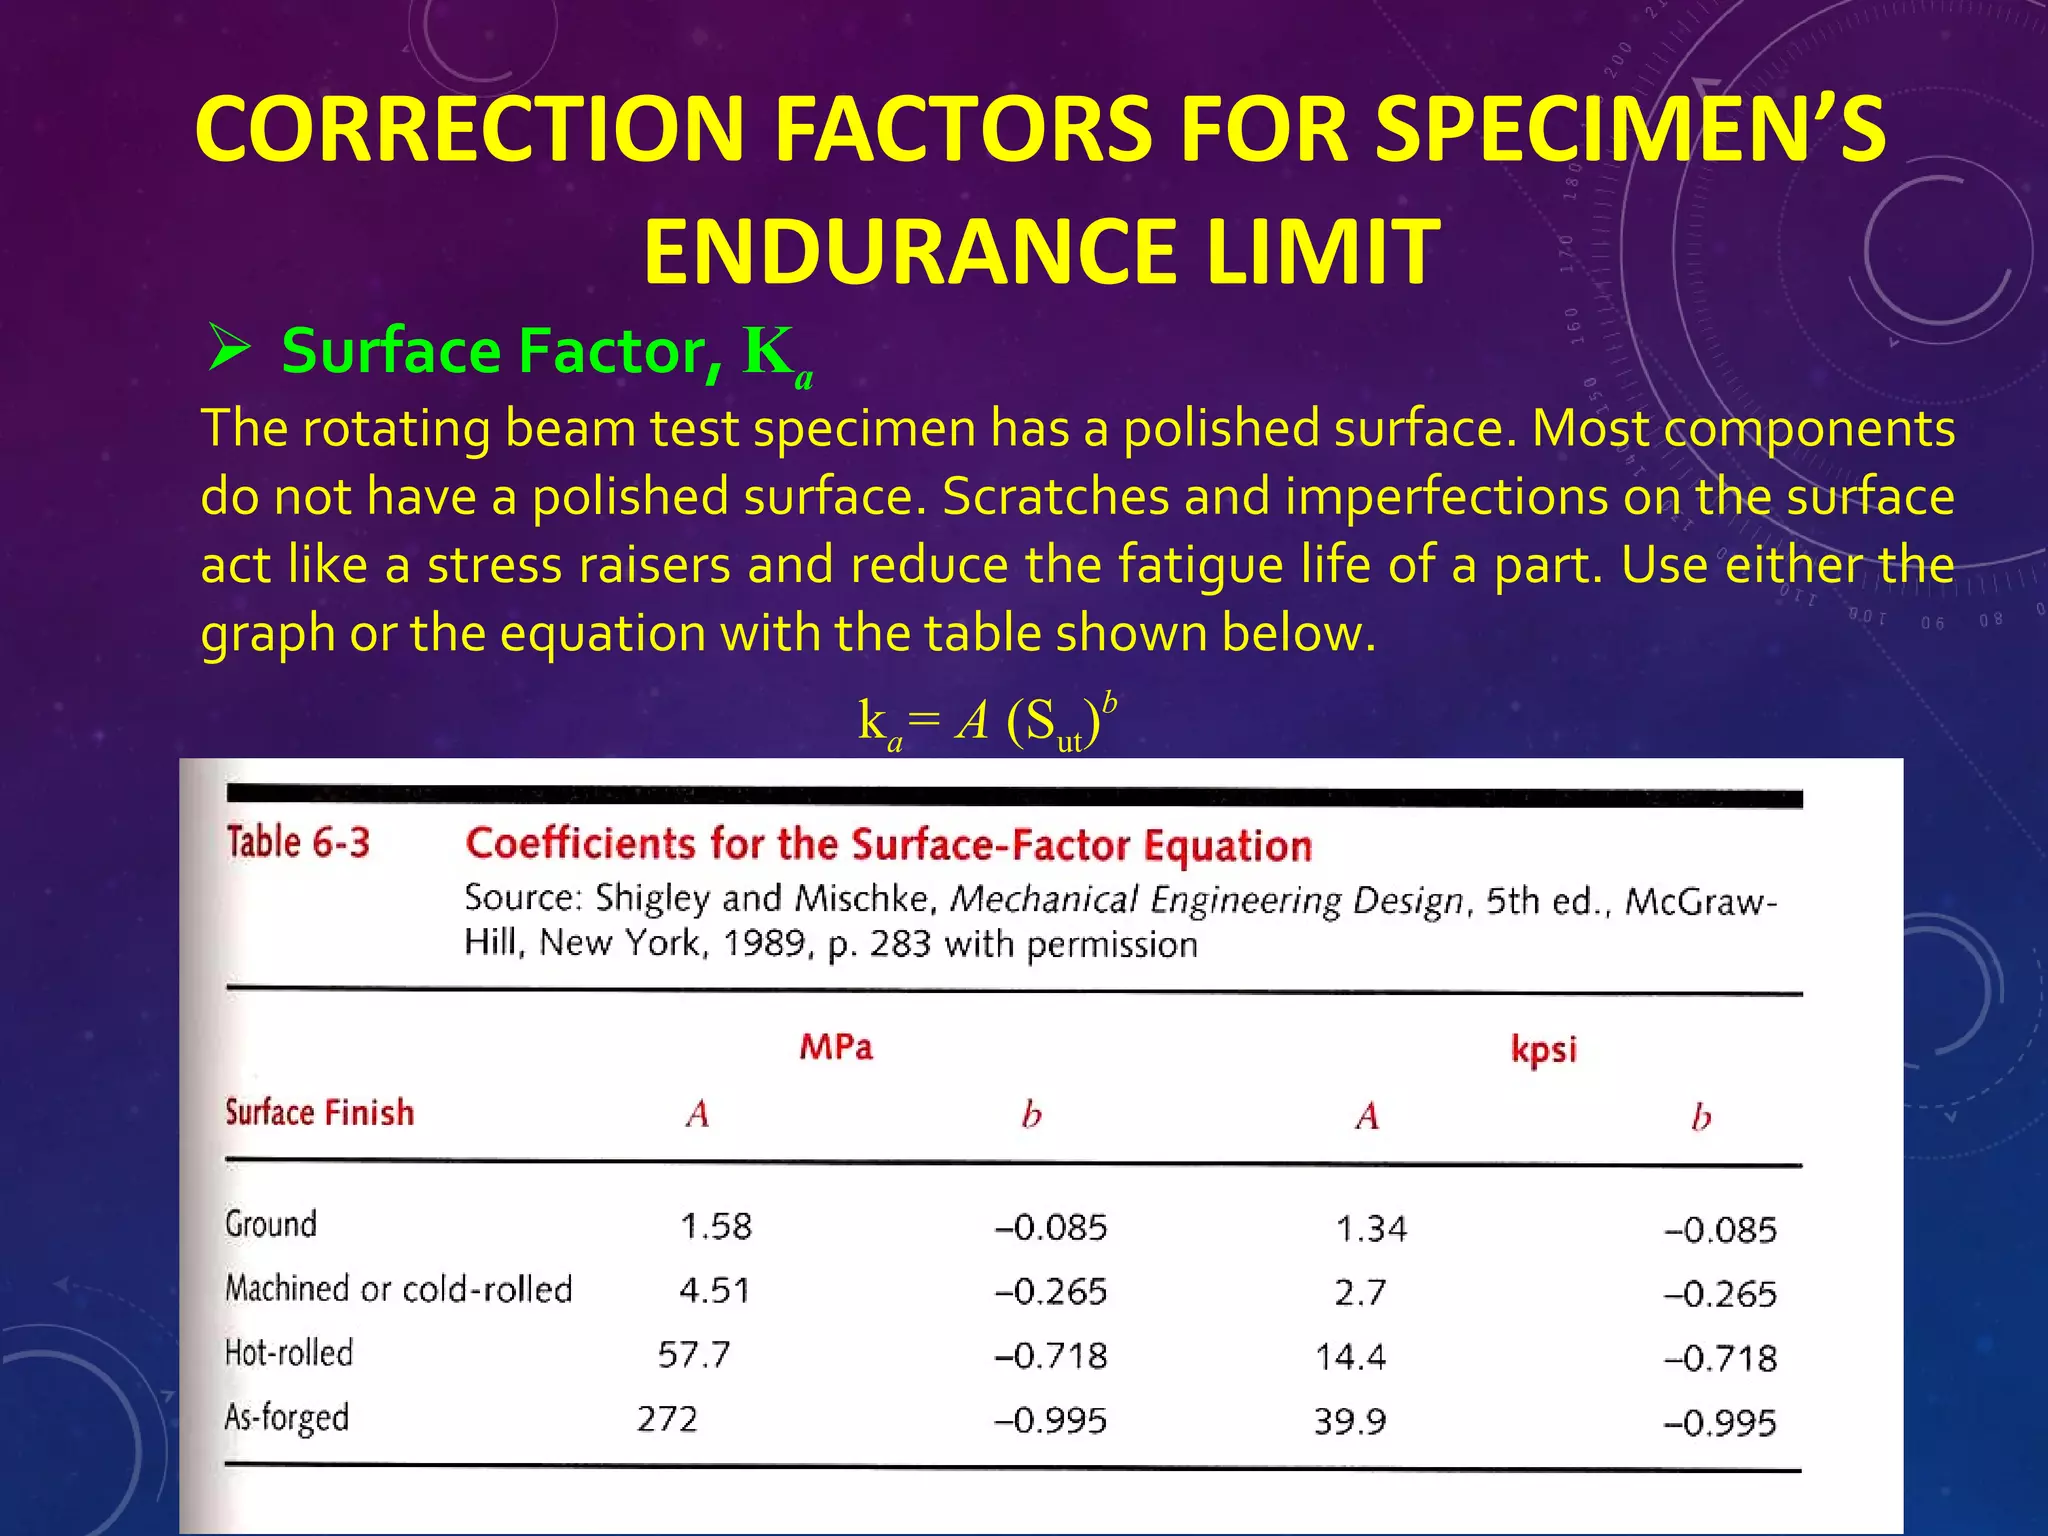
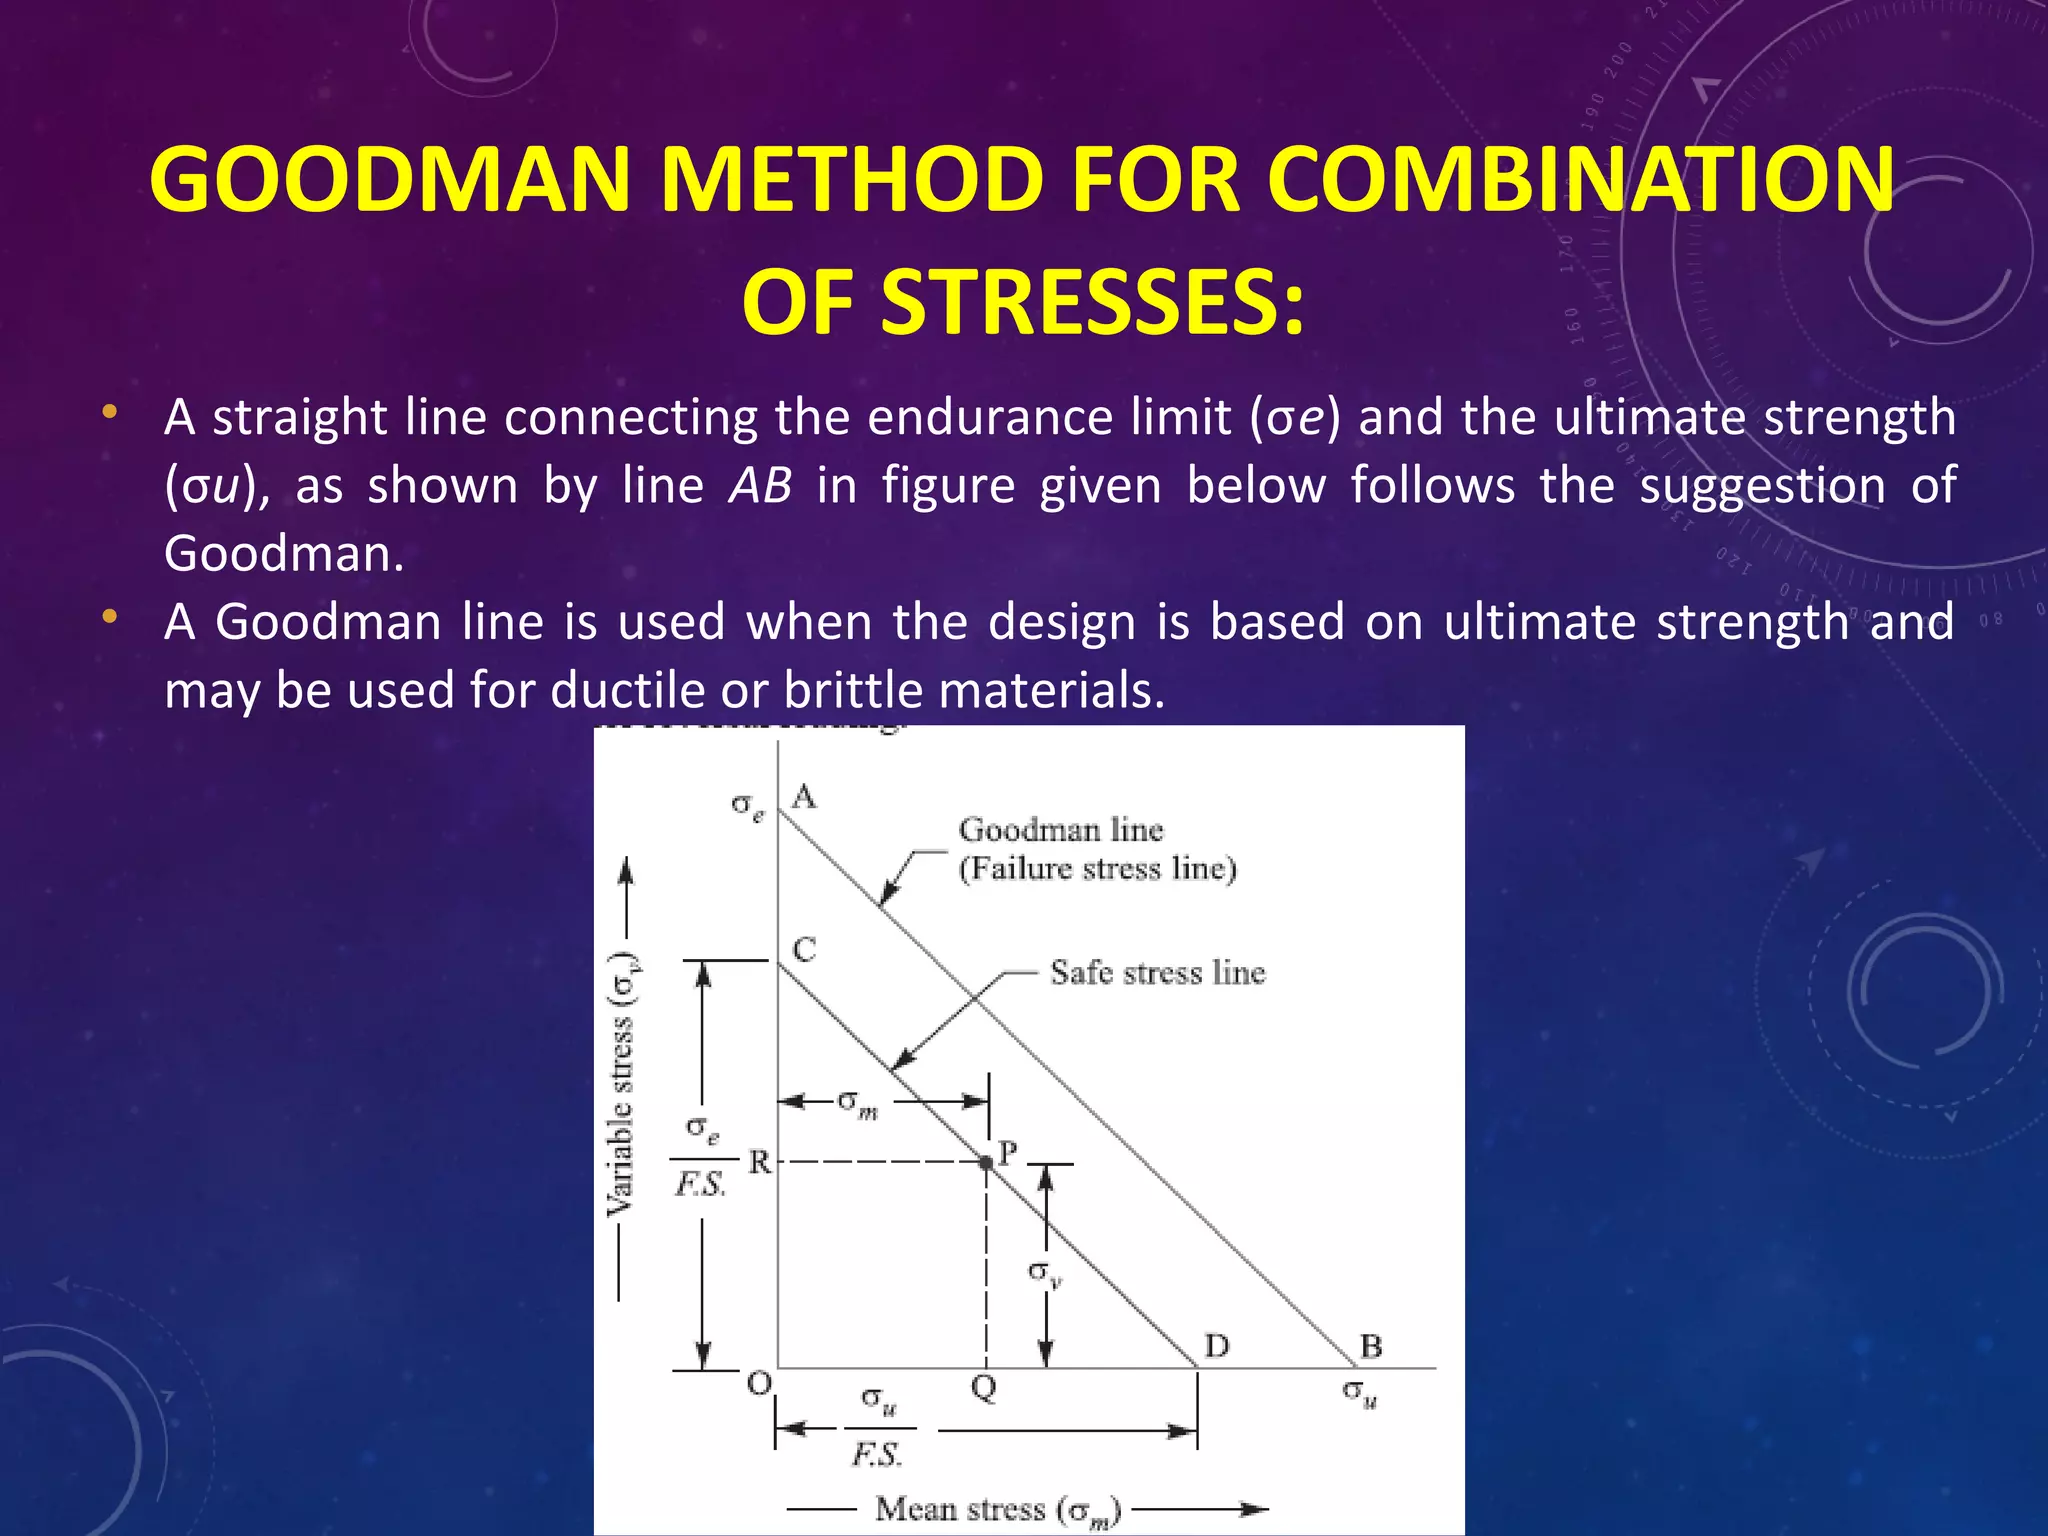
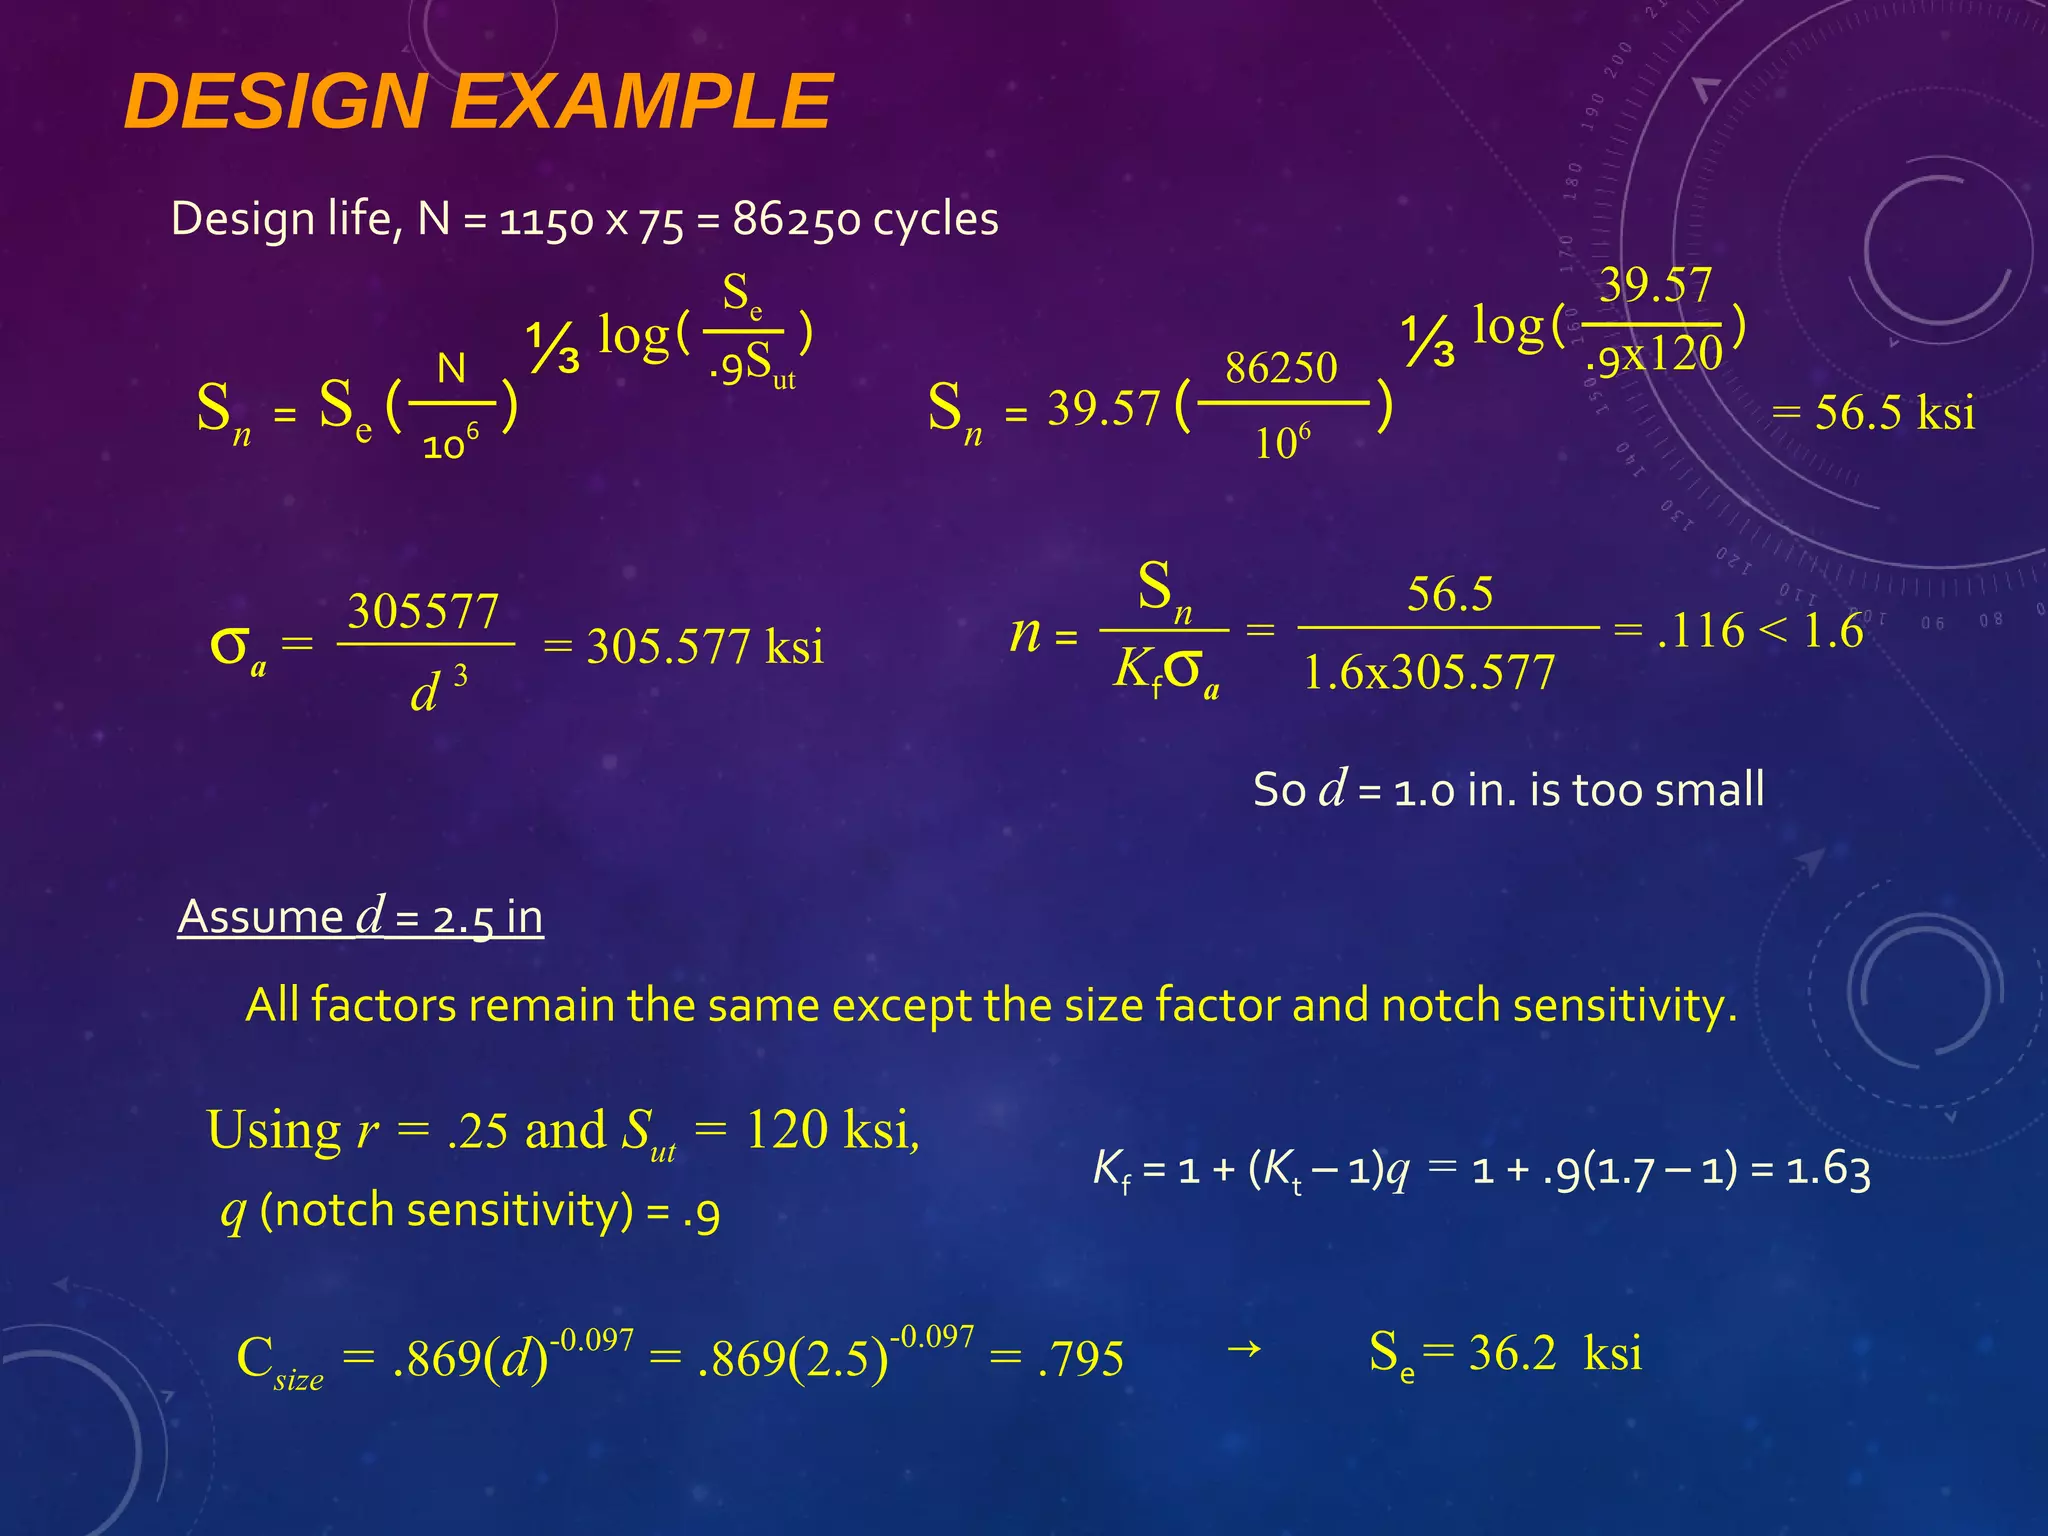
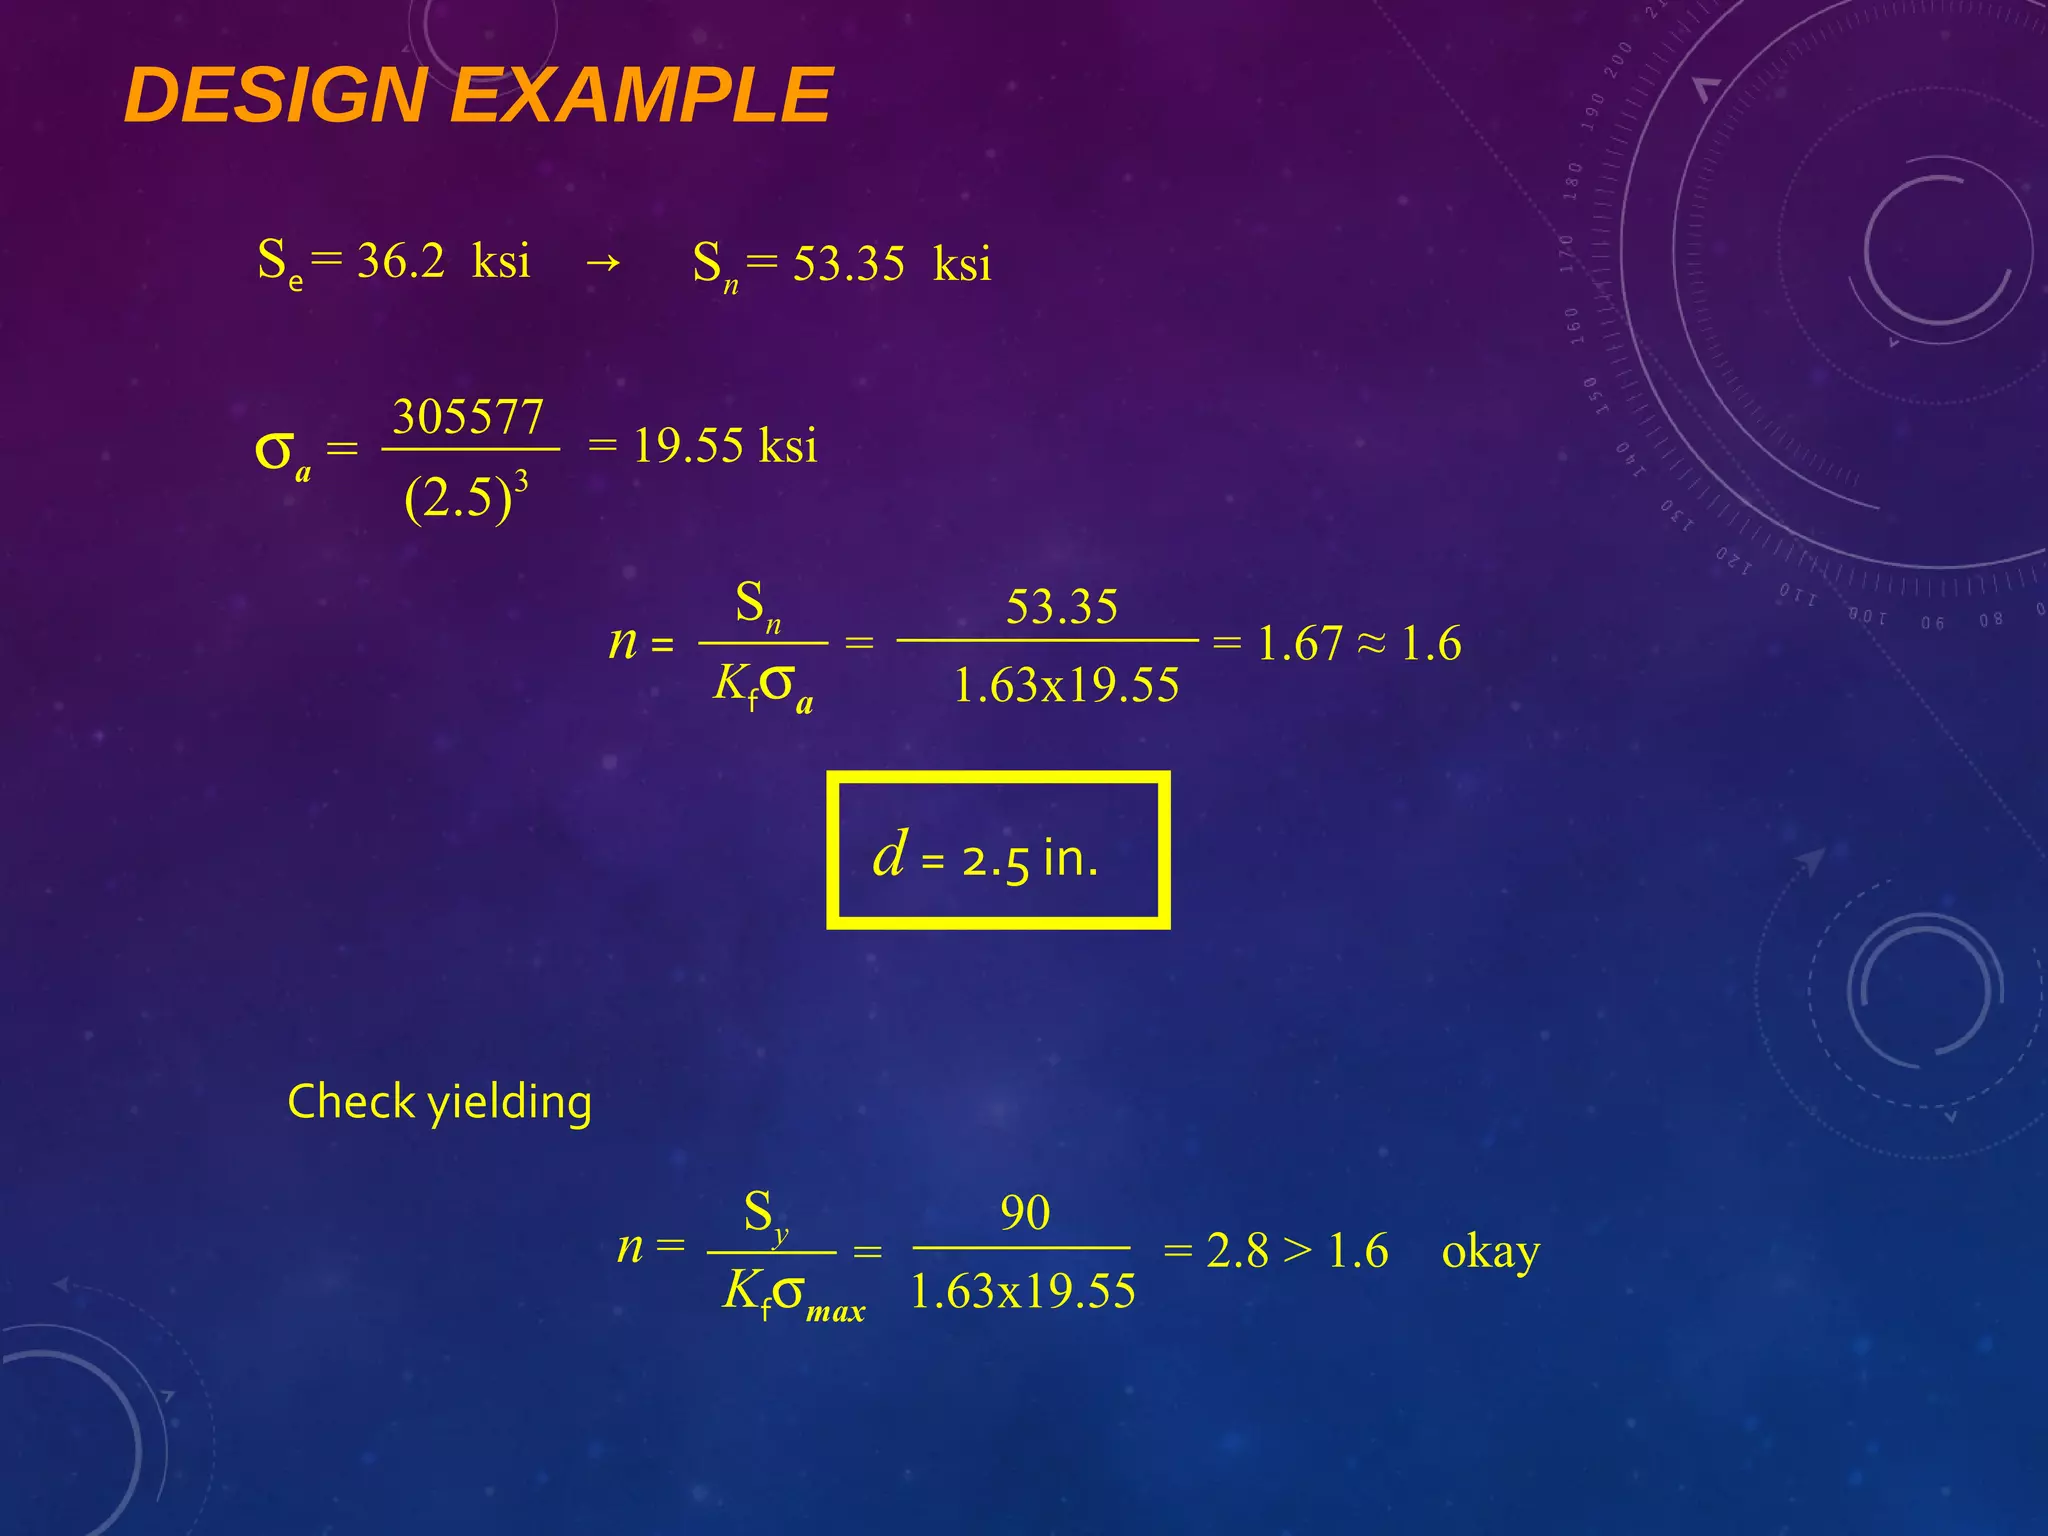
SlideShare a Scribd company logo
DESIGN OF MACHINE ELEMENTS
DESIGN AGAINST FLUCTUATING LOADSDESIGN AGAINST FLUCTUATING LOADS
Prepared by:
PAVAN GANDHI (150053119005)
PRIYANK GANDHI (150053119006)
HARSH DHARAIYA (150053119007)
DHARAMJEET JADEJA (150053119008)
STRESS CONCENTRATION
 Whenever a machine component changes the shape of its cross-section, the
simple stress distribution no longer holds good. This irregularity in the stress
distribution caused by abrupt changes of form is called stress concentration.
 A stress concentration (stress raisers or stress risers) is a location in an object
where stress is concentrated. An object is strongest when force is evenly
distributed over its area, so a reduction in area, e.g., caused by a crack, results
in a localized increase in stress.
 A material can fail, via a propagating crack, when a concentrated stress
exceeds the material's theoretical cohesive strength. The real fracture strength
of a material is always lower than the theoretical value because most materials
contain small cracks or contaminants that concentrate stress.
 It occurs for all kinds of stresses in the presence of fillets, notches, holes,
keyways, splines, surface roughness or scratches etc.
THEORETICAL OR FORM STRESS
CONCENTRATION FACTOR
 The theoretical or form stress concentration factor is defined as the
ratio of the maximum stress in a member (at a notch or a fillet) to the
nominal stress at the same section based upon net area.
 Mathematically, theoretical or form stress concentration factor,
 The value of Kt depends upon the material and geometry of the part.
FATIGUE STRESS CONCENTRATION
FACTOR
• When a machine member is subjected to cyclic or fatigue loading, the
value of fatigue stress concentration factor shall be applied instead of
theoretical stress concentration factor.
• Mathematically, fatigue stress concentration factor,
NOTCH SENSITIVITY
 Notch Sensitivity: It may be defined as the degree to which the
theoretical effect of stress concentration is actually reached.
 Notch Sensitivity Factor “q”: Notch sensitivity factor is defined as the
ratio of increase in the actual stress to the increase in the nominal stress
near the discontinuity in the specimen.
Where, Kf and Kt are the fatigue stress concentration factor and
theoretical stress concentration factor.
 The stress gradient depends mainly on the radius of the notch, hole or
fillet and on the grain size of the material.
METHODS TO REDUCE STRESS
CONCENTRATION
• The presence of stress concentration can not be totally eliminated but it
may be reduced to some extent.
• A device or concept that is useful in assisting a design engineer to visualize
the presence of stress concentration and how it may be mitigated is that of
stress flow lines.
• The mitigation of stress concentration means that the stress flow lines shall
maintain their spacing as far as possible.
• Some of the changes adopted in the design in order to reduce the stress
concentration are as follows:
• Avoid abrupt changes in cross section
• Place additional smaller discontinuities adjacent to discontinuity
• Improve surface finish
 In Fig. (a), we see that stress lines tend to bunch up and cut very close to
the sharp re-entrant corner. In order to improve the situation, fillets may
be provided, as shown in Fig. (b) and (c) to give more equally spaced flow
lines.
 It may be noted that it is not practicable to use large radius fillets as in
case of ball and roller bearing mountings. In such cases, notches may be
cut as shown in Fig. (d).
• Following figures show the several ways of reducing the stress concentration
in shafts and other cylindrical members with shoulders, holes and threads :
• The stress concentration effects of a press fit may be reduced by making more
gradual transition from the rigid to the more flexible shaft.
FACTORS TO BE CONSIDERED WHILE
DESIGNING MACHINE PARTS TO AVOID
FATIGUE FAILURE
• The following factors should be considered while designing machine parts
to avoid fatigue failure:
• The variation in the size of the component should be as gradual as
possible.
• The holes, notches and other stress raisers should be avoided.
• The proper stress de-concentrators such as fillets and notches should be
provided wherever necessary.
• The parts should be protected from corrosive atmosphere.
• A smooth finish of outer surface of the component increases the fatigue
life.
• The material with high fatigue strength should be selected.
• The residual compressive stresses over the parts surface increases its
fatigue strength.
ENDURANCE LIMIT AND FATIGUE FAILURE
 It has been found experimentally that when a material is subjected to
repeated stresses, it fails at stresses below the yield point stresses. Such
type of failure of a material is known as fatigue.
 The failure is caused by means of a progressive crack formation which are
usually fine and of microscopic size. The failure may occur even without any
prior indication.
 The fatigue of material is effected by the size of the component, relative
magnitude of static and fluctuating loads and the number of load reversals.
 A standard mirror polished specimen, as shown in figure is rotated in a fatigue
testing machine while the specimen is loaded in bending.
 As the specimen rotates, the bending stress at the upper fibers varies from
maximum compressive to maximum tensile while the bending stress at the
lower fibers varies from maximum tensile to maximum compressive.
 In other words, the specimen is subjected to a completely reversed stress
cycle. This is represented by a time-stress diagram as shown in Fig. (a).
 Endurance or Fatigue limit (σe) is defined as maximum value of the
completely reversed bending stress which a polished standard specimen can
withstand without failure, for infinite number of cycles.
 It may be noted that the term endurance limit is used for reversed bending
only while for other types of loading, the term endurance strength may be
used when referring the fatigue strength of the material.
 It may be defined as the safe maximum stress which can be applied to the
machine part working under actual conditions.
 We have seen that when a machine member is subjected to a completely
reversed stress, the maximum stress in tension is equal to the maximum
stress in compression as shown in Fig.(a). In actual practice, many machine
members undergo different range of stress than the completely reversed
stress.
 The stress verses time diagram for fluctuating stress having values σmin and
σmax is shown in Fig. (c). The variable stress, in general, may be considered
as a combination of steady (or mean or average) stress and a completely
reversed stress component σv.
 The following relations are derived from Fig. (c):
σa =
σmax σmin
2
Alternating stress
Mean stress
σm =
σmax σmin
2
+
FACTORS AFFECTING ENDURANCE LIMIT
1) SIZE EFFECT:
•The strength of large members is lower than that of small specimens.
•This may be due to two reasons.
•The larger member will have a larger distribution of weak points than the
smaller one and on an average, fails at a lower stress.
•Larger members have larger surface Ares. This is important because the
imperfections that cause fatigue failure are usually at the surface.
Effect of size:
•Increasing the size (especially section thickness) results in larger surface
area and creation of stresses.
•This factor leads to increase in the probability of crack initiation.
•This factor must be kept in mind while designing large sized components.
 2) SURFACE ROUGHNESS:
• Almost all fatigue cracks nucleate at the surface of the members.
• The conditions of the surface roughness and surface oxidation or corrosion
are very important.
• Experiments have shown that different surface finishes of the same
material will show different fatigue strength.
• Methods which Improve the surface finish and those which introduce
compressive stresses on the surface will improve the fatigue strength.
• Smoothly polished specimens have higher fatigue strength.
• Surface treatments. Fatigue cracks initiate at free surface, treatments can
be significant
• Plating, thermal or mechanical means to induce residual stress.
 3) EFFECT OF TEMPERATURE:
• When the mechanical component operates above the room temperature,
its ultimate tensile strength, and hence endurance limit decrease with
increase in temperature.
 4) Effect of metallurgical variables;
• Fatigue strength generally increases with increase in UTS
• Fatigue strength of quenched & tempered steels (tempered martensitic
structure) have better fatigue strength
• Finer grain size show better fatigue strength than coarser grain size.
• Non-metallic inclusions either at surface or sub-surface reduces' the
fatigue strength.
S-N DIAGRAM
 Fatigue strength of material is determined by R.R. Moore rotating beam
machine. The surface is polished in the axial direction. A constant bending
load is applied.
 A record is kept of the number of cycles required to produce failure at a given
stress, and the results are plotted in stress-cycle curve as shown in figure.
 A little consideration will show that if the stress is kept below a certain value the
material will not fail whatever may be the number of cycles.
 This stress, as represented by dotted line, is known as endurance or fatigue limit
(σe).
 It is defined as maximum value of the completely reversed bending stress which a
polished standard specimen can withstand without failure, for infinite number of
cycles (usually 107 cycles).
RELATIONSHIP BETWEEN ENDURANCE
LIMIT AND ULTIMATE STRENGTH
Se =′
0.5Sut
100 ksi
700 MPa
Sut ≤ 200 ksi (1400 MPa)
Sut > 200 ksi
Sut > 1400 MPa
Steel
0.4Sut
Se =′
Sut < 60 ksi (400 MPa)
Sut ≥ 60 ksi24 ksi
160 MPa Sut < 400 MPa
Cast iron Cast iron
RELATIONSHIP BETWEEN ENDURANCE
LIMIT AND ULTIMATE STRENGTH
Se =′
0.4Sut
19 ksi
130 MPa
Sut < 48 ksi (330 MPa)
Sut ≥ 48 ksi
Sut ≥ 330 MPa
Aluminum
For N = 5x10⁸
cycle
Copper alloys
Se =′
0.4Sut
14 ksi
100 MPa
Sut < 40 ksi (280 MPa)
Sut ≥ 40 ksi
Sut ≥ 280 MPa
Copper alloys
For N = 5x10⁸
cycle
CORRECTION FACTORS FOR SPECIMEN’S
ENDURANCE LIMIT
Se = kakbkckdkekfSe’
Where,
•Se = endurance limit of component
•Se’ = endurance limit experimental
•ka = surface finish factor (machined parts have different finish)
•kb = size factor (larger parts greater probability of finding defects)
•kc = reliability / statistical scatter factor (accounts for random variation)
•kd = loading factor (differences in loading types)
•ke = operating T factor (accounts for diff. in working T & room T)
•kf = stress concentration factor
CORRECTION FACTORS FOR SPECIMEN’S
ENDURANCE LIMIT
 Surface Factor, Ka
The rotating beam test specimen has a polished surface. Most components
do not have a polished surface. Scratches and imperfections on the surface
act like a stress raisers and reduce the fatigue life of a part. Use either the
graph or the equation with the table shown below.
ka= A (Sut)b
 Size factor, kb
• Larger parts fail at lower stresses than smaller parts. This is mainly due to
the higher probability of flaws being present in larger components.
• The diameter of the rotating beam specimen is 7.62 mm. if the diameter
or size of the component is more, the surface area is more, resulting in
greater number of surface defect. Hence the endurance limit of
component reduce with the increase in size of component.
• For solid round cross section
d ≤ 0.3 in. (8 mm) kb = 1
0.3 in. < d ≤ 10 in. kb = .869(d)-0.097
8 mm < d ≤ 250 mm kb = 1.189(d)-0.097
If the component is larger than 10 in., use kb = .6
 Reliability factor, kg
• The reliability factor is depends upon the reliability requirement of the
mechanical component.
• The reliability correction factor accounts for the scatter and
uncertainty of material properties (endurance limit).
• Load factor, kc
Pure bending kc = 1
Pure axial kc = 0.7
Combined loading kc = 1
Pure torsion kc = 1 if von Mises stress is used, use 0.577 if
von Mises stress is NOT used.
 Temperature factor
• Accounts for the difference between the test temperature and operating
temperature of the component
• For carbon and alloy steels, fatigue strength not affected by operating
temperature – 45 to 4500
C ke = 1
• At higher operating temperature
• ke = 1 – 5800( T – 450 ) for T between 450 and 550o
C, or
• ke = 1 – 3200( T – 840 ) for T between 840 and 1020o
F
DESIGN PROCESS – FULLY REVERSED
LOADING FOR INFINITE LIFE
• Determine the maximum alternating applied stress, σa, in terms of
the size and cross sectional profile
• Select material → Sy, Sut
• Use the design equation to calculate the size
• Se
• Kf σa =• n
• Choose a safety factor → n
• Determine all modifying factors and calculate the
endurance limit of the component → Se
• Determine the fatigue stress concentration factor, Kf
• Investigate different cross sections (profiles), optimize for size or
weight
• You may also assume a profile and size, calculate the alternating stress
and determine the safety factor. Iterate until you obtain the desired
safety factor
DESIGN FOR FINITE LIFE
Sn = a (N)b
equation of the fatigue line
N
S
Se
106
103
A
B
N
S
Sf
5x10⁸
103
A
B
Point A
Sn = .9Sut
N = 103
Point A
Sn = .9Sut
N = 103
Point B
Sn = Sf
N = 5x10⁸
Point B
Sn = Se
N = 106
DESIGN FOR FINITE LIFE
Sn = a (N)b
log Sn = log a + b log N
Apply conditions for point A and B to find the two
constants “a” and “b”
log .9Sut = log a + b log 103
log Se = log a + b log 106
a =
(.9Sut)
2
Se
b =
.9Sut
Se
1
3
log
Sn
Kf σa =
n
Design equation
Calculate Sn and replace Se in the design equation
Sn = Se (
N
106
)
⅓ (
Se
.9Sut
)log
FLUCTUATING STRESSES
 The failure points from fatigue tests made with different steels and
combinations of mean and variable stresses are plotted in figure as functions
of stress amplitude(σa) and mean stress (σm).
 The most significant observation is that, in general, the failure point is little
related to the mean stress when it is compressive but is very much a function
of the mean stress when it is tensile.
 In practice, this means that fatigue failures are rare when the mean stress is
compressive (or negative). Therefore, the greater emphasis must be given to
the combination of a variable stress and a steady (or mean) tensile stress.
Mean stress
Alternating
stress
σm
σa
Se
SySoderberg line
Sut
Goodman line
Gerber curve
Sy
Yield line
GOODMAN METHOD FOR COMBINATION
OF STRESSES:
• A straight line connecting the endurance limit (σe) and the ultimate strength
(σu), as shown by line AB in figure given below follows the suggestion of
Goodman.
• A Goodman line is used when the design is based on ultimate strength and
may be used for ductile or brittle materials.
Now from similar triangles COD and PQD,
SODERBERG METHOD FOR COMBINATION OF
STRESSES
 A straight line connecting the endurance limit (σe) and the yield strength
(σy), as shown by the line AB in following figure, follows the suggestion of
Soderberg line.
 This line is used when the design is based on yield strength. the line AB
connecting σe and σy, as shown in following figure, is called Soderberg's
failure stress line.
 If a suitable factor of safety (F.S.) is applied to the endurance limit and yield
strength, a safe stress line CD may be drawn parallel to the line AB.
MODIFIED GOODMAN DIAGRAM:
 In the design of components subjected to fluctuating stresses, the
Goodman diagram is slightly modified to account for the yielding failure
of the components, especially, at higher values of the mean stresses.
 The diagram known as modified Goodman diagram and is most widely
used in the design of the components subjected to fluctuating stresses.
MODIFIED GOODMAN DIAGRAM FOR
FLUCTUATING AXIAL AND BENDING
STRESSES
+σm
σa
Sut
Safe zone
- σm
C
Sy
Safe zone
Se
- Syc
Finite life
Sn
1=
Sut
σa σm
+
Fatigue, σm > 0Fatigue, σm ≤ 0
σa =
Se
nf
σa + σm =
Sy
ny
Yield
σa + σm =
Sy
ny
Yield
nfSe
1
=
Sut
σa σm
+ Infinite life
DESIGN EXAMPLE
R1 R2
10,000 lb.
6˝6˝12˝
D = 1.5dd
r (fillet radius) = .1d
A rotating shaft is carrying 10,000 lb force as
shown. The shaft is made of steel with Sut =
120 ksi and Sy = 90 ksi. The shaft is
rotating at 1150 rpm and has a machine
finish surface. Determine the diameter,
d, for 75 minutes life. Use safety factor
of 1.6 and 50% reliability.
Calculate the support forces, R1 = 2500, R2 = 7500 lb.
A
The critical location is at the fillet, MA = 2500 x 12 = 30,000 lb-in
σa =Calculate the alternating stress, Mc
I
=
32M
πd 3
=
305577
d 3
σm = 0
Determine the stress concentration factor
r
d
= .1
D
d
= 1.5
Kt = 1.7
DESIGN EXAMPLE
Assume d = 1.0 in
Using r = .1 and Sut = 120 ksi,
q (notch sensitivity) = .85
Kf = 1 + (Kt – 1)q = 1 + .85(1.7 – 1) = 1.6
Calculate the endurance limit
Cload = 1 (pure bending)
Crel = 1 (50% rel.)
Ctemp= 1 (room temp)
Csurf = A (Sut)b
= 2.7(120)
-.265
= .759
0.3 in. < d ≤ 10 in. Csize = .869(d)-0.097
= .869(1)
-0.097
= .869
Se = Cload Csize Csurf Ctemp Crel (Se) = (.759)(.869)(.5x120) = 39.57 ksi′
DESIGN EXAMPLE
Design life, N = 1150 x 75 = 86250 cycles
Sn = Se (
N
106
)
⅓ (
Se
.9Sut
)log
Sn = 39.57 (
86250
106
)
⅓ (
39.57
.9x120
)log
= 56.5 ksi
σa =
305577
d 3
= 305.577 ksi n=
Sn
Kfσa
=
56.5
1.6x305.577
= .116 < 1.6
So d = 1.0 in. is too small
Assume d = 2.5 in
All factors remain the same except the size factor and notch sensitivity.
Using r = .25 and Sut = 120 ksi,
q (notch sensitivity) = .9
Kf = 1 + (Kt – 1)q = 1 + .9(1.7 – 1) = 1.63
Csize = .869(d)-0.097
= .869(2.5)
-0.097
= .795 Se = 36.2 ksi→
DESIGN EXAMPLE
σa =
305577
(2.5)3
= 19.55 ksi
n =
Sn
Kfσa
=
53.35
1.63x19.55
= 1.67 ≈ 1.6
d = 2.5 in.
Check yielding
n =
Sy
Kfσmax
=
90
1.63x19.55
= 2.8 > 1.6 okay
Se = 36.2 ksi Sn = 53.35 ksi→
DESIGN AGAINST FLUCTUATING LOAD

More Related Content

What's hot

Unit 2 Design Of Shafts Keys and Couplings
Unit 2 Design Of Shafts Keys and CouplingsUnit 2 Design Of Shafts Keys and Couplings
Unit 2 Design Of Shafts Keys and Couplings
Mahesh Shinde
 
Static Force Analysis
Static Force AnalysisStatic Force Analysis
Unit 5 threaded joint
Unit 5 threaded jointUnit 5 threaded joint
Unit 5 threaded joint
Somnath Kolgiri
 
Machine elements
Machine elementsMachine elements
Machine elements
AISSMS IOIT,PUNE
 
Types of stresses and theories of failure (machine design & industrial drafti...
Types of stresses and theories of failure (machine design & industrial drafti...Types of stresses and theories of failure (machine design & industrial drafti...
Types of stresses and theories of failure (machine design & industrial drafti...
Digvijaysinh Gohil
 
Design for fluctuation loads
Design for fluctuation loadsDesign for fluctuation loads
Design for fluctuation loads
Feroz Ahmed
 
DESIGN OF SHAFT
DESIGN OF SHAFTDESIGN OF SHAFT
DESIGN OF SHAFT
Pulkit Pathak
 
Gear trains
Gear trainsGear trains
Introduction of design of machine element
Introduction of design of machine elementIntroduction of design of machine element
Introduction of design of machine element
yamini champaneri
 
Stress concentration
Stress concentrationStress concentration
Stress concentration
Simasiku Pollen Mwilima
 
Endurance limit
Endurance limitEndurance limit
Endurance limit
onlinemetallurgy.com
 
Power Screw and its application
Power Screw and its applicationPower Screw and its application
Power Screw and its application
Mohammed Limdiwala
 
Axisymmetric
Axisymmetric Axisymmetric
Axisymmetric
Raj Kumar
 
design of knuckle joint may 2020
design of knuckle joint may 2020design of knuckle joint may 2020
design of knuckle joint may 2020
Gaurav Mistry
 
Surface roughness metrology
Surface roughness metrologySurface roughness metrology
Surface roughness metrology
Harshal Varade
 
Capston and turrent lathe
Capston and turrent latheCapston and turrent lathe
Capston and turrent lathe
Yuga Aravind Kumar
 
Coupling clutch brake
Coupling clutch brakeCoupling clutch brake
Coupling clutch brake
Tanuj Parikh
 
single degree of freedom systems forced vibrations
single degree of freedom systems forced vibrations single degree of freedom systems forced vibrations
single degree of freedom systems forced vibrations
KESHAV
 
Design of bearing
Design of bearingDesign of bearing
Design of bearing
gosavianiruddha
 

What's hot (20)

Unit 2 Design Of Shafts Keys and Couplings
Unit 2 Design Of Shafts Keys and CouplingsUnit 2 Design Of Shafts Keys and Couplings
Unit 2 Design Of Shafts Keys and Couplings
 
Static Force Analysis
Static Force AnalysisStatic Force Analysis
Static Force Analysis
 
Gear train
Gear trainGear train
Gear train
 
Unit 5 threaded joint
Unit 5 threaded jointUnit 5 threaded joint
Unit 5 threaded joint
 
Machine elements
Machine elementsMachine elements
Machine elements
 
Types of stresses and theories of failure (machine design & industrial drafti...
Types of stresses and theories of failure (machine design & industrial drafti...Types of stresses and theories of failure (machine design & industrial drafti...
Types of stresses and theories of failure (machine design & industrial drafti...
 
Design for fluctuation loads
Design for fluctuation loadsDesign for fluctuation loads
Design for fluctuation loads
 
DESIGN OF SHAFT
DESIGN OF SHAFTDESIGN OF SHAFT
DESIGN OF SHAFT
 
Gear trains
Gear trainsGear trains
Gear trains
 
Introduction of design of machine element
Introduction of design of machine elementIntroduction of design of machine element
Introduction of design of machine element
 
Stress concentration
Stress concentrationStress concentration
Stress concentration
 
Endurance limit
Endurance limitEndurance limit
Endurance limit
 
Power Screw and its application
Power Screw and its applicationPower Screw and its application
Power Screw and its application
 
Axisymmetric
Axisymmetric Axisymmetric
Axisymmetric
 
design of knuckle joint may 2020
design of knuckle joint may 2020design of knuckle joint may 2020
design of knuckle joint may 2020
 
Surface roughness metrology
Surface roughness metrologySurface roughness metrology
Surface roughness metrology
 
Capston and turrent lathe
Capston and turrent latheCapston and turrent lathe
Capston and turrent lathe
 
Coupling clutch brake
Coupling clutch brakeCoupling clutch brake
Coupling clutch brake
 
single degree of freedom systems forced vibrations
single degree of freedom systems forced vibrations single degree of freedom systems forced vibrations
single degree of freedom systems forced vibrations
 
Design of bearing
Design of bearingDesign of bearing
Design of bearing
 

Viewers also liked

Fluctuating loads notes
Fluctuating loads notesFluctuating loads notes
Fluctuating loads notes
manoj kininge
 
PED 2016 - Design 101 - Week 2 - Handouts
PED 2016 - Design 101 - Week 2 - HandoutsPED 2016 - Design 101 - Week 2 - Handouts
PED 2016 - Design 101 - Week 2 - Handouts
Mohamed Mostafa Ahmed Adam
 
Dinesh machine design
Dinesh machine designDinesh machine design
Dinesh machine design
Flt Lt Dinesh Gupta
 
Design of machine_elements_
Design of machine_elements_Design of machine_elements_
Design of machine_elements_Zainul Abedin
 
Stress Calculation | weyer special
Stress Calculation | weyer specialStress Calculation | weyer special
Stress Calculation | weyer special
weyer gruppe
 
Evaluation of the extreme and fatigue load measurements at alpha ventus
Evaluation of the extreme and fatigue load measurements at alpha ventusEvaluation of the extreme and fatigue load measurements at alpha ventus
Evaluation of the extreme and fatigue load measurements at alpha ventus
Ricardo Faerron Guzmán
 
Moving: Resume Visualization
Moving: Resume VisualizationMoving: Resume Visualization
Moving: Resume Visualization
sbisker
 
SURATGARH SUPER THERMAL POWER STATION
SURATGARH  SUPER  THERMAL POWER    STATION SURATGARH  SUPER  THERMAL POWER    STATION
SURATGARH SUPER THERMAL POWER STATION Sagar Sharma
 
The osterberg cell static loading test
The osterberg cell static loading testThe osterberg cell static loading test
The osterberg cell static loading test
Alaa Metwally
 
Mos unit iii
Mos unit iiiMos unit iii
Mos unit iii
Yatin Singh
 
F1302022933
F1302022933F1302022933
F1302022933
IOSR Journals
 
Joshua lederberg ppt
Joshua lederberg pptJoshua lederberg ppt
Joshua lederberg ppt
Nikita Khromov-Borisov
 
Mme 323 materials science week 11-12 - failure
Mme 323 materials science   week 11-12 - failureMme 323 materials science   week 11-12 - failure
Mme 323 materials science week 11-12 - failure
Adhi Primartomo
 
Cd chap 2 - static loading
Cd   chap 2 - static loadingCd   chap 2 - static loading
Cd chap 2 - static loadingMohamad Sahiedan
 
Industrial Training at Suratgarh Super Thermal Power Plant ppt
Industrial Training at Suratgarh Super Thermal Power Plant pptIndustrial Training at Suratgarh Super Thermal Power Plant ppt
Industrial Training at Suratgarh Super Thermal Power Plant ppt
MSHRISTISAHU
 
Mfg tooling 04 cutting tool design
Mfg tooling  04 cutting tool designMfg tooling  04 cutting tool design
Mfg tooling 04 cutting tool design
Nageswara Rao Posinasetti
 
Screw threadreport
Screw threadreportScrew threadreport
Screw threadreport
ajitsss
 
Genetic engineering
Genetic engineeringGenetic engineering
Genetic engineeringCrystal Rose
 

Viewers also liked (20)

Fluctuating loads notes
Fluctuating loads notesFluctuating loads notes
Fluctuating loads notes
 
PED 2016 - Design 101 - Week 2 - Handouts
PED 2016 - Design 101 - Week 2 - HandoutsPED 2016 - Design 101 - Week 2 - Handouts
PED 2016 - Design 101 - Week 2 - Handouts
 
Dinesh machine design
Dinesh machine designDinesh machine design
Dinesh machine design
 
Design of machine_elements_
Design of machine_elements_Design of machine_elements_
Design of machine_elements_
 
Stress Calculation | weyer special
Stress Calculation | weyer specialStress Calculation | weyer special
Stress Calculation | weyer special
 
Evaluation of the extreme and fatigue load measurements at alpha ventus
Evaluation of the extreme and fatigue load measurements at alpha ventusEvaluation of the extreme and fatigue load measurements at alpha ventus
Evaluation of the extreme and fatigue load measurements at alpha ventus
 
Moving: Resume Visualization
Moving: Resume VisualizationMoving: Resume Visualization
Moving: Resume Visualization
 
SURATGARH SUPER THERMAL POWER STATION
SURATGARH  SUPER  THERMAL POWER    STATION SURATGARH  SUPER  THERMAL POWER    STATION
SURATGARH SUPER THERMAL POWER STATION
 
FORCES AND DEFLECTION OF COIL SPRINGS
FORCES AND DEFLECTION OF COIL SPRINGSFORCES AND DEFLECTION OF COIL SPRINGS
FORCES AND DEFLECTION OF COIL SPRINGS
 
The osterberg cell static loading test
The osterberg cell static loading testThe osterberg cell static loading test
The osterberg cell static loading test
 
Mos unit iii
Mos unit iiiMos unit iii
Mos unit iii
 
F1302022933
F1302022933F1302022933
F1302022933
 
Joshua lederberg ppt
Joshua lederberg pptJoshua lederberg ppt
Joshua lederberg ppt
 
Mme 323 materials science week 11-12 - failure
Mme 323 materials science   week 11-12 - failureMme 323 materials science   week 11-12 - failure
Mme 323 materials science week 11-12 - failure
 
Cd chap 2 - static loading
Cd   chap 2 - static loadingCd   chap 2 - static loading
Cd chap 2 - static loading
 
Industrial Training at Suratgarh Super Thermal Power Plant ppt
Industrial Training at Suratgarh Super Thermal Power Plant pptIndustrial Training at Suratgarh Super Thermal Power Plant ppt
Industrial Training at Suratgarh Super Thermal Power Plant ppt
 
Mfg tooling 04 cutting tool design
Mfg tooling  04 cutting tool designMfg tooling  04 cutting tool design
Mfg tooling 04 cutting tool design
 
10 mutation
10 mutation10 mutation
10 mutation
 
Screw threadreport
Screw threadreportScrew threadreport
Screw threadreport
 
Genetic engineering
Genetic engineeringGenetic engineering
Genetic engineering
 

Similar to DESIGN AGAINST FLUCTUATING LOAD

CHAPTER 1.ppt
CHAPTER 1.pptCHAPTER 1.ppt
CHAPTER 1.ppt
Jani Jai
 
2.1DME-Unit-2 notes.pptx
2.1DME-Unit-2 notes.pptx2.1DME-Unit-2 notes.pptx
2.1DME-Unit-2 notes.pptx
AbdulRahman513217
 
Unit_4_Design Agains Fluctuation load.ppt
Unit_4_Design Agains Fluctuation load.pptUnit_4_Design Agains Fluctuation load.ppt
Unit_4_Design Agains Fluctuation load.ppt
DrSomnathKolgiri
 
Tom&amp;md notes module 03
Tom&amp;md notes module 03Tom&amp;md notes module 03
Tom&amp;md notes module 03
Ashish Mishra
 
Concept of ‘fatigue’ in welded steel
Concept of ‘fatigue’ in welded steelConcept of ‘fatigue’ in welded steel
Concept of ‘fatigue’ in welded steel
V Kash Singh
 
255877339-Creep-and-Fatigue.pdf
255877339-Creep-and-Fatigue.pdf255877339-Creep-and-Fatigue.pdf
255877339-Creep-and-Fatigue.pdf
upender3
 
Mechanical properties
Mechanical propertiesMechanical properties
Mechanical properties
Yatin Singh
 
lecturenote_1177425455CAPTER TWO-Design for static strength.pdf
lecturenote_1177425455CAPTER TWO-Design for static strength.pdflecturenote_1177425455CAPTER TWO-Design for static strength.pdf
lecturenote_1177425455CAPTER TWO-Design for static strength.pdf
Praveen Kumar
 
Variable stresses in machine parts
Variable stresses in machine partsVariable stresses in machine parts
Variable stresses in machine parts
Mohamed Mohamed El-Sayed
 
Tensile
TensileTensile
Tensile
Ammour Omrane
 
lec10lec11fatigueanalysis-161211121313.pdf
lec10lec11fatigueanalysis-161211121313.pdflec10lec11fatigueanalysis-161211121313.pdf
lec10lec11fatigueanalysis-161211121313.pdf
ssuser748bff
 
Stress strain curve
Stress strain curveStress strain curve
Stress strain curve
Mazadul Hasan
 
Chpr3 experimental
Chpr3 experimentalChpr3 experimental
Chpr3 experimentalRaj Shekaran
 
Mc testing Lec 2.pptx
Mc testing Lec 2.pptxMc testing Lec 2.pptx
Mc testing Lec 2.pptx
DrAjitKatkar
 
Solid Mechanics: Thin walled pressure vessel
Solid Mechanics: Thin walled pressure vesselSolid Mechanics: Thin walled pressure vessel
Solid Mechanics: Thin walled pressure vessel
প্রিয়দীপ প্রিয়ম
 
Fatigue Analysis of Structures (Aerospace Application)
Fatigue Analysis of Structures (Aerospace Application)Fatigue Analysis of Structures (Aerospace Application)
Fatigue Analysis of Structures (Aerospace Application)
Mahdi Damghani
 
FEA_STRUCTURE.pptx
FEA_STRUCTURE.pptxFEA_STRUCTURE.pptx
FEA_STRUCTURE.pptx
JoshuaKarthik1
 
3 optimum-design
3 optimum-design3 optimum-design
3 optimum-designELIMENG
 

Similar to DESIGN AGAINST FLUCTUATING LOAD (20)

CHAPTER 1.ppt
CHAPTER 1.pptCHAPTER 1.ppt
CHAPTER 1.ppt
 
2.1DME-Unit-2 notes.pptx
2.1DME-Unit-2 notes.pptx2.1DME-Unit-2 notes.pptx
2.1DME-Unit-2 notes.pptx
 
Unit_4_Design Agains Fluctuation load.ppt
Unit_4_Design Agains Fluctuation load.pptUnit_4_Design Agains Fluctuation load.ppt
Unit_4_Design Agains Fluctuation load.ppt
 
Tom&amp;md notes module 03
Tom&amp;md notes module 03Tom&amp;md notes module 03
Tom&amp;md notes module 03
 
Concept of ‘fatigue’ in welded steel
Concept of ‘fatigue’ in welded steelConcept of ‘fatigue’ in welded steel
Concept of ‘fatigue’ in welded steel
 
255877339-Creep-and-Fatigue.pdf
255877339-Creep-and-Fatigue.pdf255877339-Creep-and-Fatigue.pdf
255877339-Creep-and-Fatigue.pdf
 
Mechanical properties
Mechanical propertiesMechanical properties
Mechanical properties
 
lecturenote_1177425455CAPTER TWO-Design for static strength.pdf
lecturenote_1177425455CAPTER TWO-Design for static strength.pdflecturenote_1177425455CAPTER TWO-Design for static strength.pdf
lecturenote_1177425455CAPTER TWO-Design for static strength.pdf
 
Variable stresses in machine parts
Variable stresses in machine partsVariable stresses in machine parts
Variable stresses in machine parts
 
Tensile
TensileTensile
Tensile
 
lec10lec11fatigueanalysis-161211121313.pdf
lec10lec11fatigueanalysis-161211121313.pdflec10lec11fatigueanalysis-161211121313.pdf
lec10lec11fatigueanalysis-161211121313.pdf
 
Stress strain curve
Stress strain curveStress strain curve
Stress strain curve
 
Chpr3 experimental
Chpr3 experimentalChpr3 experimental
Chpr3 experimental
 
Mc testing Lec 2.pptx
Mc testing Lec 2.pptxMc testing Lec 2.pptx
Mc testing Lec 2.pptx
 
Solid Mechanics: Thin walled pressure vessel
Solid Mechanics: Thin walled pressure vesselSolid Mechanics: Thin walled pressure vessel
Solid Mechanics: Thin walled pressure vessel
 
Tensile testing experiment
Tensile testing experimentTensile testing experiment
Tensile testing experiment
 
Fatigue Analysis of Structures (Aerospace Application)
Fatigue Analysis of Structures (Aerospace Application)Fatigue Analysis of Structures (Aerospace Application)
Fatigue Analysis of Structures (Aerospace Application)
 
FEA_STRUCTURE.pptx
FEA_STRUCTURE.pptxFEA_STRUCTURE.pptx
FEA_STRUCTURE.pptx
 
3 optimum-design
3 optimum-design3 optimum-design
3 optimum-design
 
Fracture Mechanics & Failure Analysis: Lecture Fatigue
Fracture Mechanics & Failure Analysis: Lecture FatigueFracture Mechanics & Failure Analysis: Lecture Fatigue
Fracture Mechanics & Failure Analysis: Lecture Fatigue
 

Recently uploaded

Quality defects in TMT Bars, Possible causes and Potential Solutions.
Quality defects in TMT Bars, Possible causes and Potential Solutions.Quality defects in TMT Bars, Possible causes and Potential Solutions.
Quality defects in TMT Bars, Possible causes and Potential Solutions.
PrashantGoswami42
 
H.Seo, ICLR 2024, MLILAB, KAIST AI.pdf
H.Seo,  ICLR 2024, MLILAB,  KAIST AI.pdfH.Seo,  ICLR 2024, MLILAB,  KAIST AI.pdf
H.Seo, ICLR 2024, MLILAB, KAIST AI.pdf
MLILAB
 
power quality voltage fluctuation UNIT - I.pptx
power quality voltage fluctuation UNIT - I.pptxpower quality voltage fluctuation UNIT - I.pptx
power quality voltage fluctuation UNIT - I.pptx
ViniHema
 
Planning Of Procurement o different goods and services
Planning Of Procurement o different goods and servicesPlanning Of Procurement o different goods and services
Planning Of Procurement o different goods and services
JoytuBarua2
 
Gen AI Study Jams _ For the GDSC Leads in India.pdf
Gen AI Study Jams _ For the GDSC Leads in India.pdfGen AI Study Jams _ For the GDSC Leads in India.pdf
Gen AI Study Jams _ For the GDSC Leads in India.pdf
gdsczhcet
 
TECHNICAL TRAINING MANUAL GENERAL FAMILIARIZATION COURSE
TECHNICAL TRAINING MANUAL   GENERAL FAMILIARIZATION COURSETECHNICAL TRAINING MANUAL   GENERAL FAMILIARIZATION COURSE
TECHNICAL TRAINING MANUAL GENERAL FAMILIARIZATION COURSE
DuvanRamosGarzon1
 
一比一原版(SFU毕业证)西蒙菲莎大学毕业证成绩单如何办理
一比一原版(SFU毕业证)西蒙菲莎大学毕业证成绩单如何办理一比一原版(SFU毕业证)西蒙菲莎大学毕业证成绩单如何办理
一比一原版(SFU毕业证)西蒙菲莎大学毕业证成绩单如何办理
bakpo1
 
Forklift Classes Overview by Intella Parts
Forklift Classes Overview by Intella PartsForklift Classes Overview by Intella Parts
Forklift Classes Overview by Intella Parts
Intella Parts
 
Architectural Portfolio Sean Lockwood
Architectural Portfolio Sean LockwoodArchitectural Portfolio Sean Lockwood
Architectural Portfolio Sean Lockwood
seandesed
 
block diagram and signal flow graph representation
block diagram and signal flow graph representationblock diagram and signal flow graph representation
block diagram and signal flow graph representation
Divya Somashekar
 
Nuclear Power Economics and Structuring 2024
Nuclear Power Economics and Structuring 2024Nuclear Power Economics and Structuring 2024
Nuclear Power Economics and Structuring 2024
Massimo Talia
 
The Benefits and Techniques of Trenchless Pipe Repair.pdf
The Benefits and Techniques of Trenchless Pipe Repair.pdfThe Benefits and Techniques of Trenchless Pipe Repair.pdf
The Benefits and Techniques of Trenchless Pipe Repair.pdf
Pipe Restoration Solutions
 
addressing modes in computer architecture
addressing modes  in computer architectureaddressing modes  in computer architecture
addressing modes in computer architecture
ShahidSultan24
 
ASME IX(9) 2007 Full Version .pdf
ASME IX(9)  2007 Full Version       .pdfASME IX(9)  2007 Full Version       .pdf
ASME IX(9) 2007 Full Version .pdf
AhmedHussein950959
 
LIGA(E)11111111111111111111111111111111111111111.ppt
LIGA(E)11111111111111111111111111111111111111111.pptLIGA(E)11111111111111111111111111111111111111111.ppt
LIGA(E)11111111111111111111111111111111111111111.ppt
ssuser9bd3ba
 
Hybrid optimization of pumped hydro system and solar- Engr. Abdul-Azeez.pdf
Hybrid optimization of pumped hydro system and solar- Engr. Abdul-Azeez.pdfHybrid optimization of pumped hydro system and solar- Engr. Abdul-Azeez.pdf
Hybrid optimization of pumped hydro system and solar- Engr. Abdul-Azeez.pdf
fxintegritypublishin
 
Immunizing Image Classifiers Against Localized Adversary Attacks
Immunizing Image Classifiers Against Localized Adversary AttacksImmunizing Image Classifiers Against Localized Adversary Attacks
Immunizing Image Classifiers Against Localized Adversary Attacks
gerogepatton
 
DESIGN A COTTON SEED SEPARATION MACHINE.docx
DESIGN A COTTON SEED SEPARATION MACHINE.docxDESIGN A COTTON SEED SEPARATION MACHINE.docx
DESIGN A COTTON SEED SEPARATION MACHINE.docx
FluxPrime1
 
Event Management System Vb Net Project Report.pdf
Event Management System Vb Net  Project Report.pdfEvent Management System Vb Net  Project Report.pdf
Event Management System Vb Net Project Report.pdf
Kamal Acharya
 
MCQ Soil mechanics questions (Soil shear strength).pdf
MCQ Soil mechanics questions (Soil shear strength).pdfMCQ Soil mechanics questions (Soil shear strength).pdf
MCQ Soil mechanics questions (Soil shear strength).pdf
Osamah Alsalih
 

Recently uploaded (20)

Quality defects in TMT Bars, Possible causes and Potential Solutions.
Quality defects in TMT Bars, Possible causes and Potential Solutions.Quality defects in TMT Bars, Possible causes and Potential Solutions.
Quality defects in TMT Bars, Possible causes and Potential Solutions.
 
H.Seo, ICLR 2024, MLILAB, KAIST AI.pdf
H.Seo,  ICLR 2024, MLILAB,  KAIST AI.pdfH.Seo,  ICLR 2024, MLILAB,  KAIST AI.pdf
H.Seo, ICLR 2024, MLILAB, KAIST AI.pdf
 
power quality voltage fluctuation UNIT - I.pptx
power quality voltage fluctuation UNIT - I.pptxpower quality voltage fluctuation UNIT - I.pptx
power quality voltage fluctuation UNIT - I.pptx
 
Planning Of Procurement o different goods and services
Planning Of Procurement o different goods and servicesPlanning Of Procurement o different goods and services
Planning Of Procurement o different goods and services
 
Gen AI Study Jams _ For the GDSC Leads in India.pdf
Gen AI Study Jams _ For the GDSC Leads in India.pdfGen AI Study Jams _ For the GDSC Leads in India.pdf
Gen AI Study Jams _ For the GDSC Leads in India.pdf
 
TECHNICAL TRAINING MANUAL GENERAL FAMILIARIZATION COURSE
TECHNICAL TRAINING MANUAL   GENERAL FAMILIARIZATION COURSETECHNICAL TRAINING MANUAL   GENERAL FAMILIARIZATION COURSE
TECHNICAL TRAINING MANUAL GENERAL FAMILIARIZATION COURSE
 
一比一原版(SFU毕业证)西蒙菲莎大学毕业证成绩单如何办理
一比一原版(SFU毕业证)西蒙菲莎大学毕业证成绩单如何办理一比一原版(SFU毕业证)西蒙菲莎大学毕业证成绩单如何办理
一比一原版(SFU毕业证)西蒙菲莎大学毕业证成绩单如何办理
 
Forklift Classes Overview by Intella Parts
Forklift Classes Overview by Intella PartsForklift Classes Overview by Intella Parts
Forklift Classes Overview by Intella Parts
 
Architectural Portfolio Sean Lockwood
Architectural Portfolio Sean LockwoodArchitectural Portfolio Sean Lockwood
Architectural Portfolio Sean Lockwood
 
block diagram and signal flow graph representation
block diagram and signal flow graph representationblock diagram and signal flow graph representation
block diagram and signal flow graph representation
 
Nuclear Power Economics and Structuring 2024
Nuclear Power Economics and Structuring 2024Nuclear Power Economics and Structuring 2024
Nuclear Power Economics and Structuring 2024
 
The Benefits and Techniques of Trenchless Pipe Repair.pdf
The Benefits and Techniques of Trenchless Pipe Repair.pdfThe Benefits and Techniques of Trenchless Pipe Repair.pdf
The Benefits and Techniques of Trenchless Pipe Repair.pdf
 
addressing modes in computer architecture
addressing modes  in computer architectureaddressing modes  in computer architecture
addressing modes in computer architecture
 
ASME IX(9) 2007 Full Version .pdf
ASME IX(9)  2007 Full Version       .pdfASME IX(9)  2007 Full Version       .pdf
ASME IX(9) 2007 Full Version .pdf
 
LIGA(E)11111111111111111111111111111111111111111.ppt
LIGA(E)11111111111111111111111111111111111111111.pptLIGA(E)11111111111111111111111111111111111111111.ppt
LIGA(E)11111111111111111111111111111111111111111.ppt
 
Hybrid optimization of pumped hydro system and solar- Engr. Abdul-Azeez.pdf
Hybrid optimization of pumped hydro system and solar- Engr. Abdul-Azeez.pdfHybrid optimization of pumped hydro system and solar- Engr. Abdul-Azeez.pdf
Hybrid optimization of pumped hydro system and solar- Engr. Abdul-Azeez.pdf
 
Immunizing Image Classifiers Against Localized Adversary Attacks
Immunizing Image Classifiers Against Localized Adversary AttacksImmunizing Image Classifiers Against Localized Adversary Attacks
Immunizing Image Classifiers Against Localized Adversary Attacks
 
DESIGN A COTTON SEED SEPARATION MACHINE.docx
DESIGN A COTTON SEED SEPARATION MACHINE.docxDESIGN A COTTON SEED SEPARATION MACHINE.docx
DESIGN A COTTON SEED SEPARATION MACHINE.docx
 
Event Management System Vb Net Project Report.pdf
Event Management System Vb Net  Project Report.pdfEvent Management System Vb Net  Project Report.pdf
Event Management System Vb Net Project Report.pdf
 
MCQ Soil mechanics questions (Soil shear strength).pdf
MCQ Soil mechanics questions (Soil shear strength).pdfMCQ Soil mechanics questions (Soil shear strength).pdf
MCQ Soil mechanics questions (Soil shear strength).pdf
 

DESIGN AGAINST FLUCTUATING LOAD

  • 1. DESIGN OF MACHINE ELEMENTS DESIGN AGAINST FLUCTUATING LOADSDESIGN AGAINST FLUCTUATING LOADS Prepared by: PAVAN GANDHI (150053119005) PRIYANK GANDHI (150053119006) HARSH DHARAIYA (150053119007) DHARAMJEET JADEJA (150053119008)
  • 2. STRESS CONCENTRATION  Whenever a machine component changes the shape of its cross-section, the simple stress distribution no longer holds good. This irregularity in the stress distribution caused by abrupt changes of form is called stress concentration.  A stress concentration (stress raisers or stress risers) is a location in an object where stress is concentrated. An object is strongest when force is evenly distributed over its area, so a reduction in area, e.g., caused by a crack, results in a localized increase in stress.  A material can fail, via a propagating crack, when a concentrated stress exceeds the material's theoretical cohesive strength. The real fracture strength of a material is always lower than the theoretical value because most materials contain small cracks or contaminants that concentrate stress.  It occurs for all kinds of stresses in the presence of fillets, notches, holes, keyways, splines, surface roughness or scratches etc.
  • 3. THEORETICAL OR FORM STRESS CONCENTRATION FACTOR  The theoretical or form stress concentration factor is defined as the ratio of the maximum stress in a member (at a notch or a fillet) to the nominal stress at the same section based upon net area.  Mathematically, theoretical or form stress concentration factor,  The value of Kt depends upon the material and geometry of the part.
  • 4. FATIGUE STRESS CONCENTRATION FACTOR • When a machine member is subjected to cyclic or fatigue loading, the value of fatigue stress concentration factor shall be applied instead of theoretical stress concentration factor. • Mathematically, fatigue stress concentration factor,
  • 5. NOTCH SENSITIVITY  Notch Sensitivity: It may be defined as the degree to which the theoretical effect of stress concentration is actually reached.  Notch Sensitivity Factor “q”: Notch sensitivity factor is defined as the ratio of increase in the actual stress to the increase in the nominal stress near the discontinuity in the specimen. Where, Kf and Kt are the fatigue stress concentration factor and theoretical stress concentration factor.  The stress gradient depends mainly on the radius of the notch, hole or fillet and on the grain size of the material.
  • 6. METHODS TO REDUCE STRESS CONCENTRATION • The presence of stress concentration can not be totally eliminated but it may be reduced to some extent. • A device or concept that is useful in assisting a design engineer to visualize the presence of stress concentration and how it may be mitigated is that of stress flow lines. • The mitigation of stress concentration means that the stress flow lines shall maintain their spacing as far as possible. • Some of the changes adopted in the design in order to reduce the stress concentration are as follows: • Avoid abrupt changes in cross section • Place additional smaller discontinuities adjacent to discontinuity • Improve surface finish
  • 7.  In Fig. (a), we see that stress lines tend to bunch up and cut very close to the sharp re-entrant corner. In order to improve the situation, fillets may be provided, as shown in Fig. (b) and (c) to give more equally spaced flow lines.  It may be noted that it is not practicable to use large radius fillets as in case of ball and roller bearing mountings. In such cases, notches may be cut as shown in Fig. (d).
  • 8. • Following figures show the several ways of reducing the stress concentration in shafts and other cylindrical members with shoulders, holes and threads : • The stress concentration effects of a press fit may be reduced by making more gradual transition from the rigid to the more flexible shaft.
  • 9. FACTORS TO BE CONSIDERED WHILE DESIGNING MACHINE PARTS TO AVOID FATIGUE FAILURE • The following factors should be considered while designing machine parts to avoid fatigue failure: • The variation in the size of the component should be as gradual as possible. • The holes, notches and other stress raisers should be avoided. • The proper stress de-concentrators such as fillets and notches should be provided wherever necessary. • The parts should be protected from corrosive atmosphere. • A smooth finish of outer surface of the component increases the fatigue life. • The material with high fatigue strength should be selected. • The residual compressive stresses over the parts surface increases its fatigue strength.
  • 10. ENDURANCE LIMIT AND FATIGUE FAILURE  It has been found experimentally that when a material is subjected to repeated stresses, it fails at stresses below the yield point stresses. Such type of failure of a material is known as fatigue.  The failure is caused by means of a progressive crack formation which are usually fine and of microscopic size. The failure may occur even without any prior indication.  The fatigue of material is effected by the size of the component, relative magnitude of static and fluctuating loads and the number of load reversals.
  • 11.  A standard mirror polished specimen, as shown in figure is rotated in a fatigue testing machine while the specimen is loaded in bending.  As the specimen rotates, the bending stress at the upper fibers varies from maximum compressive to maximum tensile while the bending stress at the lower fibers varies from maximum tensile to maximum compressive.  In other words, the specimen is subjected to a completely reversed stress cycle. This is represented by a time-stress diagram as shown in Fig. (a).
  • 12.  Endurance or Fatigue limit (σe) is defined as maximum value of the completely reversed bending stress which a polished standard specimen can withstand without failure, for infinite number of cycles.  It may be noted that the term endurance limit is used for reversed bending only while for other types of loading, the term endurance strength may be used when referring the fatigue strength of the material.  It may be defined as the safe maximum stress which can be applied to the machine part working under actual conditions.  We have seen that when a machine member is subjected to a completely reversed stress, the maximum stress in tension is equal to the maximum stress in compression as shown in Fig.(a). In actual practice, many machine members undergo different range of stress than the completely reversed stress.  The stress verses time diagram for fluctuating stress having values σmin and σmax is shown in Fig. (c). The variable stress, in general, may be considered as a combination of steady (or mean or average) stress and a completely reversed stress component σv.
  • 13.  The following relations are derived from Fig. (c): σa = σmax σmin 2 Alternating stress Mean stress σm = σmax σmin 2 +
  • 14. FACTORS AFFECTING ENDURANCE LIMIT 1) SIZE EFFECT: •The strength of large members is lower than that of small specimens. •This may be due to two reasons. •The larger member will have a larger distribution of weak points than the smaller one and on an average, fails at a lower stress. •Larger members have larger surface Ares. This is important because the imperfections that cause fatigue failure are usually at the surface. Effect of size: •Increasing the size (especially section thickness) results in larger surface area and creation of stresses. •This factor leads to increase in the probability of crack initiation. •This factor must be kept in mind while designing large sized components.
  • 15.  2) SURFACE ROUGHNESS: • Almost all fatigue cracks nucleate at the surface of the members. • The conditions of the surface roughness and surface oxidation or corrosion are very important. • Experiments have shown that different surface finishes of the same material will show different fatigue strength. • Methods which Improve the surface finish and those which introduce compressive stresses on the surface will improve the fatigue strength. • Smoothly polished specimens have higher fatigue strength. • Surface treatments. Fatigue cracks initiate at free surface, treatments can be significant • Plating, thermal or mechanical means to induce residual stress.  3) EFFECT OF TEMPERATURE: • When the mechanical component operates above the room temperature, its ultimate tensile strength, and hence endurance limit decrease with increase in temperature.
  • 16.  4) Effect of metallurgical variables; • Fatigue strength generally increases with increase in UTS • Fatigue strength of quenched & tempered steels (tempered martensitic structure) have better fatigue strength • Finer grain size show better fatigue strength than coarser grain size. • Non-metallic inclusions either at surface or sub-surface reduces' the fatigue strength.
  • 17. S-N DIAGRAM  Fatigue strength of material is determined by R.R. Moore rotating beam machine. The surface is polished in the axial direction. A constant bending load is applied.
  • 18.  A record is kept of the number of cycles required to produce failure at a given stress, and the results are plotted in stress-cycle curve as shown in figure.  A little consideration will show that if the stress is kept below a certain value the material will not fail whatever may be the number of cycles.  This stress, as represented by dotted line, is known as endurance or fatigue limit (σe).  It is defined as maximum value of the completely reversed bending stress which a polished standard specimen can withstand without failure, for infinite number of cycles (usually 107 cycles).
  • 19. RELATIONSHIP BETWEEN ENDURANCE LIMIT AND ULTIMATE STRENGTH Se =′ 0.5Sut 100 ksi 700 MPa Sut ≤ 200 ksi (1400 MPa) Sut > 200 ksi Sut > 1400 MPa Steel 0.4Sut Se =′ Sut < 60 ksi (400 MPa) Sut ≥ 60 ksi24 ksi 160 MPa Sut < 400 MPa Cast iron Cast iron
  • 20. RELATIONSHIP BETWEEN ENDURANCE LIMIT AND ULTIMATE STRENGTH Se =′ 0.4Sut 19 ksi 130 MPa Sut < 48 ksi (330 MPa) Sut ≥ 48 ksi Sut ≥ 330 MPa Aluminum For N = 5x10⁸ cycle Copper alloys Se =′ 0.4Sut 14 ksi 100 MPa Sut < 40 ksi (280 MPa) Sut ≥ 40 ksi Sut ≥ 280 MPa Copper alloys For N = 5x10⁸ cycle
  • 21. CORRECTION FACTORS FOR SPECIMEN’S ENDURANCE LIMIT Se = kakbkckdkekfSe’ Where, •Se = endurance limit of component •Se’ = endurance limit experimental •ka = surface finish factor (machined parts have different finish) •kb = size factor (larger parts greater probability of finding defects) •kc = reliability / statistical scatter factor (accounts for random variation) •kd = loading factor (differences in loading types) •ke = operating T factor (accounts for diff. in working T & room T) •kf = stress concentration factor
  • 22. CORRECTION FACTORS FOR SPECIMEN’S ENDURANCE LIMIT  Surface Factor, Ka The rotating beam test specimen has a polished surface. Most components do not have a polished surface. Scratches and imperfections on the surface act like a stress raisers and reduce the fatigue life of a part. Use either the graph or the equation with the table shown below. ka= A (Sut)b
  • 23.  Size factor, kb • Larger parts fail at lower stresses than smaller parts. This is mainly due to the higher probability of flaws being present in larger components. • The diameter of the rotating beam specimen is 7.62 mm. if the diameter or size of the component is more, the surface area is more, resulting in greater number of surface defect. Hence the endurance limit of component reduce with the increase in size of component. • For solid round cross section d ≤ 0.3 in. (8 mm) kb = 1 0.3 in. < d ≤ 10 in. kb = .869(d)-0.097 8 mm < d ≤ 250 mm kb = 1.189(d)-0.097 If the component is larger than 10 in., use kb = .6
  • 24.  Reliability factor, kg • The reliability factor is depends upon the reliability requirement of the mechanical component. • The reliability correction factor accounts for the scatter and uncertainty of material properties (endurance limit).
  • 25. • Load factor, kc Pure bending kc = 1 Pure axial kc = 0.7 Combined loading kc = 1 Pure torsion kc = 1 if von Mises stress is used, use 0.577 if von Mises stress is NOT used.  Temperature factor • Accounts for the difference between the test temperature and operating temperature of the component • For carbon and alloy steels, fatigue strength not affected by operating temperature – 45 to 4500 C ke = 1 • At higher operating temperature • ke = 1 – 5800( T – 450 ) for T between 450 and 550o C, or • ke = 1 – 3200( T – 840 ) for T between 840 and 1020o F
  • 26. DESIGN PROCESS – FULLY REVERSED LOADING FOR INFINITE LIFE • Determine the maximum alternating applied stress, σa, in terms of the size and cross sectional profile • Select material → Sy, Sut • Use the design equation to calculate the size • Se • Kf σa =• n • Choose a safety factor → n • Determine all modifying factors and calculate the endurance limit of the component → Se • Determine the fatigue stress concentration factor, Kf • Investigate different cross sections (profiles), optimize for size or weight • You may also assume a profile and size, calculate the alternating stress and determine the safety factor. Iterate until you obtain the desired safety factor
  • 27. DESIGN FOR FINITE LIFE Sn = a (N)b equation of the fatigue line N S Se 106 103 A B N S Sf 5x10⁸ 103 A B Point A Sn = .9Sut N = 103 Point A Sn = .9Sut N = 103 Point B Sn = Sf N = 5x10⁸ Point B Sn = Se N = 106
  • 28. DESIGN FOR FINITE LIFE Sn = a (N)b log Sn = log a + b log N Apply conditions for point A and B to find the two constants “a” and “b” log .9Sut = log a + b log 103 log Se = log a + b log 106 a = (.9Sut) 2 Se b = .9Sut Se 1 3 log Sn Kf σa = n Design equation Calculate Sn and replace Se in the design equation Sn = Se ( N 106 ) ⅓ ( Se .9Sut )log
  • 29. FLUCTUATING STRESSES  The failure points from fatigue tests made with different steels and combinations of mean and variable stresses are plotted in figure as functions of stress amplitude(σa) and mean stress (σm).  The most significant observation is that, in general, the failure point is little related to the mean stress when it is compressive but is very much a function of the mean stress when it is tensile.  In practice, this means that fatigue failures are rare when the mean stress is compressive (or negative). Therefore, the greater emphasis must be given to the combination of a variable stress and a steady (or mean) tensile stress. Mean stress Alternating stress σm σa Se SySoderberg line Sut Goodman line Gerber curve Sy Yield line
  • 30. GOODMAN METHOD FOR COMBINATION OF STRESSES: • A straight line connecting the endurance limit (σe) and the ultimate strength (σu), as shown by line AB in figure given below follows the suggestion of Goodman. • A Goodman line is used when the design is based on ultimate strength and may be used for ductile or brittle materials.
  • 31. Now from similar triangles COD and PQD,
  • 32. SODERBERG METHOD FOR COMBINATION OF STRESSES  A straight line connecting the endurance limit (σe) and the yield strength (σy), as shown by the line AB in following figure, follows the suggestion of Soderberg line.  This line is used when the design is based on yield strength. the line AB connecting σe and σy, as shown in following figure, is called Soderberg's failure stress line.  If a suitable factor of safety (F.S.) is applied to the endurance limit and yield strength, a safe stress line CD may be drawn parallel to the line AB.
  • 33. MODIFIED GOODMAN DIAGRAM:  In the design of components subjected to fluctuating stresses, the Goodman diagram is slightly modified to account for the yielding failure of the components, especially, at higher values of the mean stresses.  The diagram known as modified Goodman diagram and is most widely used in the design of the components subjected to fluctuating stresses.
  • 34. MODIFIED GOODMAN DIAGRAM FOR FLUCTUATING AXIAL AND BENDING STRESSES +σm σa Sut Safe zone - σm C Sy Safe zone Se - Syc Finite life Sn 1= Sut σa σm + Fatigue, σm > 0Fatigue, σm ≤ 0 σa = Se nf σa + σm = Sy ny Yield σa + σm = Sy ny Yield nfSe 1 = Sut σa σm + Infinite life
  • 35. DESIGN EXAMPLE R1 R2 10,000 lb. 6˝6˝12˝ D = 1.5dd r (fillet radius) = .1d A rotating shaft is carrying 10,000 lb force as shown. The shaft is made of steel with Sut = 120 ksi and Sy = 90 ksi. The shaft is rotating at 1150 rpm and has a machine finish surface. Determine the diameter, d, for 75 minutes life. Use safety factor of 1.6 and 50% reliability. Calculate the support forces, R1 = 2500, R2 = 7500 lb. A The critical location is at the fillet, MA = 2500 x 12 = 30,000 lb-in σa =Calculate the alternating stress, Mc I = 32M πd 3 = 305577 d 3 σm = 0 Determine the stress concentration factor r d = .1 D d = 1.5 Kt = 1.7
  • 36. DESIGN EXAMPLE Assume d = 1.0 in Using r = .1 and Sut = 120 ksi, q (notch sensitivity) = .85 Kf = 1 + (Kt – 1)q = 1 + .85(1.7 – 1) = 1.6 Calculate the endurance limit Cload = 1 (pure bending) Crel = 1 (50% rel.) Ctemp= 1 (room temp) Csurf = A (Sut)b = 2.7(120) -.265 = .759 0.3 in. < d ≤ 10 in. Csize = .869(d)-0.097 = .869(1) -0.097 = .869 Se = Cload Csize Csurf Ctemp Crel (Se) = (.759)(.869)(.5x120) = 39.57 ksi′
  • 37. DESIGN EXAMPLE Design life, N = 1150 x 75 = 86250 cycles Sn = Se ( N 106 ) ⅓ ( Se .9Sut )log Sn = 39.57 ( 86250 106 ) ⅓ ( 39.57 .9x120 )log = 56.5 ksi σa = 305577 d 3 = 305.577 ksi n= Sn Kfσa = 56.5 1.6x305.577 = .116 < 1.6 So d = 1.0 in. is too small Assume d = 2.5 in All factors remain the same except the size factor and notch sensitivity. Using r = .25 and Sut = 120 ksi, q (notch sensitivity) = .9 Kf = 1 + (Kt – 1)q = 1 + .9(1.7 – 1) = 1.63 Csize = .869(d)-0.097 = .869(2.5) -0.097 = .795 Se = 36.2 ksi→
  • 38. DESIGN EXAMPLE σa = 305577 (2.5)3 = 19.55 ksi n = Sn Kfσa = 53.35 1.63x19.55 = 1.67 ≈ 1.6 d = 2.5 in. Check yielding n = Sy Kfσmax = 90 1.63x19.55 = 2.8 > 1.6 okay Se = 36.2 ksi Sn = 53.35 ksi→