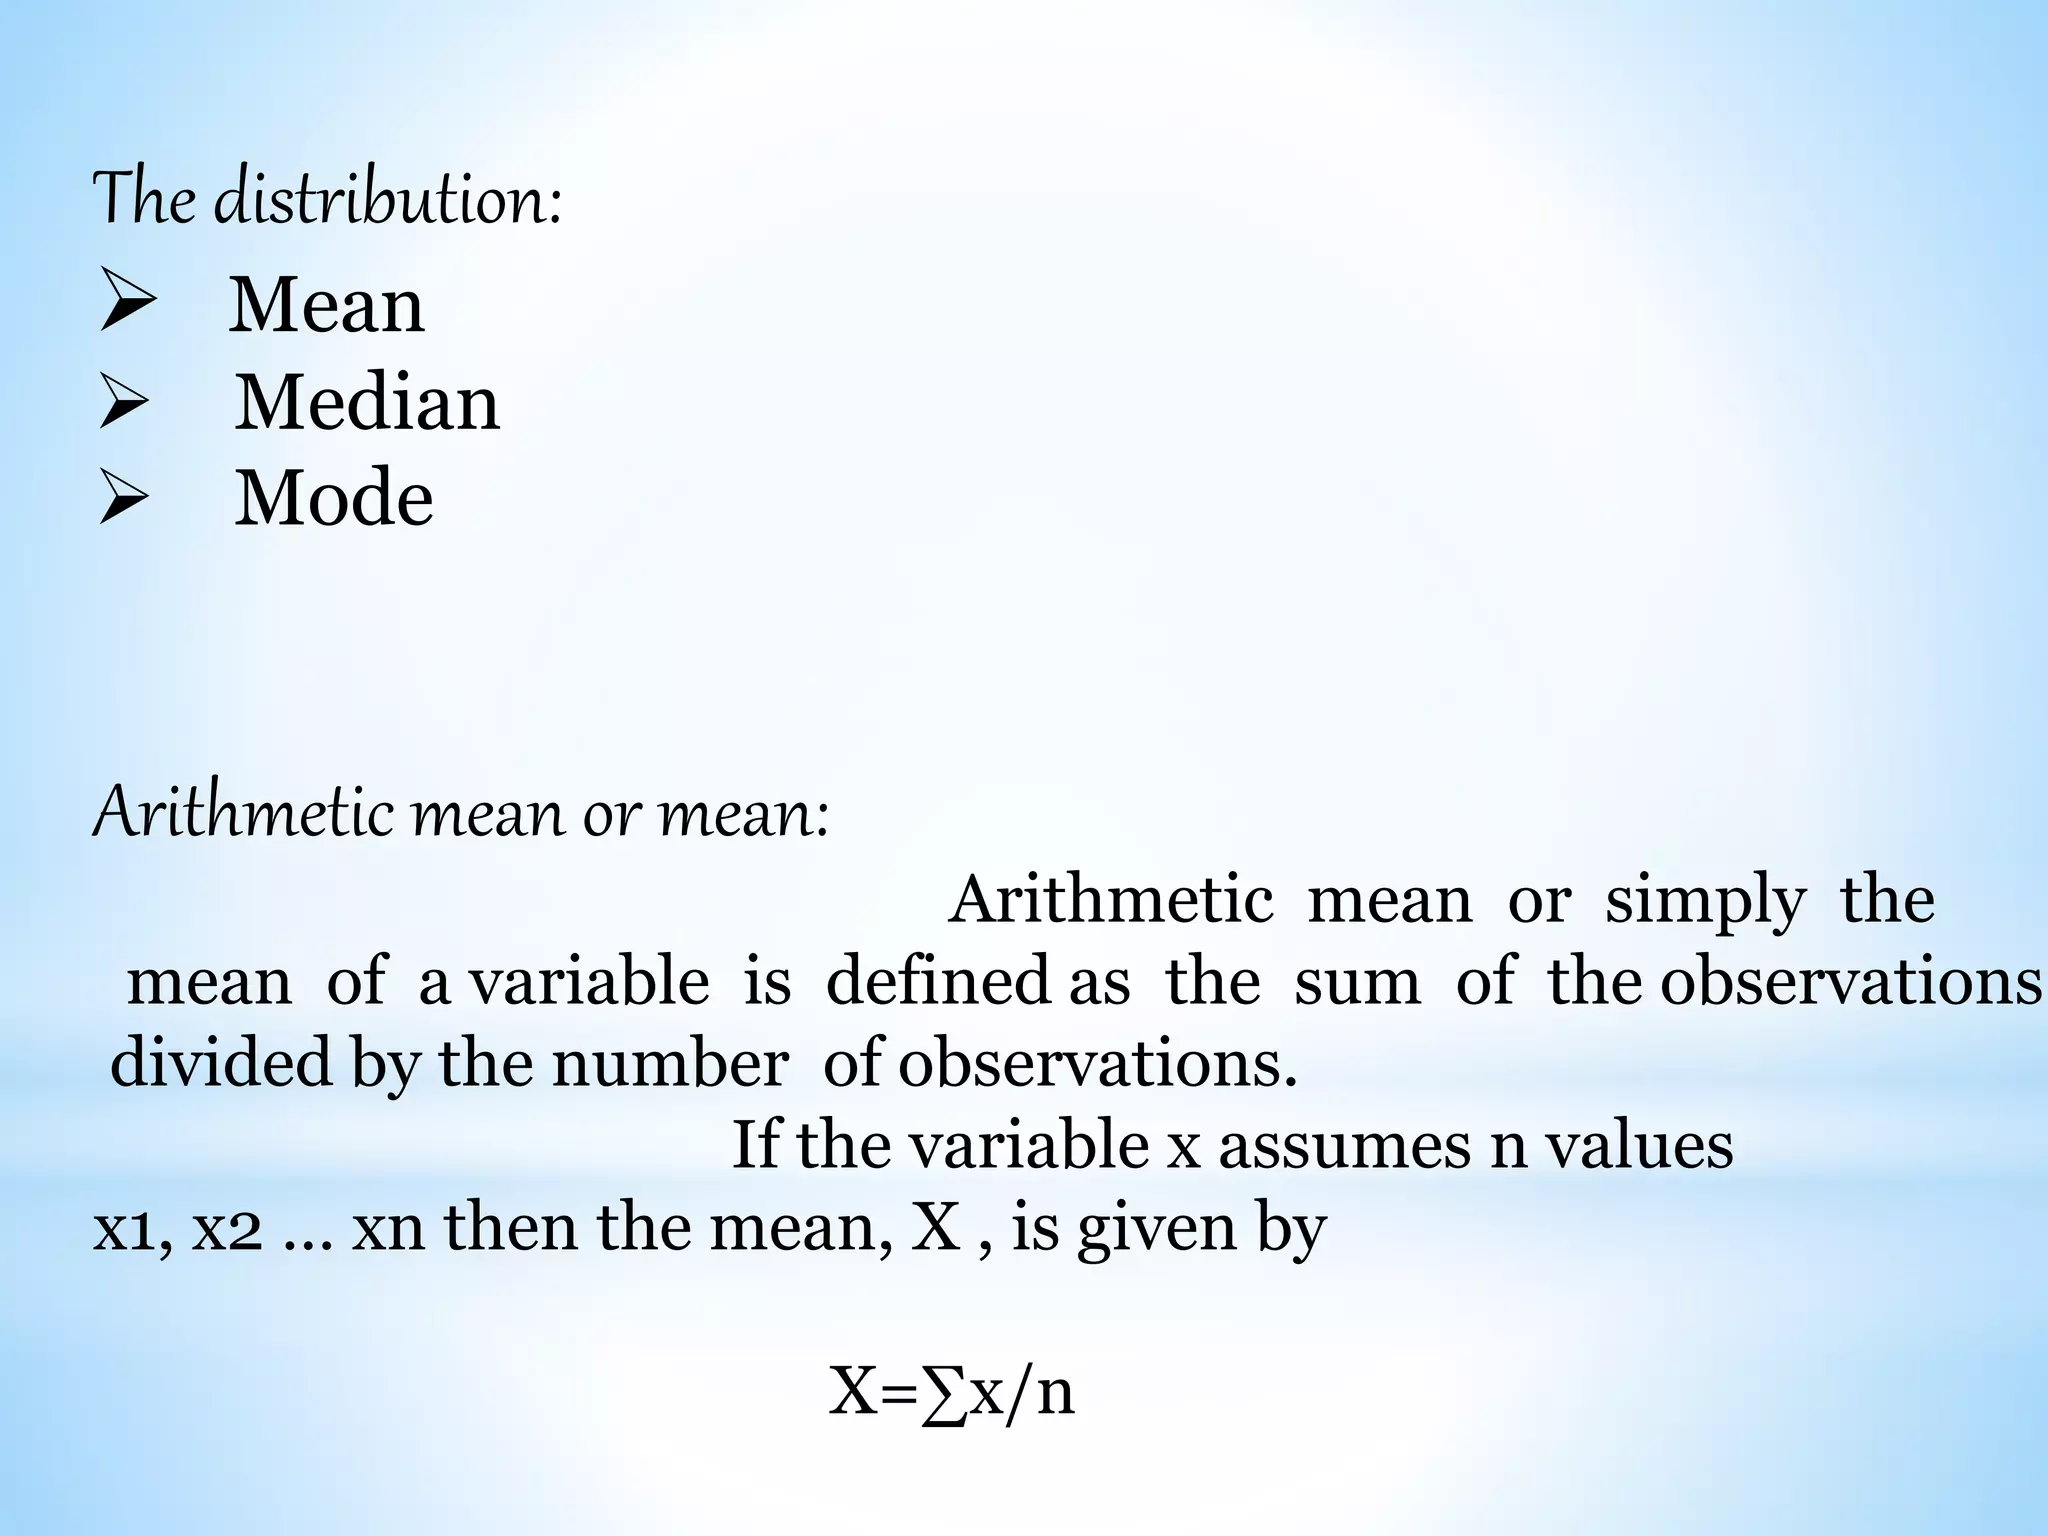
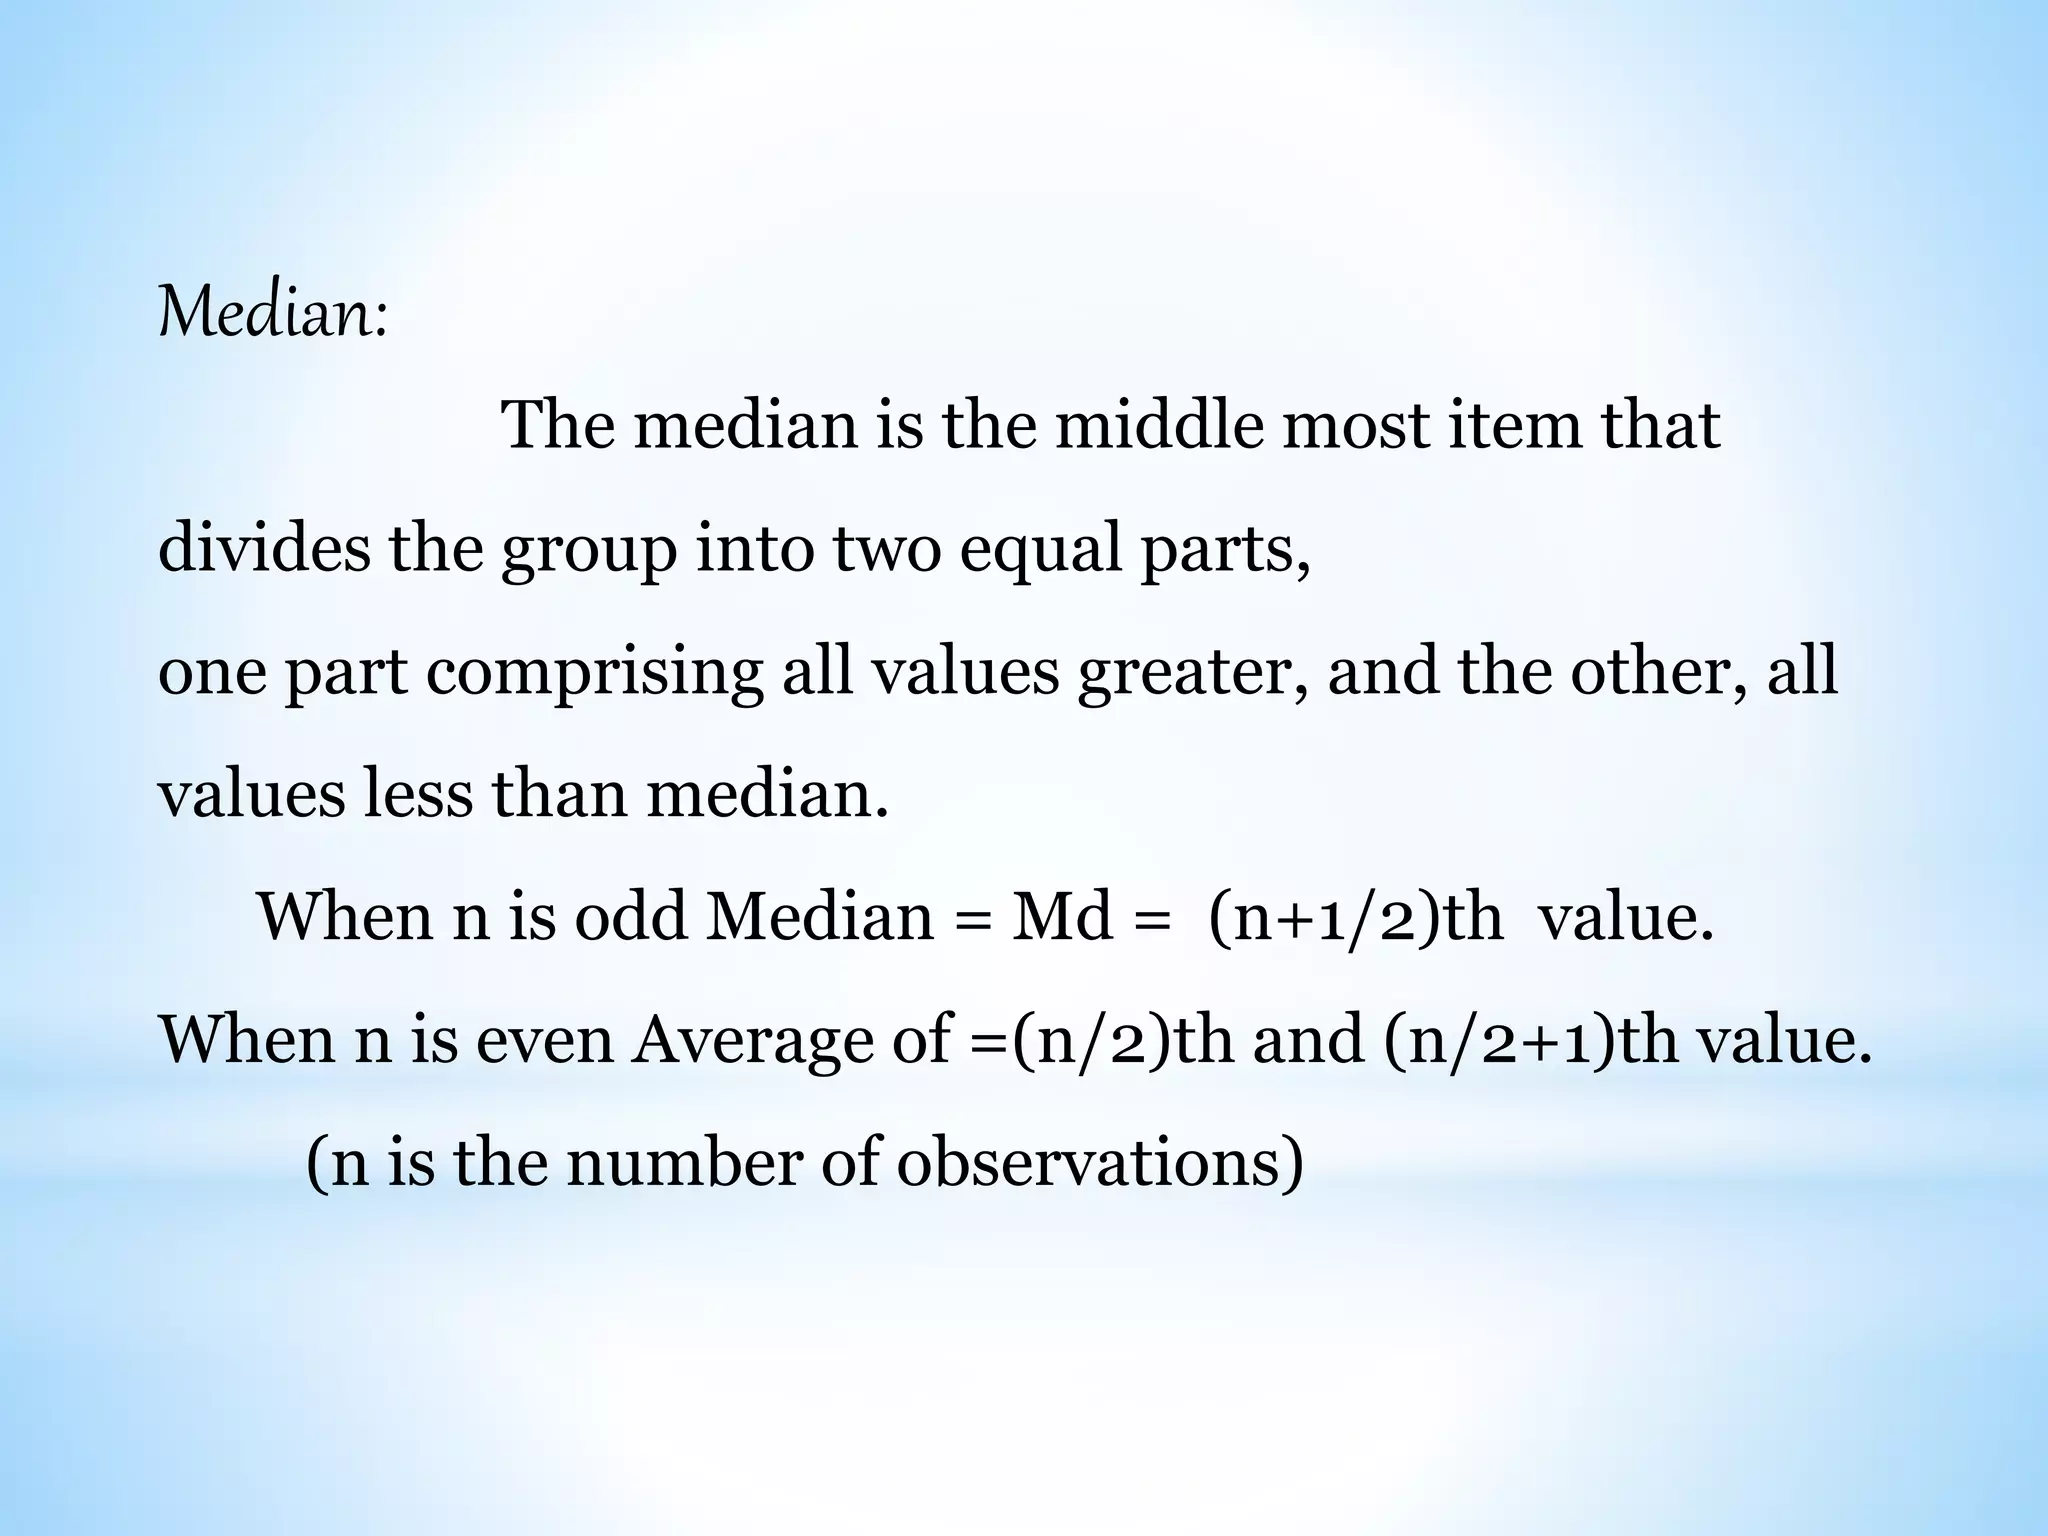
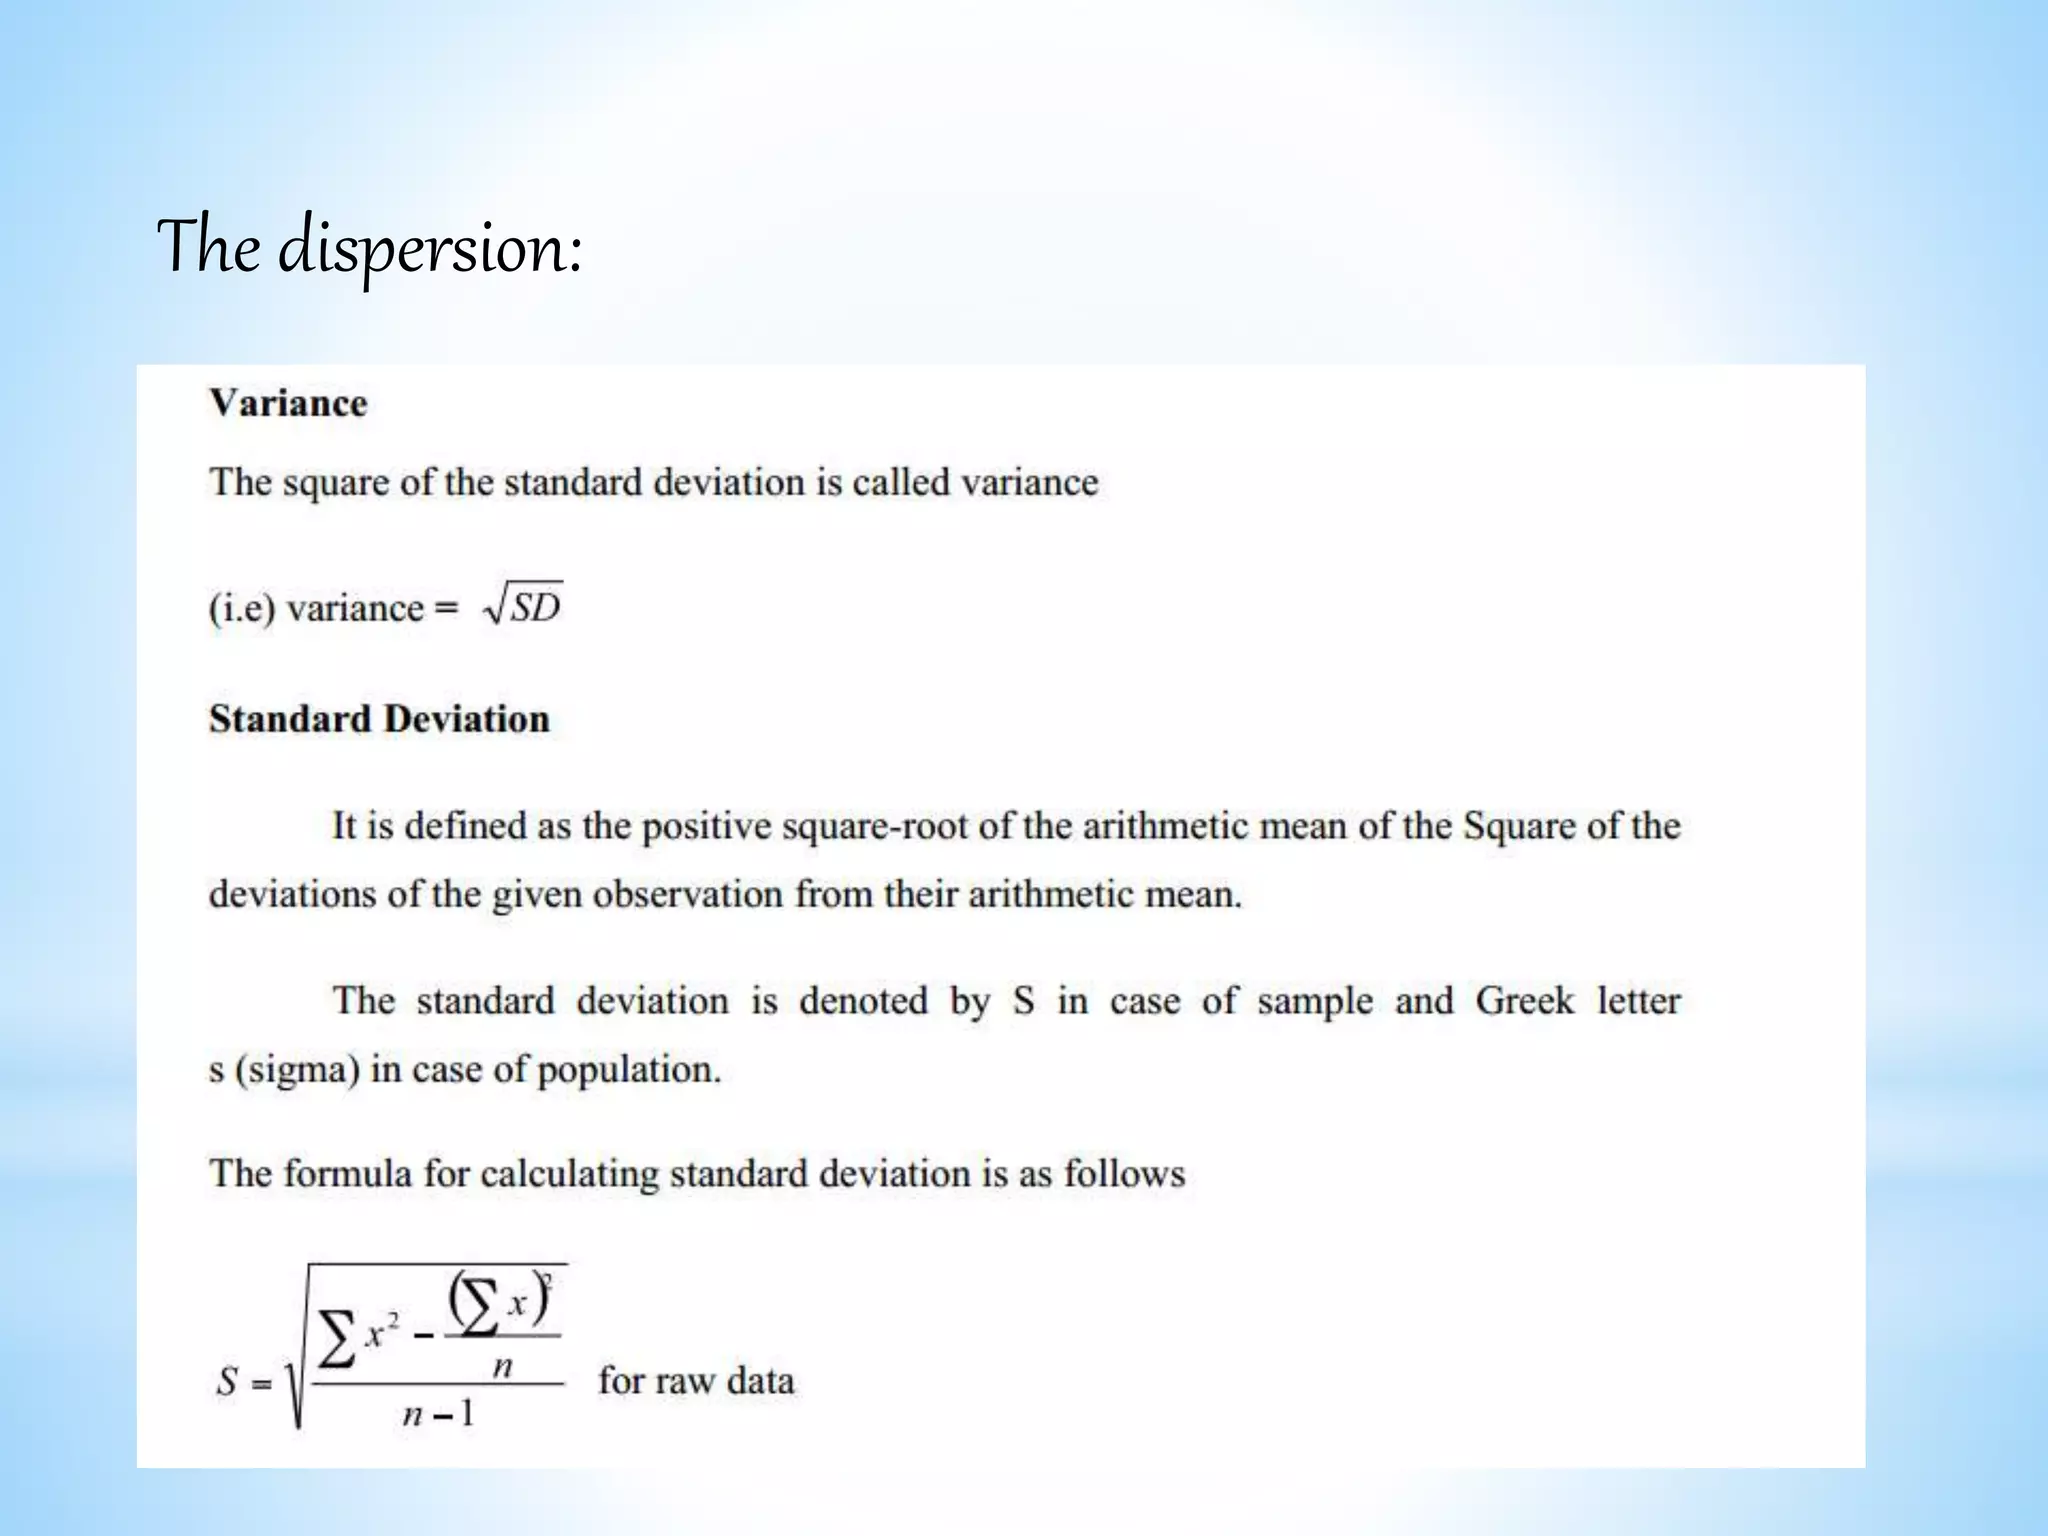
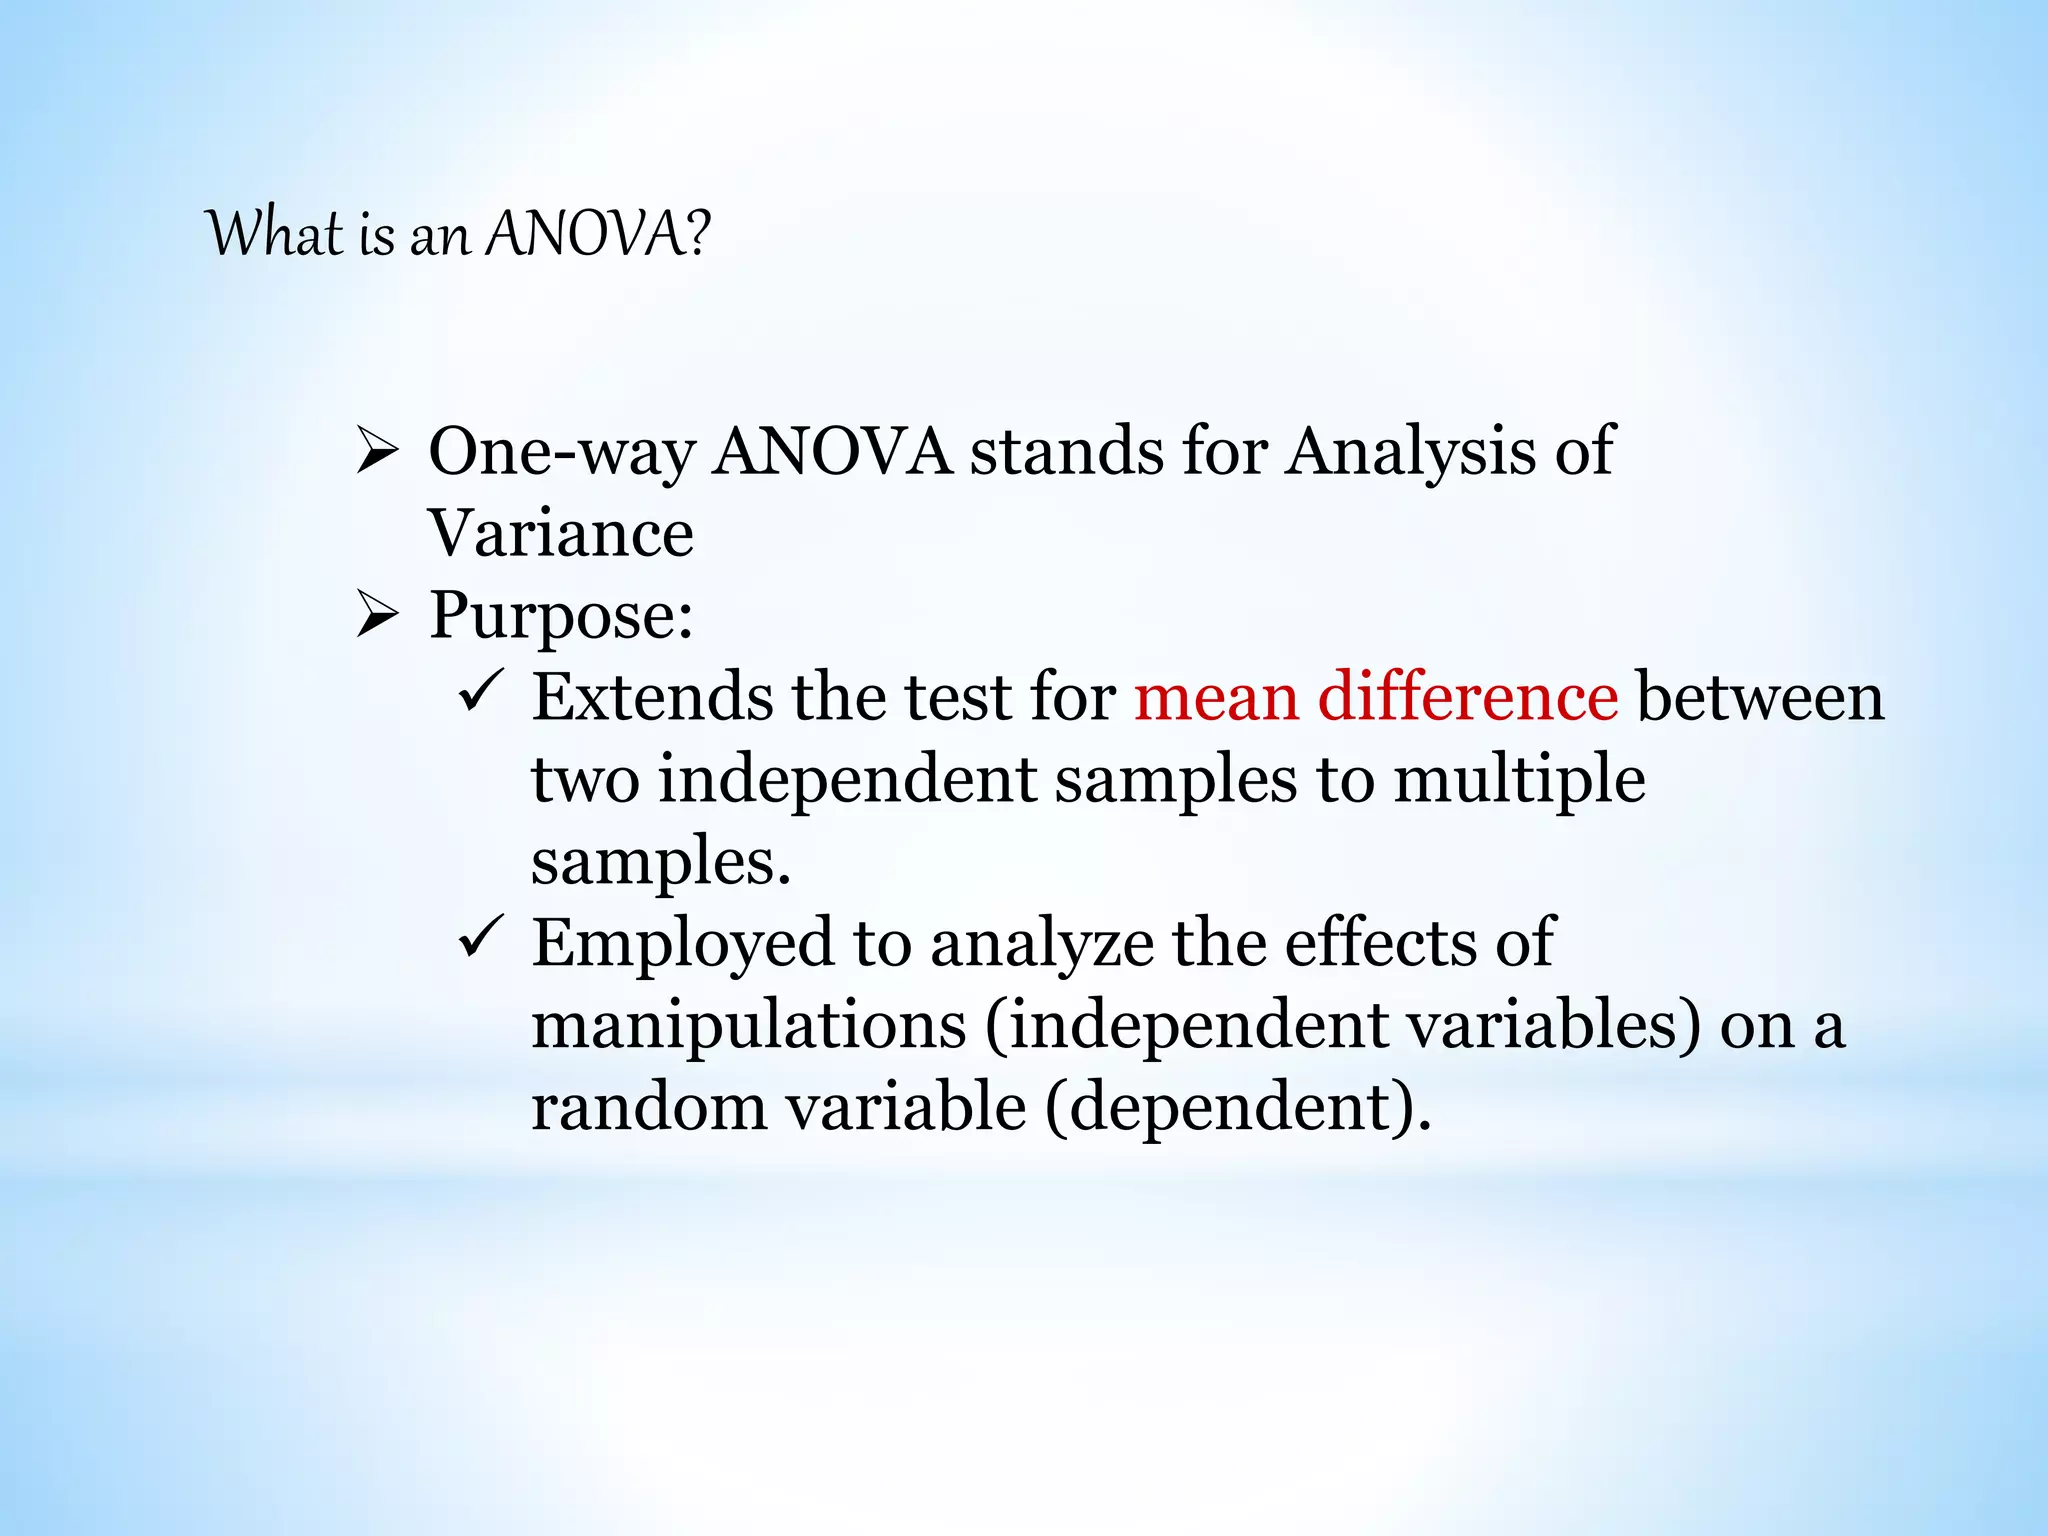
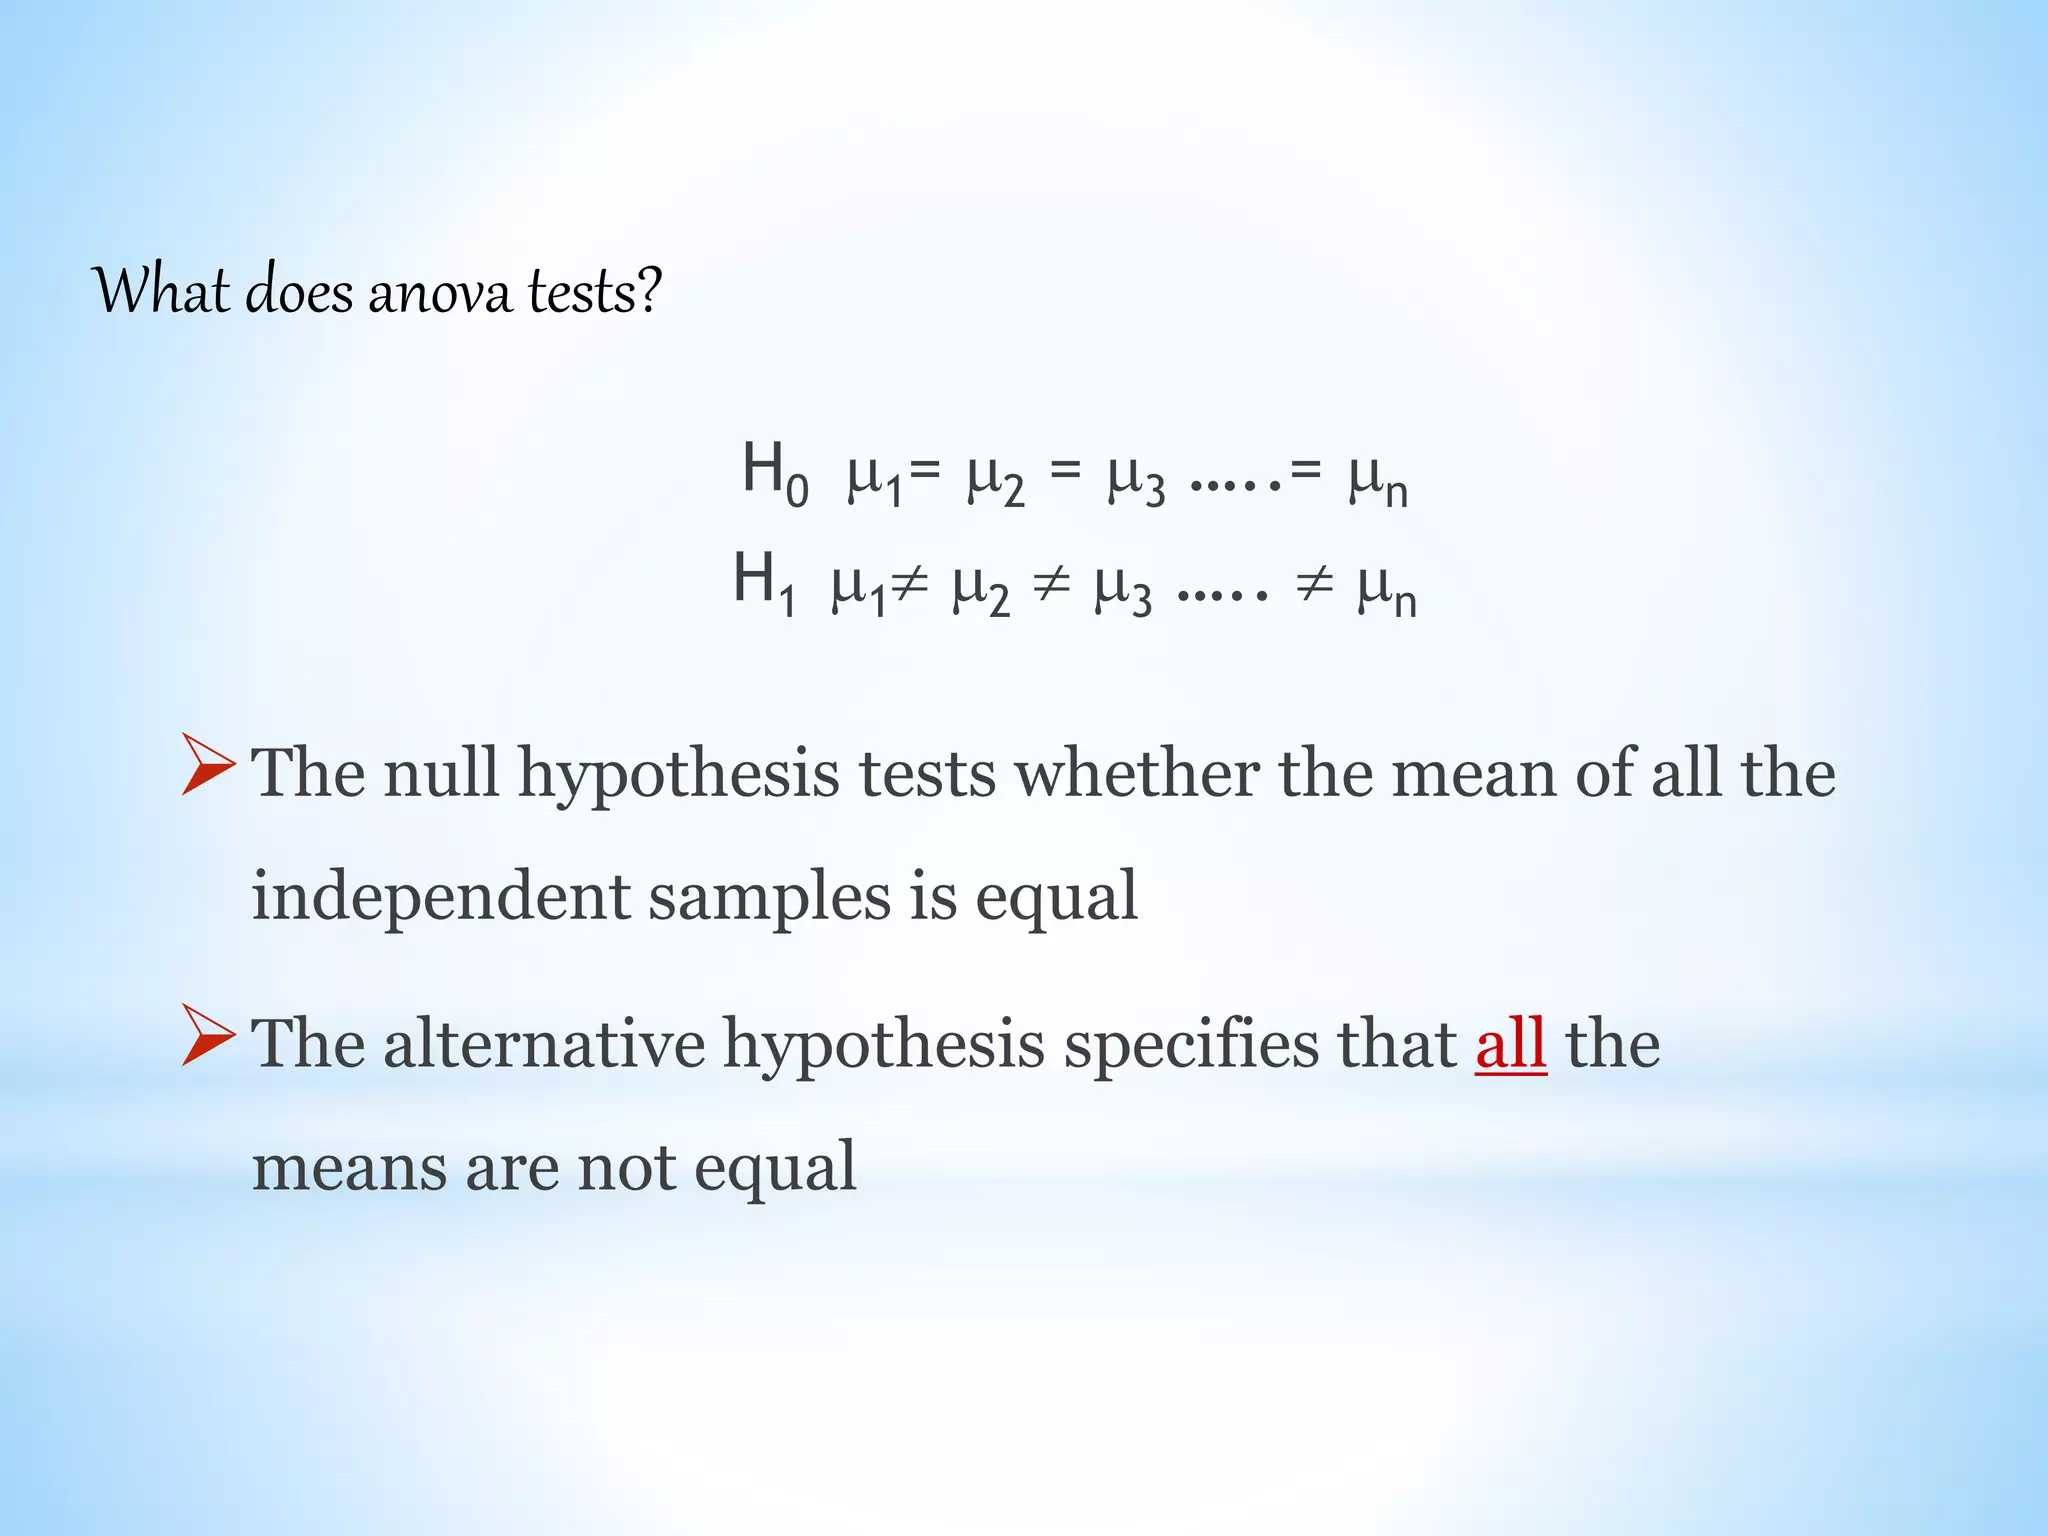
Descriptive statistics and anova analysis
Descriptive statistics:
 Summarization of a collection of data in a clear and
understandable way.
 the most basic form of statistics.
 lays the foundation for all statistical knowledge.
univariate analysis
The distribution
The dispersion
 bivariate and multivariate analysis
Use in statistics:
The distribution:
 Mean
 Median
 Mode
Arithmetic mean or mean:
Arithmetic mean or simply the
mean of a variable is defined as the sum of the observations
divided by the number of observations.
If the variable x assumes n values
x1, x2 … xn then the mean, X , is given by
X=∑x/n
Median:
The median is the middle most item that
divides the group into two equal parts,
one part comprising all values greater, and the other, all
values less than median.
When n is odd Median = Md = (n+1/2)th value.
When n is even Average of =(n/2)th and (n/2+1)th value.
(n is the number of observations)
Mode:
The mode refers to that value in a distribution,
which occur most frequently.
The dispersion:
Anova analysis
What is an ANOVA?
 One-way ANOVA stands for Analysis of
Variance
 Purpose:
 Extends the test for mean difference between
two independent samples to multiple
samples.
 Employed to analyze the effects of
manipulations (independent variables) on a
random variable (dependent).
Dependent variable:
the variable we are trying to explain, also
known as response variable (Y).
Independent variable:
also known as explanatory variables (X).
definitions:
H0 1= 2 = 3 …..= n
H1 1 2  3 …..  n
The null hypothesis tests whether the mean of all the
independent samples is equal
The alternative hypothesis specifies that all the
means are not equal
What does anova tests?
Thank you

Descriptive statistics and anova analysis

  • 1.
  • 2.
    Descriptive statistics:  Summarizationof a collection of data in a clear and understandable way.  the most basic form of statistics.  lays the foundation for all statistical knowledge.
  • 3.
    univariate analysis The distribution Thedispersion  bivariate and multivariate analysis Use in statistics:
  • 4.
    The distribution:  Mean Median  Mode Arithmetic mean or mean: Arithmetic mean or simply the mean of a variable is defined as the sum of the observations divided by the number of observations. If the variable x assumes n values x1, x2 … xn then the mean, X , is given by X=∑x/n
  • 5.
    Median: The median isthe middle most item that divides the group into two equal parts, one part comprising all values greater, and the other, all values less than median. When n is odd Median = Md = (n+1/2)th value. When n is even Average of =(n/2)th and (n/2+1)th value. (n is the number of observations)
  • 6.
    Mode: The mode refersto that value in a distribution, which occur most frequently.
  • 7.
  • 8.
  • 9.
    What is anANOVA?  One-way ANOVA stands for Analysis of Variance  Purpose:  Extends the test for mean difference between two independent samples to multiple samples.  Employed to analyze the effects of manipulations (independent variables) on a random variable (dependent).
  • 10.
    Dependent variable: the variablewe are trying to explain, also known as response variable (Y). Independent variable: also known as explanatory variables (X). definitions:
  • 11.
    H0 1= 2= 3 …..= n H1 1 2  3 …..  n The null hypothesis tests whether the mean of all the independent samples is equal The alternative hypothesis specifies that all the means are not equal What does anova tests?
  • 12.