What is ANOVA?????
ANOVA is used when multiple sample cases
are involved.
ANOVA can be used in situations where
there are two or more means being
compared
Using this technique, one can draw
inferences about whether the samples
have been drawn from populations having
the same mean.
3.
Professor R.A.Fisher was the first man to use the
term ‘Variance’* and, in fact, it was he who
developed a very elaborate theory concerning
ANOVA, explaining its usefulness in practical field.
* Variance is described as the mean of the squares of
deviations taken from the mean of the given series of
data.
It is a frequently used measure of variation.
Its square root is known as standard deviation, i.e.,
Standard deviation = .
4.
ANOVA isessentially a procedure for testing
the difference among different groups of
data for homogeneity.
“The essence of ANOVA is that the total
amount of variation in a set of data is
broken down into two types, that amount
which can be attributed to chance and that
amount which can be attributed to specified
causes.”
There may be variation between samples
and also within sample items.
5.
In ANOVA,we compare the between-group
variation with the within-group variation to assess
whether there is a difference in the population
means.
Thus by comparing these two measures of variance
(spread) with one another, we are able to detect if
there are true differences among the underlying
group population means.
6.
What is thepurpose of ANOVA?
The purpose of ANOVA is to
determine whether the mean
differences that are obtained for
sample data are sufficiently large to
justify a conclusion that there are
mean differences between the
populations from which the
samples were obtained.
7.
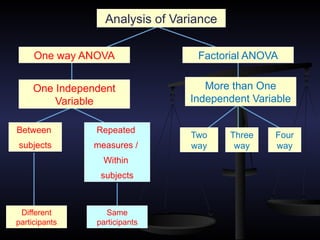
Analysis of Variance
Oneway ANOVA Factorial ANOVA
One Independent
Variable
More than One
Independent Variable
Two
way
Three
way
Four
way
Between
subjects
Repeated
measures /
Within
subjects
Different
participants
Same
participants
One-way ANOVA
Underthe one-way ANOVA, we consider
only one factor/independent variable
and then observe the factor in order to
know several possible types of samples
can occur within that factor.
We then determine if there are
differences within that factor.
10.
One-Way ANOVA
Theone-way analysis of variance
is used to test the claim that three
or more population means are
equal
This is an extension of the two
independent samples t-test
11.
One-Way ANOVA
Theresponse variable is the variable
we’re comparing
The factor variable is the categorical
variable being used to define the groups
We will assume k samples (groups)
The one-way is because each value is
classified in exactly one way
Examples include comparisons by gender,
motivation, grade, intelligence, etc.
12.
One-Way ANOVA: Assumption
Conditions or Assumptions
The data are randomly sampled
The variances of each sample
are assumed equal/homogenous
The data are normally distributed
13.
One-Way ANOVA:
Research Questions
Do these three samples
differ enough from each
other to reject the null
hypothesis that type of
instruction has no effect on
mean test performance?
14.
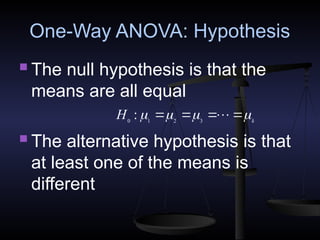
One-Way ANOVA: Hypothesis
The null hypothesis is that the
means are all equal
The alternative hypothesis is that
at least one of the means is
different
0 1 2 3
: k
H
15.
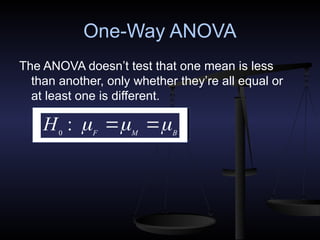
One-Way ANOVA
The ANOVAdoesn’t test that one mean is less
than another, only whether they’re all equal or
at least one is different.
0
: F M B
H
16.
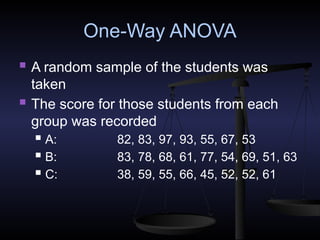
One-Way ANOVA
Arandom sample of the students was
taken
The score for those students from each
group was recorded
A: 82, 83, 97, 93, 55, 67, 53
B: 83, 78, 68, 61, 77, 54, 69, 51, 63
C: 38, 59, 55, 66, 45, 52, 52, 61
17.
The simple wayof
computing the data is
using SPSS
application, shown
right after