Download to read offline
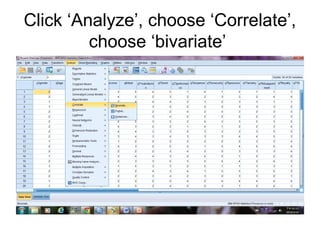


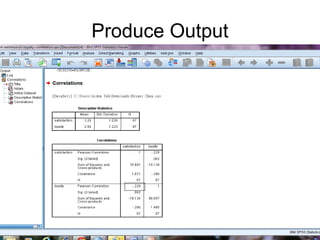
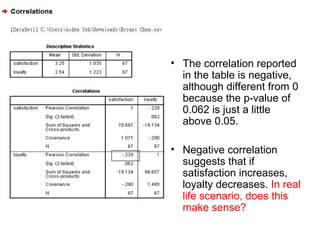
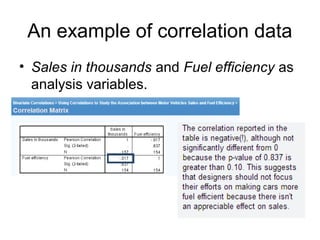
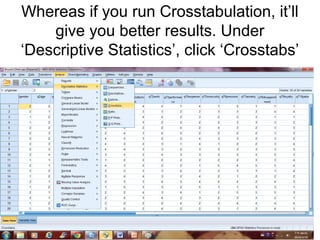

This document discusses correlation analysis and provides instructions on how to perform bivariate correlation in a statistics program. It analyzes the correlation between two variables, satisfaction and loyalty, finding a negative correlation where increased satisfaction is linked to decreased loyalty. It questions whether this negative correlation makes logical sense. The document also provides an example of correlating sales and fuel efficiency data and notes that crosstabulation may provide better results than correlation analysis alone.