Tech Report, 07 Apr 2010
•
0 likes•76 views

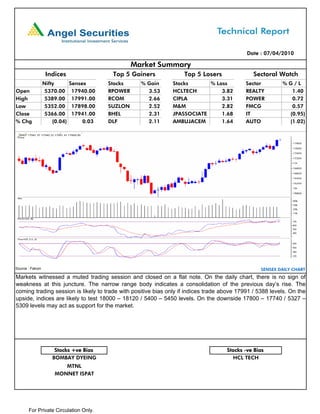
The market indices ended flat, with the Nifty closing at 5366 and Sensex at 17941. Top gainers during the day were RPOWER, RCOM and SUZLON, while top losers were HCLTECH, CIPLA and M&M. Most sectors closed positive with REALTY and POWER gaining over 1% and 0.7% respectively, while IT and AUTO lost around 1%. The document provides analysis of support and resistance levels for the indices and various stocks. It suggests the market may trade with a positive bias if indices remain above key resistance levels.

Recommended
More Related Content
What's hot
What's hot (20)
Viewers also liked
Viewers also liked (19)
Similar to Tech Report, 07 Apr 2010
Similar to Tech Report, 07 Apr 2010 (19)
More from Angel Broking
More from Angel Broking (20)
Tech Report, 07 Apr 2010
- 1. Date : 07/04/2010 Market Summary Indices Top 5 Gainers Top 5 Losers Sectoral Watch Nifty Sensex Stocks % Gain Stocks % Loss Sector %G/L Open 5370.00 17940.00 RPOWER 3.53 HCLTECH 3.82 REALTY 1.40 High 5389.00 17991.00 RCOM 2.66 CIPLA 3.31 POWER 0.72 Low 5352.00 17898.00 SUZLON 2.52 M&M 2.82 FMCG 0.57 Close 5366.00 17941.00 BHEL 2.31 JPASSOCIATE 1.68 IT (0.95) % Chg (0.04) 0.03 DLF 2.11 AMBUJACEM 1.64 AUTO (1.02) Source : Falcon SENSEX DAILY CHART Markets witnessed a muted trading session and closed on a flat note. On the daily chart, there is no sign of weakness at this juncture. The narrow range body indicates a consolidation of the previous day’s rise. The coming trading session is likely to trade with positive bias only if indices trade above 17991 / 5388 levels. On the upside, indices are likely to test 18000 – 18120 / 5400 – 5450 levels. On the downside 17800 – 17740 / 5327 – 5309 levels may act as support for the market. Stocks +ve Bias Stocks -ve Bias BOMBAY DYEING HCL TECH MTNL MONNET ISPAT For Private Circulation Only.
- 2. PIVOTS Stocks Close S2 S1 Pivot R1 R2 SENSEX 17941.00 17850.00 17896.00 17944.00 17989.00 18037.00 NIFTY 5366.00 5332.00 5349.00 5369.00 5386.00 5406.00 ABB 841.00 824.00 833.00 845.00 854.00 866.00 ACC 951.00 933.00 942.00 951.00 960.00 969.00 AMBUJACEM 117.00 114.00 116.00 117.00 119.00 120.00 AXISBANK 1175.00 1157.00 1166.00 1175.00 1184.00 1193.00 BHARTIARTL 316.00 309.00 313.00 316.00 320.00 323.00 BHEL 2521.00 2433.00 2477.00 2505.00 2549.00 2576.00 BPCL 507.00 498.00 503.00 510.00 514.00 522.00 CAIRN 310.00 305.00 307.00 311.00 314.00 318.00 CIPLA 338.00 329.00 334.00 343.00 348.00 357.00 DLF 329.00 320.00 324.00 328.00 332.00 335.00 GAIL 417.00 405.00 411.00 415.00 421.00 425.00 GRASIM 2813.00 2779.00 2796.00 2812.00 2829.00 2845.00 HCLTECH 347.00 334.00 341.00 352.00 358.00 369.00 HDFC 2825.00 2754.00 2790.00 2812.00 2848.00 2870.00 HDFCBANK 1933.00 1912.00 1922.00 1936.00 1947.00 1961.00 HEROHONDA 2039.00 1999.00 2019.00 2049.00 2069.00 2099.00 HINDALCO 185.00 181.00 183.00 186.00 187.00 190.00 HINDUNILVR 230.00 227.00 229.00 230.00 231.00 233.00 ICICIBANK 998.00 973.00 986.00 998.00 1010.00 1022.00 IDEA 64.00 63.00 63.00 64.00 65.00 65.00 IDFC 167.00 160.00 164.00 166.00 169.00 172.00 INFOSYSTCH 2651.00 2621.00 2636.00 2661.00 2676.00 2700.00 ITC 266.00 261.00 264.00 266.00 268.00 270.00 JINDALSTEL 716.00 707.00 711.00 717.00 721.00 726.00 JPASSOCIAT 152.00 149.00 151.00 154.00 155.00 158.00 LT 1652.00 1625.00 1639.00 1650.00 1664.00 1675.00 M&M 534.00 519.00 526.00 540.00 547.00 561.00 MARUTI 1377.00 1350.00 1363.00 1387.00 1400.00 1423.00 NTPC 210.00 205.00 208.00 209.00 212.00 213.00 ONGC 1085.00 1068.00 1076.00 1087.00 1095.00 1106.00 PNB 1036.00 1006.00 1021.00 1032.00 1047.00 1059.00 POWERGRID 107.00 106.00 107.00 107.00 108.00 108.00 RANBAXY 476.00 468.00 472.00 479.00 483.00 490.00 RCOM 177.00 171.00 174.00 176.00 179.00 181.00 RELCAPITAL 791.00 771.00 781.00 789.00 799.00 806.00 RELIANCE 1123.00 1113.00 1118.00 1125.00 1131.00 1138.00 RELINFRA 1088.00 1048.00 1068.00 1083.00 1103.00 1118.00 RPOWER 159.00 150.00 154.00 157.00 162.00 164.00 SAIL 257.00 249.00 253.00 256.00 260.00 262.00 SBIN 2124.00 2092.00 2108.00 2128.00 2144.00 2163.00 SIEMENS 732.00 720.00 726.00 736.00 743.00 753.00 STER 870.00 858.00 864.00 869.00 876.00 881.00 SUNPHARMA 1822.00 1789.00 1805.00 1827.00 1844.00 1865.00 SUZLON 75.00 72.00 74.00 75.00 76.00 77.00 TATAMOTORS 774.00 759.00 766.00 776.00 784.00 794.00 TATAPOWER 1370.00 1331.00 1351.00 1379.00 1399.00 1428.00 TATASTEEL 688.00 663.00 675.00 685.00 697.00 707.00 TCS 796.00 782.00 789.00 799.00 806.00 816.00 UNITECH 77.00 75.00 76.00 77.00 78.00 79.00 WIPRO 715.00 702.00 708.00 717.00 724.00 733.00 For Private Circulation Only.
- 3. RESEARCH TEAM Shardul Kulkarni Head - Technicals Ajit Joshi AVP - TAS Brijesh Ail Manager - TAS Mileen Vasudeo Technical Analyst For any Queries, Suggestions and Feedback kindly mail to vasudeo.kamalakant@angeltrade.com Research Team: 022-3952 6600 Website: www.angelbroking.com DISCLAIMER: This document is not for public distribution and has been furnished to you solely for your information and must not be reproduced or redistributed to any other person. Persons into whose possession this document may come are required to observe these restrictions. Opinion expressed is our current opinion as of the date appearing on this material only. While we endeavor to update on a reasonable basis the information discussed in this material, there may be regulatory, compliance, or other reasons that prevent us from doing so. Prospective investors and others are cautioned that any forward-looking statements are not predictions and may be subject to change without notice. Our proprietary trading and investment businesses may make investment decisions that are inconsistent with the recommendations expressed herein. The information in this document has been printed on the basis of publicly available information, internal data and other reliable sources believed to be true and are for general guidance only. While every effort is made to ensure the accuracy and completeness of information contained, the company takes no guarantee and assumes no liability for any errors or omissions of the information. No one can use the information as the basis for any claim, demand or cause of action. Recipients of this material should rely on their own investigations and take their own professional advice. Each recipient of this document should make such investigations as it deems necessary to arrive at an independent evaluation of an investment in the securities of companies referred to in this document (including the merits and risks involved), and should consult their own advisors to determine the merits and risks of such an investment. Price and value of the investments referred to in this material may go up or down. Past performance is not a guide for future performance. Certain transactions - futures, options and other derivatives as well as non-investment grade securities - involve substantial risks and are not suitable for all investors. Reports based on technical analysis centers on studying charts of a stock's price movement and trading volume, as opposed to focusing on a company's fundamentals and as such, may not match with a report on a company's fundamentals. We do not undertake to advise you as to any change of our views expressed in this document. While we would endeavor to update the information herein on a reasonable basis, Angel Broking, its subsidiaries and associated companies, their directors and employees are under no obligation to update or keep the information current. Also there may be regulatory, compliance, or other reasons that may prevent Angel Broking and affiliates from doing so. Prospective investors and others are cautioned that any forward-looking statements are not predictions and may be subject to change without notice. Angel Broking Limited and affiliates, including the analyst who has issued this report, may, on the date of this report, and from time to time, have long or short positions in, and buy or sell the securities of the companies mentioned herein or engage in any other transaction involving such securities and earn brokerage or compensation or act as advisor or have other potential conflict of interest with respect to company/ies mentioned herein or inconsistent with any recommendation and related information and opinions. Angel Broking Limited and affiliates may seek to provide or have engaged in providing corporate finance, investment banking or other advisory services in a merger or specific transaction to the companies referred to in this report, as on the date of this report or in the past. Sebi Registration No : INB 010996539 For Private Circulation Only.