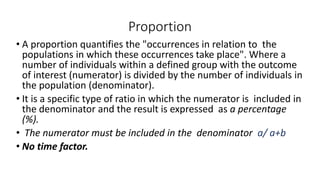
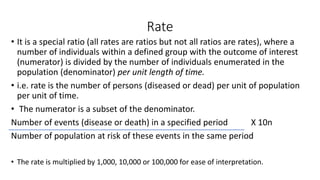
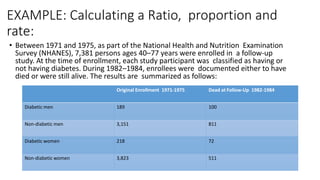
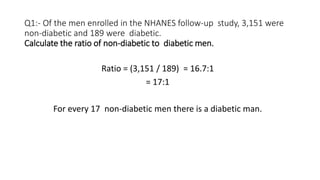
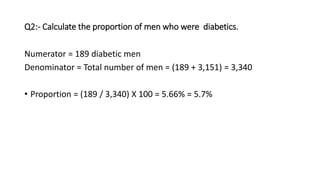
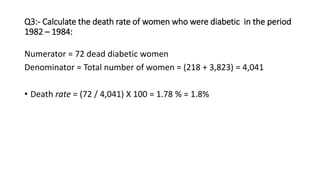
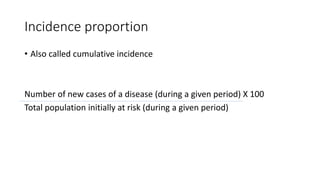
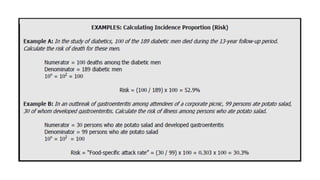
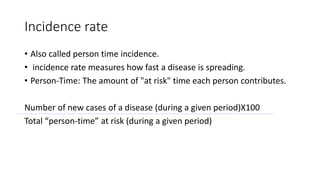
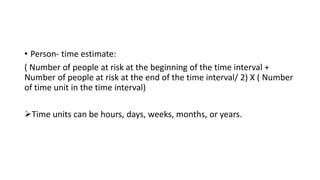
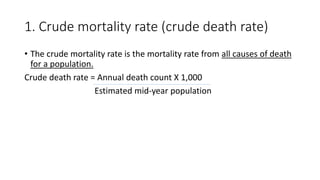
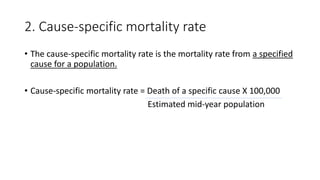
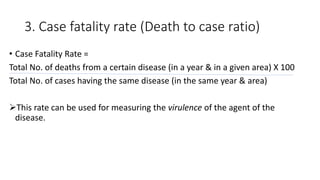
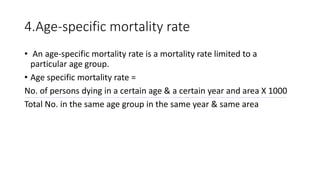
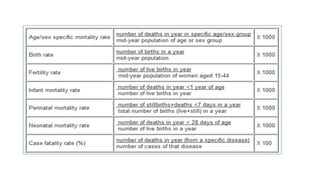
Data and Epidemiology
Continue
Frequency Measures
• A measure of central location provides a single value that
summarizes an entire distribution of data (mode, mean etc.). In
contrast, a frequency measure characterizes only part of the
distribution.
• Frequency measures compare one part of the distribution to
another part of the distribution, or to the entire distribution.
• Common frequency measures are ratios, proportions, and rates.
• All three frequency measures have the same basic form:
• Numerator = upper portion of a fraction(X)
• Denominator = lower portion of a fraction(y)
• numerator divided by denominator× 10 n
• So the fraction of (numerator/denominator) can be
multiplied by 1, 10, 100, 1000, and so on. This multiplier
varies by measure and will be addressed in each section.
Ratio
• A ratio is the relative magnitude of two quantities or a comparison of
any two values.
• It is calculated by dividing one interval- or ratio-scale variable by the
other.
• The numerator and denominator need not be related.
• Therefore, one could compare apples with oranges or apples with
number of physician visits.
• Method for calculating a ratio:
Number or rate of (events, items, or persons, etc.) in one group
Number or rate of (events, items, or persons, etc.) in another group
• After the numerator is divided by the denominator, the result is often
expressed as the result “to one” or written as the result “:1.”
• Therefore, the form for writing a ratio is:
x:y or x/y
Proportion
• A proportion quantifies the "occurrences in relation to the
populations in which these occurrences take place". Where a
number of individuals within a defined group with the outcome
of interest (numerator) is divided by the number of individuals in
the population (denominator).
• It is a specific type of ratio in which the numerator is included in
the denominator and the result is expressed as a percentage
(%).
• The numerator must be included in the denominator a/ a+b
• No time factor.
Rate
• It is a special ratio (all rates are ratios but not all ratios are rates), where a
number of individuals within a defined group with the outcome of interest
(numerator) is divided by the number of individuals enumerated in the
population (denominator) per unit length of time.
• i.e. rate is the number of persons (diseased or dead) per unit of population
per unit of time.
• The numerator is a subset of the denominator.
Number of events (disease or death) in a specified period X 10n
Number of population at risk of these events in the same period
• The rate is multiplied by 1,000, 10,000 or 100,000 for ease of interpretation.
EXAMPLE: Calculating a Ratio, proportion and
rate:
• Between 1971 and 1975, as part of the National Health and Nutrition Examination
Survey (NHANES), 7,381 persons ages 40–77 years were enrolled in a follow-up
study. At the time of enrollment, each study participant was classified as having or
not having diabetes. During 1982–1984, enrollees were documented either to have
died or were still alive. The results are summarized as follows:
Original Enrollment 1971-1975 Dead at Follow-Up 1982-1984
Diabetic men 189 100
Non-diabetic men 3,151 811
Diabetic women 218 72
Non-diabetic women 3,823 511
Q1:- Of the men enrolled in the NHANES follow-up study, 3,151 were
non-diabetic and 189 were diabetic.
Calculate the ratio of non-diabetic to diabetic men.
Ratio = (3,151 / 189) = 16.7:1
= 17:1
For every 17 non-diabetic men there is a diabetic man.
Q2:- Calculate the proportion of men who were diabetics.
Numerator = 189 diabetic men
Denominator = Total number of men = (189 + 3,151) = 3,340
• Proportion = (189 / 3,340) X 100 = 5.66% = 5.7%
Q3:- Calculate the death rate of women who were diabetic in the period
1982 – 1984:
Numerator = 72 dead diabetic women
Denominator = Total number of women = (218 + 3,823) = 4,041
• Death rate = (72 / 4,041) X 100 = 1.78 % = 1.8%
Morbidity frequency measures
• Morbidity has been defined as any departure, subjective or objective,
from a state of physiological or psychological well-being.
• In practice, morbidity encompasses disease, injury, and disability.
• Although for this lesson the term refers to the number of persons
who are ill, it can also be used to describe the periods of illness that
these persons experienced, or the duration of these illnesses
Incidence
• Incidence measures the number of new cases of a disease (or other health -
related phenomenon) that occur during a specified period of time in a
population at risk.
Types of Incidence:
1. Incidence proportion (or attack rate or risk):
• Refers to the occurrence of new cases of disease or injury in a population over
a specified period of time.
2. Incidence rate (or person-time rate):
• to mean the number of new cases per unit of population.
 The incidence quantifies the "development' of a disease.
Incidence proportion
• Also called cumulative incidence
Number of new cases of a disease (during a given period) X 100
Total population initially at risk (during a given period)
Incidence rate
• Also called person time incidence.
• incidence rate measures how fast a disease is spreading.
• Person-Time: The amount of "at risk" time each person contributes.
Number of new cases of a disease (during a given period)X100
Total “person-time” at risk (during a given period)
• Person- time estimate:
( Number of people at risk at the beginning of the time interval +
Number of people at risk at the end of the time interval/ 2) X ( Number
of time unit in the time interval)
Time units can be hours, days, weeks, months, or years.
Attack Rate and Secondary attack rate
• An attack rate is a variant of an incidence rate, applied to a narrowly
defined population observed for a limited time, such as during an
epidemic. The attack rate is usually expressed as a percent, so 10n
equals 100.
• Attack Rate:
Number of new cases among the population during the period x 100
Population at risk at the beginning of the period
• A secondary attack rate is a measure of the frequency of new cases of a
disease among the contacts of known cases.
Secondary Attack Rate =
Number of cases among contacts of primary cases during the period x 100
Total Number of Contacts
Often, the total number of contacts in the denominator is calculated as the
total population in the households of the primary cases, minus the number
of new cases.
Prevalence
• Prevalence, sometimes referred to as prevalence rate, is the
proportion of persons in a population who have a particular disease
or attribute (characteristic) at a specified point in time
• Prevalence differs from incidence in that:
1. prevalence includes all cases, both new and preexisting, in the
population at the specified time, whereas incidence is limited to
new cases only.
2. Also, it includes the total population not just the population at risk.
Types of prevalence
• Point prevalence refers to the prevalence measured at a particular
point in time.
It is the proportion of persons with a particular disease or attribute on
a particular date.
• Period prevalence refers to prevalence measured over an interval of
time.
• It is the proportion of persons with a particular disease or attribute at
any time during the interval.
• Prevalence:
All new and pre-existing cases during a given time period X100
Population during the same time period
Mortality Frequency Measures
• A mortality rate is a measure of the frequency of occurrence of death in
a defined population during a specified interval.
Morbidity and mortality measures are often the same mathematically;
it’s just a matter of what you choose to measure, illness or death.
• The formula for the mortality of a defined population, over a specified
period of time, is:
1. Crude mortality rate (crude death rate)
• The crude mortality rate is the mortality rate from all causes of death
for a population.
Crude death rate = Annual death count X 1,000
Estimated mid-year population
2. Cause-specific mortality rate
• The cause-specific mortality rate is the mortality rate from a specified
cause for a population.
• Cause-specific mortality rate = Death of a specific cause X 100,000
Estimated mid-year population
3. Case fatality rate (Death to case ratio)
• Case Fatality Rate =
Total No. of deaths from a certain disease (in a year & in a given area) X 100
Total No. of cases having the same disease (in the same year & area)
This rate can be used for measuring the virulence of the agent of the
disease.
4.Age-specific mortality rate
• An age-specific mortality rate is a mortality rate limited to a
particular age group.
• Age specific mortality rate =
No. of persons dying in a certain age & a certain year and area X 1000
Total No. in the same age group in the same year & same area
Age specific mortality: ( all x1000)
a. Infant mortality rate
Total No. of deaths aged from < 1 year during a year & in a given locality
Total No. of live births in the same year & locality
b. Neonatal mortality rate
Total No. of deaths among children under 28 days of age during a year & in a given locality
Total No. of live births in the same year & locality
c. Postneonatel mortality rate
Total No. of deaths among children from 28 days up to but not including 1 year of age during a year & in a given
locality
Total No. of live births in the same year & locality
5. Maternal mortality rate
• The maternal mortality rate is really a ratio used to measure mortality
associated with pregnancy.
Total No. of deaths assigned to causes related to pregnancy during a year & in a given locality X 100,000
Total No. of live births in the same year & locality
6. Sex-specific mortality rate
• A sex-specific mortality rate is a mortality rate among either males or
females.
• Both numerator and denominator are limited to the one sex.
Combinations of specific mortality rates:
• Different combinations of specific mortality rates can be calculated
e.g. cause-age specific mortality rate.
Thank you!

Data and epidemiology 2.pptx

  • 1.
  • 2.
    Frequency Measures • Ameasure of central location provides a single value that summarizes an entire distribution of data (mode, mean etc.). In contrast, a frequency measure characterizes only part of the distribution. • Frequency measures compare one part of the distribution to another part of the distribution, or to the entire distribution. • Common frequency measures are ratios, proportions, and rates.
  • 3.
    • All threefrequency measures have the same basic form: • Numerator = upper portion of a fraction(X) • Denominator = lower portion of a fraction(y) • numerator divided by denominator× 10 n • So the fraction of (numerator/denominator) can be multiplied by 1, 10, 100, 1000, and so on. This multiplier varies by measure and will be addressed in each section.
  • 4.
    Ratio • A ratiois the relative magnitude of two quantities or a comparison of any two values. • It is calculated by dividing one interval- or ratio-scale variable by the other. • The numerator and denominator need not be related. • Therefore, one could compare apples with oranges or apples with number of physician visits.
  • 5.
    • Method forcalculating a ratio: Number or rate of (events, items, or persons, etc.) in one group Number or rate of (events, items, or persons, etc.) in another group • After the numerator is divided by the denominator, the result is often expressed as the result “to one” or written as the result “:1.” • Therefore, the form for writing a ratio is: x:y or x/y
  • 6.
    Proportion • A proportionquantifies the "occurrences in relation to the populations in which these occurrences take place". Where a number of individuals within a defined group with the outcome of interest (numerator) is divided by the number of individuals in the population (denominator). • It is a specific type of ratio in which the numerator is included in the denominator and the result is expressed as a percentage (%). • The numerator must be included in the denominator a/ a+b • No time factor.
  • 7.
    Rate • It isa special ratio (all rates are ratios but not all ratios are rates), where a number of individuals within a defined group with the outcome of interest (numerator) is divided by the number of individuals enumerated in the population (denominator) per unit length of time. • i.e. rate is the number of persons (diseased or dead) per unit of population per unit of time. • The numerator is a subset of the denominator. Number of events (disease or death) in a specified period X 10n Number of population at risk of these events in the same period • The rate is multiplied by 1,000, 10,000 or 100,000 for ease of interpretation.
  • 8.
    EXAMPLE: Calculating aRatio, proportion and rate: • Between 1971 and 1975, as part of the National Health and Nutrition Examination Survey (NHANES), 7,381 persons ages 40–77 years were enrolled in a follow-up study. At the time of enrollment, each study participant was classified as having or not having diabetes. During 1982–1984, enrollees were documented either to have died or were still alive. The results are summarized as follows: Original Enrollment 1971-1975 Dead at Follow-Up 1982-1984 Diabetic men 189 100 Non-diabetic men 3,151 811 Diabetic women 218 72 Non-diabetic women 3,823 511
  • 9.
    Q1:- Of themen enrolled in the NHANES follow-up study, 3,151 were non-diabetic and 189 were diabetic. Calculate the ratio of non-diabetic to diabetic men. Ratio = (3,151 / 189) = 16.7:1 = 17:1 For every 17 non-diabetic men there is a diabetic man.
  • 10.
    Q2:- Calculate theproportion of men who were diabetics. Numerator = 189 diabetic men Denominator = Total number of men = (189 + 3,151) = 3,340 • Proportion = (189 / 3,340) X 100 = 5.66% = 5.7%
  • 11.
    Q3:- Calculate thedeath rate of women who were diabetic in the period 1982 – 1984: Numerator = 72 dead diabetic women Denominator = Total number of women = (218 + 3,823) = 4,041 • Death rate = (72 / 4,041) X 100 = 1.78 % = 1.8%
  • 12.
    Morbidity frequency measures •Morbidity has been defined as any departure, subjective or objective, from a state of physiological or psychological well-being. • In practice, morbidity encompasses disease, injury, and disability. • Although for this lesson the term refers to the number of persons who are ill, it can also be used to describe the periods of illness that these persons experienced, or the duration of these illnesses
  • 13.
    Incidence • Incidence measuresthe number of new cases of a disease (or other health - related phenomenon) that occur during a specified period of time in a population at risk. Types of Incidence: 1. Incidence proportion (or attack rate or risk): • Refers to the occurrence of new cases of disease or injury in a population over a specified period of time. 2. Incidence rate (or person-time rate): • to mean the number of new cases per unit of population.  The incidence quantifies the "development' of a disease.
  • 14.
    Incidence proportion • Alsocalled cumulative incidence Number of new cases of a disease (during a given period) X 100 Total population initially at risk (during a given period)
  • 16.
    Incidence rate • Alsocalled person time incidence. • incidence rate measures how fast a disease is spreading. • Person-Time: The amount of "at risk" time each person contributes. Number of new cases of a disease (during a given period)X100 Total “person-time” at risk (during a given period)
  • 17.
    • Person- timeestimate: ( Number of people at risk at the beginning of the time interval + Number of people at risk at the end of the time interval/ 2) X ( Number of time unit in the time interval) Time units can be hours, days, weeks, months, or years.
  • 18.
    Attack Rate andSecondary attack rate • An attack rate is a variant of an incidence rate, applied to a narrowly defined population observed for a limited time, such as during an epidemic. The attack rate is usually expressed as a percent, so 10n equals 100. • Attack Rate: Number of new cases among the population during the period x 100 Population at risk at the beginning of the period
  • 19.
    • A secondaryattack rate is a measure of the frequency of new cases of a disease among the contacts of known cases. Secondary Attack Rate = Number of cases among contacts of primary cases during the period x 100 Total Number of Contacts Often, the total number of contacts in the denominator is calculated as the total population in the households of the primary cases, minus the number of new cases.
  • 21.
    Prevalence • Prevalence, sometimesreferred to as prevalence rate, is the proportion of persons in a population who have a particular disease or attribute (characteristic) at a specified point in time • Prevalence differs from incidence in that: 1. prevalence includes all cases, both new and preexisting, in the population at the specified time, whereas incidence is limited to new cases only. 2. Also, it includes the total population not just the population at risk.
  • 22.
    Types of prevalence •Point prevalence refers to the prevalence measured at a particular point in time. It is the proportion of persons with a particular disease or attribute on a particular date. • Period prevalence refers to prevalence measured over an interval of time. • It is the proportion of persons with a particular disease or attribute at any time during the interval.
  • 23.
    • Prevalence: All newand pre-existing cases during a given time period X100 Population during the same time period
  • 25.
    Mortality Frequency Measures •A mortality rate is a measure of the frequency of occurrence of death in a defined population during a specified interval. Morbidity and mortality measures are often the same mathematically; it’s just a matter of what you choose to measure, illness or death. • The formula for the mortality of a defined population, over a specified period of time, is:
  • 26.
    1. Crude mortalityrate (crude death rate) • The crude mortality rate is the mortality rate from all causes of death for a population. Crude death rate = Annual death count X 1,000 Estimated mid-year population
  • 27.
    2. Cause-specific mortalityrate • The cause-specific mortality rate is the mortality rate from a specified cause for a population. • Cause-specific mortality rate = Death of a specific cause X 100,000 Estimated mid-year population
  • 28.
    3. Case fatalityrate (Death to case ratio) • Case Fatality Rate = Total No. of deaths from a certain disease (in a year & in a given area) X 100 Total No. of cases having the same disease (in the same year & area) This rate can be used for measuring the virulence of the agent of the disease.
  • 29.
    4.Age-specific mortality rate •An age-specific mortality rate is a mortality rate limited to a particular age group. • Age specific mortality rate = No. of persons dying in a certain age & a certain year and area X 1000 Total No. in the same age group in the same year & same area
  • 30.
    Age specific mortality:( all x1000) a. Infant mortality rate Total No. of deaths aged from < 1 year during a year & in a given locality Total No. of live births in the same year & locality b. Neonatal mortality rate Total No. of deaths among children under 28 days of age during a year & in a given locality Total No. of live births in the same year & locality c. Postneonatel mortality rate Total No. of deaths among children from 28 days up to but not including 1 year of age during a year & in a given locality Total No. of live births in the same year & locality
  • 31.
    5. Maternal mortalityrate • The maternal mortality rate is really a ratio used to measure mortality associated with pregnancy. Total No. of deaths assigned to causes related to pregnancy during a year & in a given locality X 100,000 Total No. of live births in the same year & locality
  • 32.
    6. Sex-specific mortalityrate • A sex-specific mortality rate is a mortality rate among either males or females. • Both numerator and denominator are limited to the one sex.
  • 33.
    Combinations of specificmortality rates: • Different combinations of specific mortality rates can be calculated e.g. cause-age specific mortality rate.
  • 35.