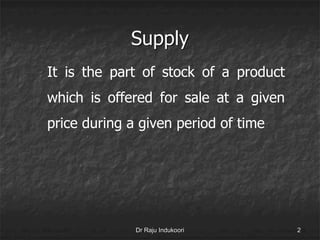
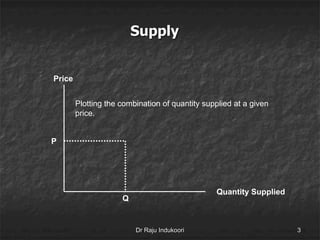
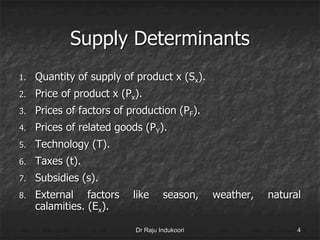
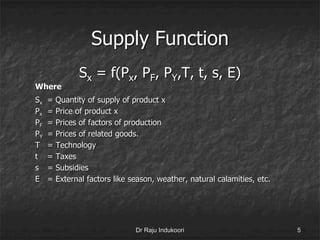
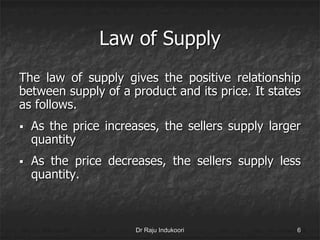
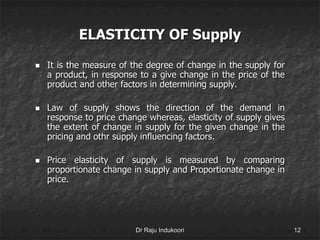
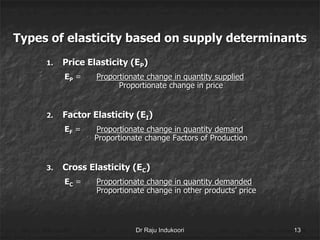
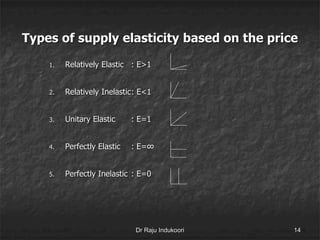
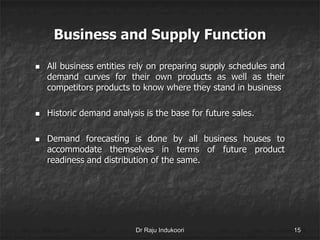
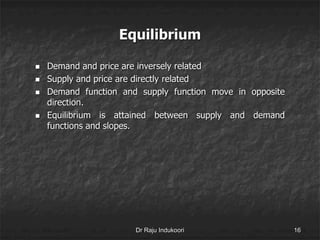
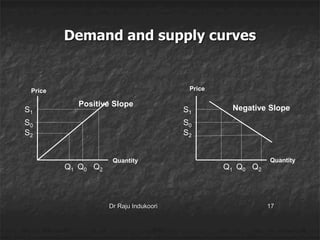
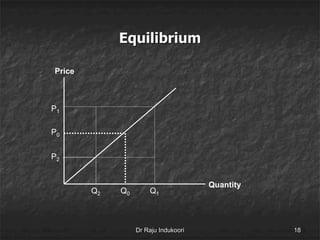
Supply Function
Dr Raju Indukoori
Supply
It is the part of stock of a product
which is offered for sale at a given
price during a given period of time
Dr Raju Indukoori 2
Supply
Quantity Supplied
Price
Plotting the combination of quantity supplied at a given
price.
Q
P
Dr Raju Indukoori 3
Supply Determinants
1. Quantity of supply of product x (Sx).
2. Price of product x (Px).
3. Prices of factors of production (PF).
4. Prices of related goods (PY).
5. Technology (T).
6. Taxes (t).
7. Subsidies (s).
8. External factors like season, weather, natural
calamities. (Ex).
Dr Raju Indukoori 4
Supply Function
Sx = f(Px, PF, PY,T, t, s, E)
Where
Sx = Quantity of supply of product x
Px = Price of product x
PF = Prices of factors of production
PY = Prices of related goods.
T = Technology
t = Taxes
s = Subsidies
E = External factors like season, weather, natural calamities, etc.
Dr Raju Indukoori 5
Law of Supply
The law of supply gives the positive relationship
between supply of a product and its price. It states
as follows.
 As the price increases, the sellers supply larger
quantity
 As the price decreases, the sellers supply less
quantity.
Dr Raju Indukoori 6
Assumptions of law of supply
1) No change in cost of production
2) No change in Related products’ price
3) No change in technology
4) No change in scale of production
5) No change in government policies
6) No change in external factors
Dr Raju Indukoori 7
Price Demand Schedule
 It is the schedule of the changes in quantity of a product
demanded at different prices. Below is the demand schedule
of bananas.
# Quantity in
dozen
Price per
dozen
1 5 200
2 4 160
3 3 125
4 2 100
5 1 75
6 ½ 50
Dr Raju Indukoori 8
Supply Curve
It shows the relationship between price and quantity
supply at a given point of time holding everything
else constant. The curve shows the positive
relationship between price of the product and
quantity supplied. This is known as positive slope.
Dr Raju Indukoori 9
Supply Curve
The movements along supply curve are as follows.
 A rise in price causes upward movement along a
given demand curve.
 A price decline causes downward movement
along a given demand curve.
Dr Raju Indukoori 10
Supply Curve
Dr Raju Indukoori 11
Quantity Supplied
Price
P0
Q0
P1
Q1
Positive Slope: With an increase
in product price is results in
increase of the quantity supplied.
P2
Q2
ELASTICITY OF Supply
 It is the measure of the degree of change in the supply for
a product, in response to a give change in the price of the
product and other factors in determining supply.
 Law of supply shows the direction of the demand in
response to price change whereas, elasticity of supply gives
the extent of change in supply for the given change in the
pricing and othr supply influencing factors.
 Price elasticity of supply is measured by comparing
proportionate change in supply and Proportionate change in
price.
Dr Raju Indukoori 12
Types of elasticity based on supply determinants
1. Price Elasticity (EP)
EP = Proportionate change in quantity supplied
Proportionate change in price
2. Factor Elasticity (EI)
EF = Proportionate change in quantity demand
Proportionate change Factors of Production
3. Cross Elasticity (EC)
EC = Proportionate change in quantity demanded
Proportionate change in other products’ price
Dr Raju Indukoori 13
Types of supply elasticity based on the price
1. Relatively Elastic : E>1
2. Relatively Inelastic: E<1
3. Unitary Elastic : E=1
4. Perfectly Elastic : E=∞
5. Perfectly Inelastic : E=0
Dr Raju Indukoori 14
Business and Supply Function
 All business entities rely on preparing supply schedules and
demand curves for their own products as well as their
competitors products to know where they stand in business
 Historic demand analysis is the base for future sales.
 Demand forecasting is done by all business houses to
accommodate themselves in terms of future product
readiness and distribution of the same.
Dr Raju Indukoori 15
Equilibrium
 Demand and price are inversely related
 Supply and price are directly related
 Demand function and supply function move in opposite
direction.
 Equilibrium is attained between supply and demand
functions and slopes.
Dr Raju Indukoori 16
Demand and supply curves
Dr Raju Indukoori 17
Quantity
Price
S0
Q0
S1
Q2
Positive Slope
S2
Q1
S0
Q0
S1
Q2
S2
Q1
Quantity
Negative Slope
Price
Equilibrium
Dr Raju Indukoori 18
Quantity
Price
P0
Q0
P1
Q1
P2
Q2
Dr Raju Indukoori
Questions?
Give your questions in the comments
19

Supply Function

  • 1.
  • 2.
    Supply It is thepart of stock of a product which is offered for sale at a given price during a given period of time Dr Raju Indukoori 2
  • 3.
    Supply Quantity Supplied Price Plotting thecombination of quantity supplied at a given price. Q P Dr Raju Indukoori 3
  • 4.
    Supply Determinants 1. Quantityof supply of product x (Sx). 2. Price of product x (Px). 3. Prices of factors of production (PF). 4. Prices of related goods (PY). 5. Technology (T). 6. Taxes (t). 7. Subsidies (s). 8. External factors like season, weather, natural calamities. (Ex). Dr Raju Indukoori 4
  • 5.
    Supply Function Sx =f(Px, PF, PY,T, t, s, E) Where Sx = Quantity of supply of product x Px = Price of product x PF = Prices of factors of production PY = Prices of related goods. T = Technology t = Taxes s = Subsidies E = External factors like season, weather, natural calamities, etc. Dr Raju Indukoori 5
  • 6.
    Law of Supply Thelaw of supply gives the positive relationship between supply of a product and its price. It states as follows.  As the price increases, the sellers supply larger quantity  As the price decreases, the sellers supply less quantity. Dr Raju Indukoori 6
  • 7.
    Assumptions of lawof supply 1) No change in cost of production 2) No change in Related products’ price 3) No change in technology 4) No change in scale of production 5) No change in government policies 6) No change in external factors Dr Raju Indukoori 7
  • 8.
    Price Demand Schedule It is the schedule of the changes in quantity of a product demanded at different prices. Below is the demand schedule of bananas. # Quantity in dozen Price per dozen 1 5 200 2 4 160 3 3 125 4 2 100 5 1 75 6 ½ 50 Dr Raju Indukoori 8
  • 9.
    Supply Curve It showsthe relationship between price and quantity supply at a given point of time holding everything else constant. The curve shows the positive relationship between price of the product and quantity supplied. This is known as positive slope. Dr Raju Indukoori 9
  • 10.
    Supply Curve The movementsalong supply curve are as follows.  A rise in price causes upward movement along a given demand curve.  A price decline causes downward movement along a given demand curve. Dr Raju Indukoori 10
  • 11.
    Supply Curve Dr RajuIndukoori 11 Quantity Supplied Price P0 Q0 P1 Q1 Positive Slope: With an increase in product price is results in increase of the quantity supplied. P2 Q2
  • 12.
    ELASTICITY OF Supply It is the measure of the degree of change in the supply for a product, in response to a give change in the price of the product and other factors in determining supply.  Law of supply shows the direction of the demand in response to price change whereas, elasticity of supply gives the extent of change in supply for the given change in the pricing and othr supply influencing factors.  Price elasticity of supply is measured by comparing proportionate change in supply and Proportionate change in price. Dr Raju Indukoori 12
  • 13.
    Types of elasticitybased on supply determinants 1. Price Elasticity (EP) EP = Proportionate change in quantity supplied Proportionate change in price 2. Factor Elasticity (EI) EF = Proportionate change in quantity demand Proportionate change Factors of Production 3. Cross Elasticity (EC) EC = Proportionate change in quantity demanded Proportionate change in other products’ price Dr Raju Indukoori 13
  • 14.
    Types of supplyelasticity based on the price 1. Relatively Elastic : E>1 2. Relatively Inelastic: E<1 3. Unitary Elastic : E=1 4. Perfectly Elastic : E=∞ 5. Perfectly Inelastic : E=0 Dr Raju Indukoori 14
  • 15.
    Business and SupplyFunction  All business entities rely on preparing supply schedules and demand curves for their own products as well as their competitors products to know where they stand in business  Historic demand analysis is the base for future sales.  Demand forecasting is done by all business houses to accommodate themselves in terms of future product readiness and distribution of the same. Dr Raju Indukoori 15
  • 16.
    Equilibrium  Demand andprice are inversely related  Supply and price are directly related  Demand function and supply function move in opposite direction.  Equilibrium is attained between supply and demand functions and slopes. Dr Raju Indukoori 16
  • 17.
    Demand and supplycurves Dr Raju Indukoori 17 Quantity Price S0 Q0 S1 Q2 Positive Slope S2 Q1 S0 Q0 S1 Q2 S2 Q1 Quantity Negative Slope Price
  • 18.
    Equilibrium Dr Raju Indukoori18 Quantity Price P0 Q0 P1 Q1 P2 Q2
  • 19.
    Dr Raju Indukoori Questions? Giveyour questions in the comments 19