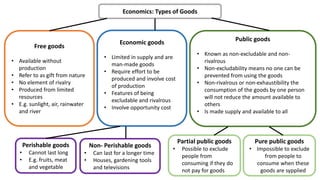
Economics: Types ofGoods
Free goods
• Available without
production
• Refer to as gift from nature
• No element of rivalry
• Produced from limited
resources
• E.g. sunlight, air, rainwater
and river
Economic goods
• Limited in supply and are
man-made goods
• Require effort to be
produced and involve cost
of production
• Features of being
excludable and rivalrous
• Involve opportunity cost
Perishable goods
• Cannot last long
• E.g. fruits, meat
and vegetable
Non- Perishable goods
• Can last for a longer time
• Houses, gardening tools
and televisions
Public goods
• Known as non-excludable and non-
rivalrous
• Non-excludability means no one can be
prevented from using the goods
• Non-rivalrous or non-exhaustibility the
consumption of the goods by one person
will not reduce the amount available to
others
• Is made supply and available to all
Partial public goods
• Possible to exclude
people from
consuming if they do
not pay for goods
Pure public goods
• Impossible to exclude
from people to
consume when these
goods are sypplied
4.
Islamic Economics: Typesof Goods
Dharurriyah
• Necessity goods that
we cannot survive
and live without
• E.g. food, shelter,
clothes and
education
Hajiyyah
• Comfort goods
• E.g. air conditioners,
washing machines
and vacuum cleaner
Kamaliyyah
• Luxury goods that
satisfy the needs of
humans
• Human still can
survive and live
comfortably
• E.g. bungalows and
diamond necklaces
Tarafiyyah
• Refer to non-
permissible goods
that will cause a
negative impact on
society
• Are extravagant and
unnecessary, lead to
wastage
• E.g. extravagant
flights, lavish
furniture and
luxurious toilets
5.
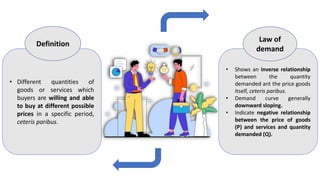
• Different quantitiesof
goods or services which
buyers are willing and able
to buy at different possible
prices in a specific period,
ceteris paribus.
Definition
• Shows an inverse relationship
between the quantity
demanded ant the price goods
itself, ceteris paribus.
• Demand curve generally
downward sloping.
• Indicate negative relationship
between the price of goods
(P) and services and quantity
demanded (Q).
Law of
demand
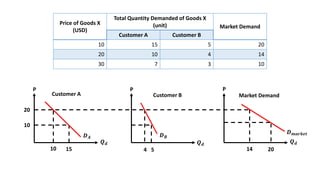
Individual Demand andMarket Demand
Individual Demand
• Refers to the demand of goods and services from a single
consumer.
Market Demand
• This is horizontal summation of all the individual demands
in a particular market.
8.
Price of GoodsX
(USD)
Total Quantity Demanded of Goods X
(unit) Market Demand
Customer A Customer B
10 15 5 20
20 10 4 14
30 7 3 10
10 15
20
10
4 5 14 20
𝑫𝑨 𝑫𝑩
𝑫𝒎𝒂𝒓𝒌𝒆𝒕
𝑸𝒅 𝑸𝒅
𝑸𝒅
P P P
Customer A Customer B Market Demand
9.
𝑸𝟐 𝑸𝟏 𝑸𝟎
𝑷𝟏
𝑷𝟎
𝑷𝟐
𝟎
P(USD)
Quantity
Contraction in demand
Expansion in demand
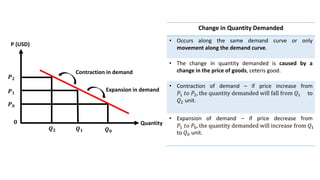
Change in Quantity Demanded
• Occurs along the same demand curve or only
movement along the demand curve.
• The change in quantity demanded is caused by a
change in the price of goods, ceteris good.
• Contraction of demand – if price increase from
𝑃1 𝑡𝑜 𝑃2, the quantity demanded will fall from 𝑄1 to
𝑄2 unit.
• Expansion of demand – if price decrease from
𝑃1 𝑡𝑜 𝑃0, the quantity demanded will increase from 𝑄1
to 𝑄0 unit.
10.
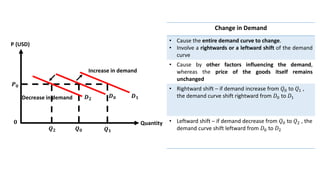
Change in Demand
•Cause the entire demand curve to change.
• Involve a rightwards or a leftward shift of the demand
curve
• Cause by other factors influencing the demand,
whereas the price of the goods itself remains
unchanged
• Rightward shift – if demand increase from 𝑄0 to 𝑄1 ,
the demand curve shift rightward from 𝐷0 to 𝐷1
• Leftward shift – if demand decrease from 𝑄0 to 𝑄2 , the
demand curve shift leftward from 𝐷0 to 𝐷2
𝑸𝟐 𝑸𝟏
𝑸𝟎
𝑷𝟎
𝟎
P (USD)
Quantity
Decrease in demand
Increase in demand
𝑫𝟏
𝑫𝟐
𝑫𝟎
11.
Price Factor –Movement Along
the Demand Curve
𝑸𝟏
P
Q
0
𝑷𝟏
𝑸𝑶
𝑷𝑶
A
B
The quantity demanded
would change if there
an increasing or
decreasing of price
movement along a demand curve
12.
Factor Relationship Example
Consumer’sIncome
The sum of all a
household/consumer’s wage,
salaries, profits, interest
payments, rents, and other
forms of earnings in a given
period of time.
For normal and superior
goods.
Positive
relationship
Inferior goods
Goods for which demand
tends to fall when income
rises.
Negative
relationship
Non-price factors – shift in demand curve
13.
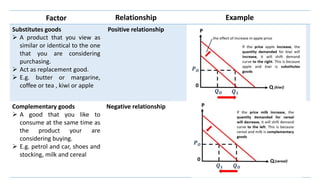
Factor Relationship Example
Substitutesgoods
A product that you view as
similar or identical to the one
that you are considering
purchasing.
Act as replacement good.
E.g. butter or margarine,
coffee or tea , kiwi or apple
Positive relationship
Complementary goods
A good that you like to
consume at the same time as
the product your are
considering buying.
E.g. petrol and car, shoes and
stocking, milk and cereal
Negative relationship
14.
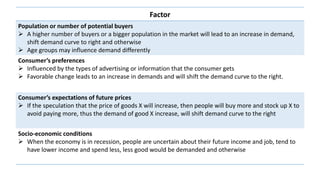
Factor
Population or numberof potential buyers
A higher number of buyers or a bigger population in the market will lead to an increase in demand,
shift demand curve to right and otherwise
Age groups may influence demand differently
Consumer’s preferences
Influenced by the types of advertising or information that the consumer gets
Favorable change leads to an increase in demands and will shift the demand curve to the right.
Consumer’s expectations of future prices
If the speculation that the price of goods X will increase, then people will buy more and stock up X to
avoid paying more, thus the demand of good X increase, will shift demand curve to the right
Socio-economic conditions
When the economy is in recession, people are uncertain about their future income and job, tend to
have lower income and spend less, less good would be demanded and otherwise
15.
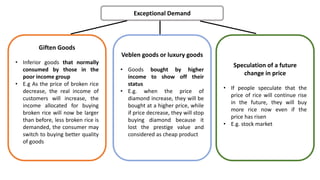
Exceptional Demand
Giften Goods
•Inferior goods that normally
consumed by those in the
poor income group
• E.g As the price of broken rice
decrease, the real income of
customers will increase, the
income allocated for buying
broken rice will now be larger
than before, less broken rice is
demanded, the consumer may
switch to buying better quality
of goods
Veblen goods or luxury goods
• Goods bought by higher
income to show off their
status
• E.g. when the price of
diamond increase, they will be
bought at a higher price, while
if price decrease, they will stop
buying diamond because it
lost the prestige value and
considered as cheap product
Speculation of a future
change in price
• If people speculate that the
price of rice will continue rise
in the future, they will buy
more rice now even if the
price has risen
• E.g. stock market
16.
1. The priceof coffee increase, how will this affect demand
for tea?
2. There is increase in individual income, will this affect
inferior good and how?
3. The price of petrol increase, how will this affect demand for
car?
4. People speculate the price of bread will increase.
5. The price of low quality potato increase
Discussion
17.
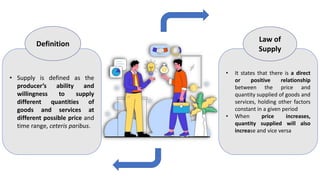
• Supply isdefined as the
producer’s ability and
willingness to supply
different quantities of
goods and services at
different possible price and
time range, ceteris paribus.
Definition
• It states that there is a direct
or positive relationship
between the price and
quantity supplied of goods and
services, holding other factors
constant in a given period
• When price increases,
quantity supplied will also
increase and vice versa
Law of
Supply
Individual and marketsupply
• Individual supply refers to the supply of goods and services
from a single producer
• Market supply refers to the supply of goods and services
from a group of producers
• It is a horizontal summation of all individual supply in a
particular market
Individual supply
Market supply
20.
Example
Price of dark
chocolate
ice-cream
(USD)
Qsof dark chocolate ice-cream (unit) Total Qs of dark
chocolate ice-
cream (unit)
Shop D Shop E Shop F Market Supply
5 15 20 25 60
4 12 316 20 348
3 9 12 15 36
2 6 8 10 24
1 3 4 5 11
21.
Quantity
Supplied
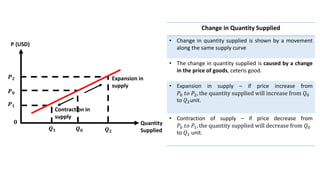
Change in QuantitySupplied
• Change in quantity supplied is shown by a movement
along the same supply curve
• The change in quantity supplied is caused by a change
in the price of goods, ceteris good.
• Expansion in supply – if price increase from
𝑃0 𝑡𝑜 𝑃2, the quantity supplied will increase from 𝑄0
to 𝑄2unit.
• Contraction of supply – if price decrease from
𝑃0 𝑡𝑜 𝑃1, the quantity supplied will decrease from 𝑄0
to 𝑄1 unit.
𝑸𝟏 𝑸𝟎 𝑸𝟐
𝑷𝟎
𝑷𝟏
𝑷𝟐
𝟎
P (USD)
Contraction in
supply
Expansion in
supply
22.
Change in supply
•Cause the entire supply curve to change.
• Involve a rightwards or a leftward shift of the supply
curve
• Cause by other factors influencing the supply, whereas
the price of the goods itself remains unchanged
• Rightward shift – if supply increase from 𝑄0 to 𝑄1 , the
supply curve shift rightward from 𝑆0 to 𝑆1
• Leftward shift – if supply decrease from 𝑄0 to 𝑄2 , the
supply curve shift leftward from 𝑆0 to 𝑆2
𝑸𝟐 𝑸𝟏
𝑸𝟎
𝑷𝟎
𝟎
P (USD)
Quantity
Decrease in
supplied
Increase in
supplied
𝑺𝟏
𝑺𝟐 𝑺𝟎
23.
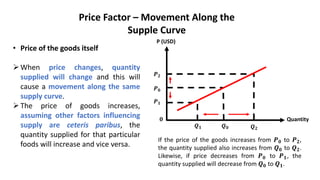
Price Factor –Movement Along the
Supple Curve
• Price of the goods itself
When price changes, quantity
supplied will change and this will
cause a movement along the same
supply curve.
The price of goods increases,
assuming other factors influencing
supply are ceteris paribus, the
quantity supplied for that particular
foods will increase and vice versa.
𝑸𝟏 𝑸𝟎 𝑸𝟐
𝑷𝟎
𝑷𝟏
𝑷𝟐
𝟎
P (USD)
Quantity
If the price of the goods increases from 𝑷𝟎 to 𝑷𝟐,
the quantity supplied also increases from 𝑸𝟎 to 𝑸𝟐.
Likewise, if price decreases from 𝑷𝟎 to 𝑷𝟏, the
quantity supplied will decrease from 𝑸𝟎 to 𝑸𝟏.
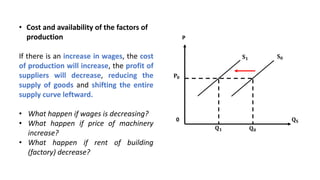
• Cost andavailability of the factors of
production
If there is an increase in wages, the cost
of production will increase, the profit of
suppliers will decrease, reducing the
supply of goods and shifting the entire
supply curve leftward.
• What happen if wages is decreasing?
• What happen if price of machinery
increase?
• What happen if rent of building
(factory) decrease?
P
𝐐𝐒
𝐏𝟎
𝐐𝟎
𝐐𝟏
𝐒𝟎
𝐒𝟏
0
26.
• Changes inthe prices of related goods
1. Goods in joint supply of related goods
Joint supply goods or complementary
goods refer to goods which are supplied at
the same time.
E.g. beef and leather are supplied at the
same time when cow is slaughtered. When
the price of cow increase, the quantity
supplied for beef will increase and supply
of leather will also increase since both
goods are complementary goods.
• Price of butter decrease? - cake and cookies
• Price of microchips increase? – PCs and
monitors
P
𝐐𝐒
𝐏𝟎
𝐐𝟏
𝐐𝟎
𝐒𝟏
𝐒𝟎
0
27.
• Changes inthe prices of related goods
2. Goods in competitive supply or
substitute goods
The supply of goods will decrease if
there is an increase in the price of
substitute goods.
This situation happens because some
of the resources are now being used
to produce more other goods.
• Increase in the supply of coffee (tea)?
• Decrease in the supply of butter
(margarine)?
P
𝐐𝐒
𝐏𝟎
𝐐𝟎
𝐐𝟏
𝐒𝟎
𝐒𝟏
0
28.
• Level oftechnology
Higher technology levels allow a smaller
quantity of resources to be used for
production, reduces the cost of
production, increase the supply of a
product by shifting the entire supply
curve rightwards.
• Increase number of technology in
production of cars?
• Decrease number of technology in
production if computer?
P
𝐐𝐒
𝐏𝟎
𝐐𝟏
𝐐𝟎
𝐒𝟏
𝐒𝟎
0
29.
• Government oreconomic policy
Government policies consist of taxation and
subsidies.
P
𝐐𝐒
𝐏𝟎
𝐐𝟏
𝐐𝟎
𝐒𝟏
𝐒𝟎
0
Taxation
When the production of goods is taxed, this
increase the cost of production and reduces
the amount of profit earned, lead to decrease
in supply and supply curve shifts leftwards.
Subsidies
When the production of goods is subsidies,
this decrease the cost of production and
encourage producers to produces more, lead
to increase in supply and supply curve shifts
rightwards.
• The production of goods Y is taxed.
• The production of goods X is subsidies.
P
𝐐𝐒
𝐏𝟎
𝐐𝟎
𝐐𝟏
𝐒𝟎
𝐒𝟏
0
30.
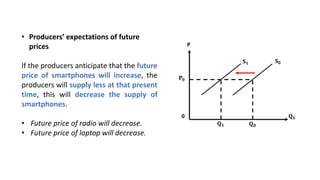
• Producers’ expectationsof future
prices
If the producers anticipate that the future
price of smartphones will increase, the
producers will supply less at that present
time, this will decrease the supply of
smartphones.
• Future price of radio will decrease.
• Future price of laptop will decrease.
P
𝐐𝐒
𝐏𝟎
𝐐𝟎
𝐐𝟏
𝐒𝟎
𝐒𝟏
0
31.
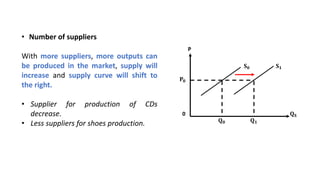
• Number ofsuppliers
With more suppliers, more outputs can
be produced in the market, supply will
increase and supply curve will shift to
the right.
• Supplier for production of CDs
decrease.
• Less suppliers for shoes production.
P
𝐐𝐒
𝐏𝟎
𝐐𝟏
𝐐𝟎
𝐒𝟏
𝐒𝟎
0
32.
Exercise 1
Price (USD)Quantity Demanded (millions)
A 0.50 22
B 1.00 15
C 1.50 10
D 2.00 7
E 2.50 5
1. Plot the demand curve on the graph paper.
2. What is the effect of increase in income level on normal goods and
inferior goods?
3. If there is an increase in the price of printer, what is the effect on the
demand for ink cartridges?
33.
Exercise 2
Price (USD)Quantity Supplied (millions)
A 0.50 0
B 1.00 6
C 1.50 10
D 2.00 13
E 2.50 15
1. Plot the supply curve in the graph paper.
2. If wage increases, what is the effect on the supply curve of cloth?
3. Suppose there is technological advancement in the production
of cars, what is the effect on the supply of cars?