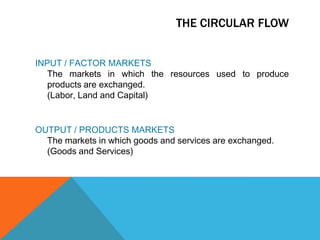
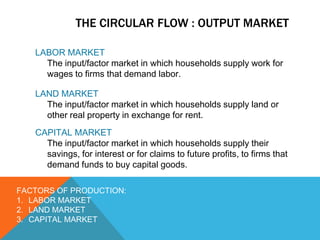
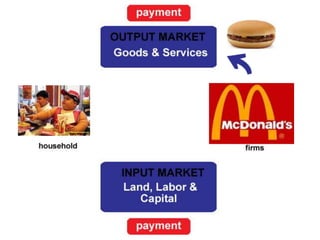
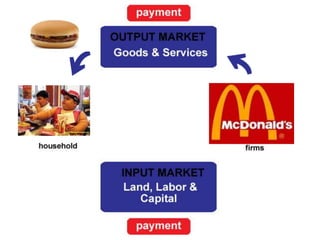
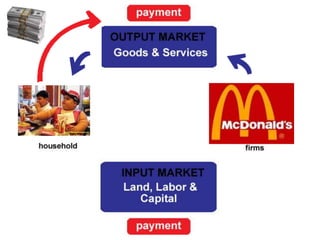
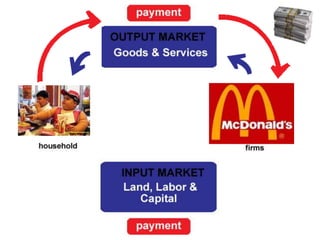
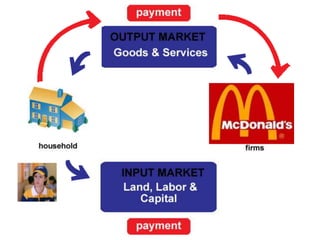
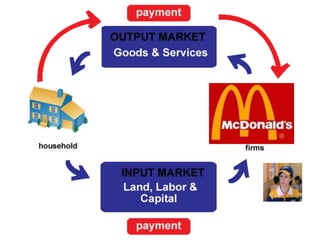
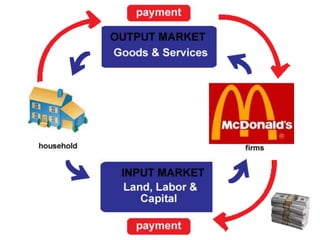
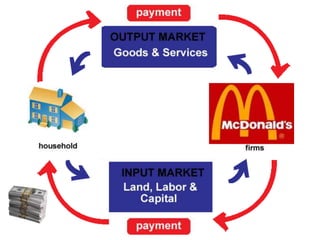
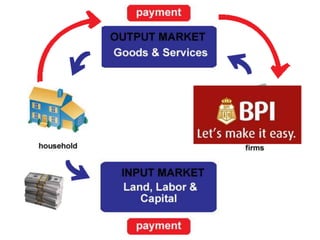
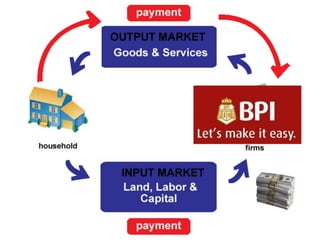
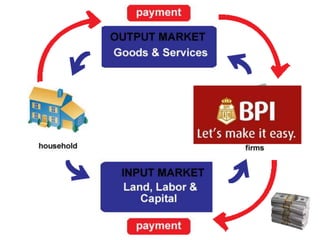
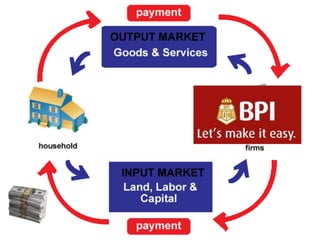
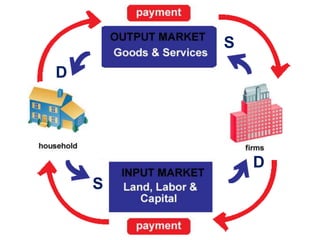
Demand, supply and market equilibriumBy darylle mon-alon & janice camua
BASIC-DECISION MAKING UNITSFIRM An organization that transforms resources (inputs) into products (outputs).  Firms are the primary producing units in a market economy.HOUSEHOLDS	 they are the consumers in general
BASIC-DECISION MAKING UNITSENTREPRENEUR	A person who organizes, manages, and assumes the risks of a firm, taking a new idea or a new product and turning it into a successful business.
THE CIRCULAR FLOWINPUT / FACTOR MARKETS 	The markets in which the resources used to produce products are exchanged.(Labor, Land and Capital)OUTPUT / PRODUCTS MARKETS	The markets in which goods and services are exchanged.	(Goods and Services)
THE CIRCULAR FLOW : INPUT MARKETGOODS & SERVICES	is a product that is of value and can be used to satisfy some desire or need.  Tangible item or service that the buyer is unable or unwilling to produce on their own  
THE CIRCULAR FLOW : OUTPUT MARKETLABOR MARKET	The input/factor market in which households supply work for wages to firms that demand labor.LAND MARKETThe input/factor market in which households supply land or other real property in exchange for rent.CAPITAL MARKETThe input/factor market in which households supply their savings, for interest or for claims to future profits, to firms that demand funds to buy capital goods.FACTORS OF PRODUCTION:LABOR MARKETLAND MARKETCAPITAL MARKET
THE CIRCULAR FLOW DIAGRAM
SDDS
Demand & quantity demandDEMANDrefers to a relationship between price and quantity demanded. Demand refers to how much is desired at any possible price. QUANTITY DEMAND	refers to the specific amount that is desired at each given price. As price goes up, quantity demand drops as price gets higher
The law of demandLAW OF DEMANDis the negative relationship between price and quantity demanded: As price rises, quantity demanded decreases; as price falls, quantity demanded increases.DEMAND SCHEDULEA table showing how much of a given product a household would be willing to buy at different prices.DEMAND CURVEA graph illustrating how much of a given product a household would be willing to buy at different prices.
DemandQTY DEMANDPRICEQTY DEMANDPRICELaw of demand:The negative relationship between price and quantity demanded:  As price rises, quantity demanded decreases; as price falls, quantity demanded increases.
Factors affecting demandA household’s decision about what quantity of a particular output, or product, to demand depends on a number of factors, including:The price of the product in question.
The income available to the household.
The prices of other products available to the household.
The household’s tastes and preferences.
The household’s expectations about future income, wealth, and prices.Demand : determinantsOther Determinants of Household Demand:INCOMEThe sum of all a household’s wages, salaries, profits, interest payments, rents, and other forms of earnings in a given period of time.  It is a flow measure.WEALTH OR NET WORTHThe total value of what a household owns minus what it owes.  It is a stock measure.
DEMAND : determinantsOther Determinants of Household Demand:NORMAL GOODSGoods for which demand goes up when income is higher and for which demand goes down when income is lower.E.G. CarsINFERIOR GOODSGoods for which demand tends to fall when income rises.E.G. Public Transportation
DEMAND : determinantsOther Determinants of Household Demand:SUBSTITUTESGoods that can serve as replacements for one another; when the price of one increases, demand for the other increases. E.G. Orang JuicePERFECT SUBTITUTESIdentical products. E.G. SodaCOMPLENTS / COMPLEMENTARY GOODSGoods that “go together”; a decrease in the price of one results in an increase in demand for the other and vice versa. E.G. Hotdog and Hotdog Buns
DEMAND : determinantsTASTE AND PREFERENCESrefers an individual’s attitude towards a set of objects, typically reflected in an explicit decision-making processEXPECTATIONSYour beliefs about future income or prices will affect your current purchasing decisions.
Demand curveShift of Demand VS Movement along a Demand CurveSHIFT OF A DEMAND CURVEThe change that takes place in a demand curve corresponding to a new relationship between quantity demanded of a good and price of that good.  The shift is brought about by a change in the original conditions.MOVEMENT ALONG A DEMAND CURVEThe change in quantity demanded brought about by a change in price.Change in price of a good or service leads to Change in quantity demanded (movement along the demand curve).Change in income, preferences, or prices of other goods or services leads to	Change in demand (shift of the demand curve).
Demand curveThis particular diagram features an inward shift to the left,  or a shrink in demand. An outward shift would be an increase in demand.
Demand curveShift of Demand Curve VS Movement along a Demand CurveWhen the price of a good changes, we move alongthe demand curve for that good.  When any other factor that influences demand changes (income, tastes, and so on), the relationship between price and quantity is different; there is a shift of the demand curve, in this case from D0 to D1. Telephone calls are normal goods.
Demand curve33 of 49
Market demandThe sum of all the quantities of a good or service demanded per period by all the households buying in the market for that good or service.
Supply and quantity suppliedSUPPLYRefers to how much is produced at every price. Relationship bet. Quantity supplied and the price of that goodQUANTITY SUPPLIEDThe amount of a particular product that a firm would be willing and able to offer for sale at a particular price during a given time period.
SUPPLY: The LAW OF supplyLAW OF SUPPLYThe positive relationship between price and quantity of a good supplied:  An increase in market price will lead to an increase in quantity supplied, and a decrease in market price will lead to a decrease in quantity supplied.SUPPLY CURVEA graph illustrating how much of a product a firm will sell at different prices.SUPPLY SCHEDULEA table showing how much of a product firms will sell at different prices.
supplyQTY SUPPLIEDPRICEQTY DEMANDPRICE
SUPPLYExample:A producer will supply more when the price of output is higher. The slope of a supply curve is positive. Note that the supply curve is red: Supply is determined by choices made by firms.
SUPPLY : DETERMINANTSCOST OF PRODUCTION	depends on a number of factors, including the available technologies and the prices and quantities of the inputs needed by the firm (labor, land, capital, energy, and so on).PRICES OF RELATED PRODUCTSThe cost of producing the product, which in turn depends on:■ The price of required inputs (labor, capital, and land).■ The technologies that can be used to produce the				product.
SUPPLY curveShift of Supply VS Movement along a Supply CurveMOVEMENT ALONG A SUPPLY CURVEThe change in quantity supplied brought about by a change in price.SHIFT OF A SUPPLY CURVEThe change that takes place in a supply curve corresponding to a new relationship between quantity supplied of a good and the price of that good. The shift is brought about by a change in the original conditions.
supplyAs with demand, it is very important to distinguish between movements along supply curves (changes in quantity supplied) and shifts in supply curves (changes in supply):Change in price of a good or service leads to Change in quantity supplied (movement along a supply curve).Change in income, preferences, or prices of other goods or services leads to Change in supply (shift of a supply curve).
SUPPLYShift of Supply Curve VS Movement along a Supply CurveWhen the price of a product changes, we move along the supply curve for that product; the quantity supplied rises or falls.When any other factor affecting supply changes, the supply curve shifts.
Market supplyMARKET SUPPLY is the sum of all that is supplied each period by all producers of a single product.
Market equilibriumEQUILIBRIUMThe condition that exists when quantity supplied and quantity demanded are equal.
Market equilibriumEXCESS DEMAND OR SHORTAGEExcess demand or shortage is the condition that exists when quantity demanded exceeds quantity supplied at the current price.
Market equilibriumEXCESS SUPPLY OR SURPLUSThe condition that exists when quantity supplied exceeds quantity demanded at the current price.

Supply, Demand and Market Equilibrium

  • 1.
    Demand, supply andmarket equilibriumBy darylle mon-alon & janice camua
  • 2.
    BASIC-DECISION MAKING UNITSFIRMAn organization that transforms resources (inputs) into products (outputs). Firms are the primary producing units in a market economy.HOUSEHOLDS they are the consumers in general
  • 3.
    BASIC-DECISION MAKING UNITSENTREPRENEUR Aperson who organizes, manages, and assumes the risks of a firm, taking a new idea or a new product and turning it into a successful business.
  • 4.
    THE CIRCULAR FLOWINPUT/ FACTOR MARKETS The markets in which the resources used to produce products are exchanged.(Labor, Land and Capital)OUTPUT / PRODUCTS MARKETS The markets in which goods and services are exchanged. (Goods and Services)
  • 5.
    THE CIRCULAR FLOW: INPUT MARKETGOODS & SERVICES is a product that is of value and can be used to satisfy some desire or need.  Tangible item or service that the buyer is unable or unwilling to produce on their own  
  • 6.
    THE CIRCULAR FLOW: OUTPUT MARKETLABOR MARKET The input/factor market in which households supply work for wages to firms that demand labor.LAND MARKETThe input/factor market in which households supply land or other real property in exchange for rent.CAPITAL MARKETThe input/factor market in which households supply their savings, for interest or for claims to future profits, to firms that demand funds to buy capital goods.FACTORS OF PRODUCTION:LABOR MARKETLAND MARKETCAPITAL MARKET
  • 7.
  • 20.
  • 21.
    Demand & quantitydemandDEMANDrefers to a relationship between price and quantity demanded. Demand refers to how much is desired at any possible price. QUANTITY DEMAND refers to the specific amount that is desired at each given price. As price goes up, quantity demand drops as price gets higher
  • 22.
    The law ofdemandLAW OF DEMANDis the negative relationship between price and quantity demanded: As price rises, quantity demanded decreases; as price falls, quantity demanded increases.DEMAND SCHEDULEA table showing how much of a given product a household would be willing to buy at different prices.DEMAND CURVEA graph illustrating how much of a given product a household would be willing to buy at different prices.
  • 23.
    DemandQTY DEMANDPRICEQTY DEMANDPRICELawof demand:The negative relationship between price and quantity demanded: As price rises, quantity demanded decreases; as price falls, quantity demanded increases.
  • 25.
    Factors affecting demandAhousehold’s decision about what quantity of a particular output, or product, to demand depends on a number of factors, including:The price of the product in question.
  • 26.
    The income availableto the household.
  • 27.
    The prices ofother products available to the household.
  • 28.
    The household’s tastesand preferences.
  • 29.
    The household’s expectationsabout future income, wealth, and prices.Demand : determinantsOther Determinants of Household Demand:INCOMEThe sum of all a household’s wages, salaries, profits, interest payments, rents, and other forms of earnings in a given period of time. It is a flow measure.WEALTH OR NET WORTHThe total value of what a household owns minus what it owes. It is a stock measure.
  • 30.
    DEMAND : determinantsOtherDeterminants of Household Demand:NORMAL GOODSGoods for which demand goes up when income is higher and for which demand goes down when income is lower.E.G. CarsINFERIOR GOODSGoods for which demand tends to fall when income rises.E.G. Public Transportation
  • 31.
    DEMAND : determinantsOtherDeterminants of Household Demand:SUBSTITUTESGoods that can serve as replacements for one another; when the price of one increases, demand for the other increases. E.G. Orang JuicePERFECT SUBTITUTESIdentical products. E.G. SodaCOMPLENTS / COMPLEMENTARY GOODSGoods that “go together”; a decrease in the price of one results in an increase in demand for the other and vice versa. E.G. Hotdog and Hotdog Buns
  • 32.
    DEMAND : determinantsTASTEAND PREFERENCESrefers an individual’s attitude towards a set of objects, typically reflected in an explicit decision-making processEXPECTATIONSYour beliefs about future income or prices will affect your current purchasing decisions.
  • 33.
    Demand curveShift ofDemand VS Movement along a Demand CurveSHIFT OF A DEMAND CURVEThe change that takes place in a demand curve corresponding to a new relationship between quantity demanded of a good and price of that good. The shift is brought about by a change in the original conditions.MOVEMENT ALONG A DEMAND CURVEThe change in quantity demanded brought about by a change in price.Change in price of a good or service leads to Change in quantity demanded (movement along the demand curve).Change in income, preferences, or prices of other goods or services leads to Change in demand (shift of the demand curve).
  • 34.
    Demand curveThis particulardiagram features an inward shift to the left, or a shrink in demand. An outward shift would be an increase in demand.
  • 35.
    Demand curveShift ofDemand Curve VS Movement along a Demand CurveWhen the price of a good changes, we move alongthe demand curve for that good. When any other factor that influences demand changes (income, tastes, and so on), the relationship between price and quantity is different; there is a shift of the demand curve, in this case from D0 to D1. Telephone calls are normal goods.
  • 36.
  • 37.
    Market demandThe sumof all the quantities of a good or service demanded per period by all the households buying in the market for that good or service.
  • 38.
    Supply and quantitysuppliedSUPPLYRefers to how much is produced at every price. Relationship bet. Quantity supplied and the price of that goodQUANTITY SUPPLIEDThe amount of a particular product that a firm would be willing and able to offer for sale at a particular price during a given time period.
  • 39.
    SUPPLY: The LAWOF supplyLAW OF SUPPLYThe positive relationship between price and quantity of a good supplied: An increase in market price will lead to an increase in quantity supplied, and a decrease in market price will lead to a decrease in quantity supplied.SUPPLY CURVEA graph illustrating how much of a product a firm will sell at different prices.SUPPLY SCHEDULEA table showing how much of a product firms will sell at different prices.
  • 40.
  • 41.
    SUPPLYExample:A producer willsupply more when the price of output is higher. The slope of a supply curve is positive. Note that the supply curve is red: Supply is determined by choices made by firms.
  • 42.
    SUPPLY : DETERMINANTSCOSTOF PRODUCTION depends on a number of factors, including the available technologies and the prices and quantities of the inputs needed by the firm (labor, land, capital, energy, and so on).PRICES OF RELATED PRODUCTSThe cost of producing the product, which in turn depends on:■ The price of required inputs (labor, capital, and land).■ The technologies that can be used to produce the product.
  • 43.
    SUPPLY curveShift ofSupply VS Movement along a Supply CurveMOVEMENT ALONG A SUPPLY CURVEThe change in quantity supplied brought about by a change in price.SHIFT OF A SUPPLY CURVEThe change that takes place in a supply curve corresponding to a new relationship between quantity supplied of a good and the price of that good. The shift is brought about by a change in the original conditions.
  • 44.
    supplyAs with demand,it is very important to distinguish between movements along supply curves (changes in quantity supplied) and shifts in supply curves (changes in supply):Change in price of a good or service leads to Change in quantity supplied (movement along a supply curve).Change in income, preferences, or prices of other goods or services leads to Change in supply (shift of a supply curve).
  • 45.
    SUPPLYShift of SupplyCurve VS Movement along a Supply CurveWhen the price of a product changes, we move along the supply curve for that product; the quantity supplied rises or falls.When any other factor affecting supply changes, the supply curve shifts.
  • 46.
    Market supplyMARKET SUPPLYis the sum of all that is supplied each period by all producers of a single product.
  • 47.
    Market equilibriumEQUILIBRIUMThe conditionthat exists when quantity supplied and quantity demanded are equal.
  • 48.
    Market equilibriumEXCESS DEMANDOR SHORTAGEExcess demand or shortage is the condition that exists when quantity demanded exceeds quantity supplied at the current price.
  • 49.
    Market equilibriumEXCESS SUPPLYOR SURPLUSThe condition that exists when quantity supplied exceeds quantity demanded at the current price.