Downloaded 138 times

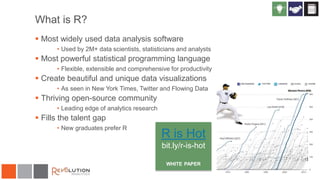
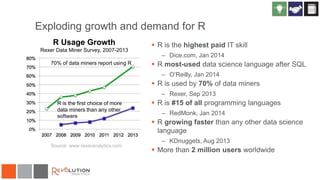
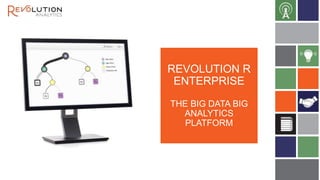
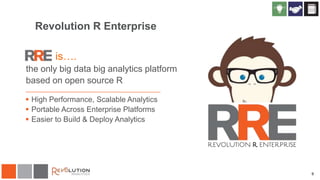
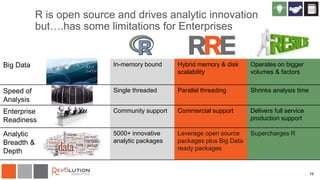
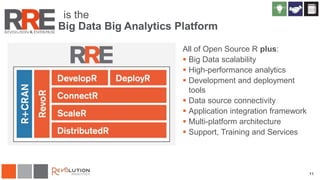
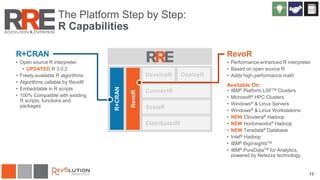
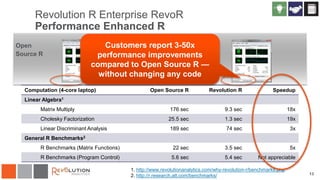
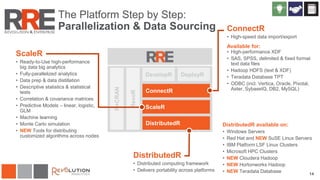
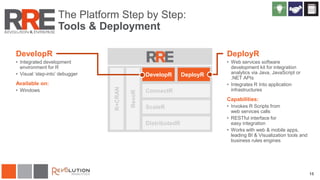
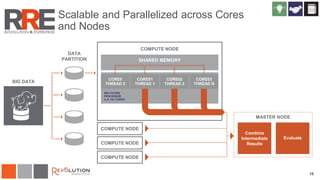
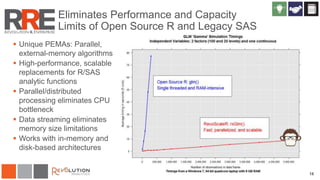
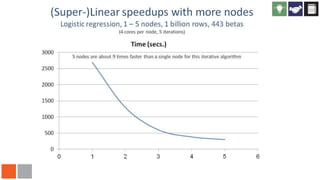
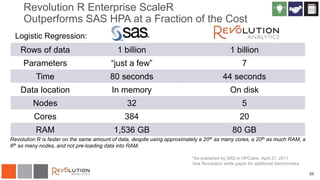
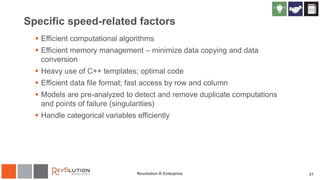
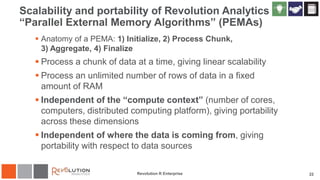
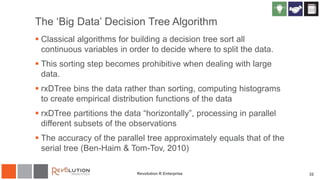


The document discusses Revolution R Enterprise, a big data analytics platform based on open-source R, highlighting its capabilities in handling big data challenges such as scalability, performance, and deployment across various environments. It emphasizes the growing demand for R in data science, noting increased usage among data scientists and performance improvements in analytical tasks compared to traditional tools. The document also details the functionalities of decision trees implemented in Revolution R, including classification and regression, as well as their applications in various industries.


![谷歌留痕技术教程[ 𝙩𝙤𝙥 𝟮𝟯𝟯. 𝙘 𝙤𝙢 ]](https://cdn.slidesharecdn.com/ss_thumbnails/top233-260130173900-2eb784f9-thumbnail.jpg?width=640&height=640&fit=bounds)


