Big Data may well be the Next Big Thing in the IT world. The first organizations to embrace it were online and startup firms. Firms like Google, eBay, LinkedIn, and Facebook were built around big data from the beginning.
Disclaimer :
The images, company, product and service names that are used in this presentation, are for illustration purposes only. All trademarks and registered trademarks are the property of their respective owners.
Data/Image collected from various sources from Internet.
Intention was to present the big picture of Big Data & Hadoop
This presentation is prepared by one of our renowned tutor "Suraj"
If you are interested to learn more about Big Data, Hadoop, data Science then join our free Introduction class on 14 Jan at 11 AM GMT. To register your interest email us at info@uplatz.com
Content:
Introduction
What is Big Data?
Big Data facts
Three Characteristics of Big Data
Storing Big Data
THE STRUCTURE OF BIG DATA
WHY BIG DATA
HOW IS BIG DATA DIFFERENT?
BIG DATA SOURCES
BIG DATA ANALYTICS
TYPES OF TOOLS USED IN BIG-DATA
Application Of Big Data analytics
HOW BIG DATA IMPACTS ON IT
RISKS OF BIG DATA
BENEFITS OF BIG DATA
Future of big data
Big Data Analytics | What Is Big Data Analytics? | Big Data Analytics For Beg...Simplilearn
The presentation about Big Data Analytics will help you know why Big Data analytics is required, what is Big Data analytics, the lifecycle of Big Data analytics, types of Big Data analytics, tools used in Big Data analytics and few Big Data application domains. Also, we'll see a use case on how Spotify uses Big Data analytics. Big Data analytics is a process to extract meaningful insights from Big Data such as hidden patterns, unknown correlations, market trends, and customer preferences. One of the essential benefits of Big Data analytics is used for product development and innovations. Now, let us get started and understand Big Data Analytics in detail.
Below are explained in this Big Data analytics tutorial:
1. Why Big Data analytics?
2. What is Big Data analytics?
3. Lifecycle of Big Data analytics
4. Types of Big Data analytics
5. Tools used in Big Data analytics
6. Big Data application domains
What is this Big Data Hadoop training course about?
The Big Data Hadoop and Spark developer course have been designed to impart an in-depth knowledge of Big Data processing using Hadoop and Spark. The course is packed with real-life projects and case studies to be executed in the CloudLab.
What are the course objectives?
This course will enable you to:
1. Understand the different components of the Hadoop ecosystem such as Hadoop 2.7, Yarn, MapReduce, Pig, Hive, Impala, HBase, Sqoop, Flume, and Apache Spark
2. Understand Hadoop Distributed File System (HDFS) and YARN as well as their architecture, and learn how to work with them for storage and resource management
3. Understand MapReduce and its characteristics, and assimilate some advanced MapReduce concepts
4. Get an overview of Sqoop and Flume and describe how to ingest data using them
5. Create database and tables in Hive and Impala, understand HBase, and use Hive and Impala for partitioning
6. Understand different types of file formats, Avro Schema, using Arvo with Hive, and Sqoop and Schema evolution
7. Understand Flume, Flume architecture, sources, flume sinks, channels, and flume configurations
8. Understand HBase, its architecture, data storage, and working with HBase. You will also understand the difference between HBase and RDBMS
9. Gain a working knowledge of Pig and its components
10. Do functional programming in Spark
11. Understand resilient distribution datasets (RDD) in detail
12. Implement and build Spark applications
13. Gain an in-depth understanding of parallel processing in Spark and Spark RDD optimization techniques
14. Understand the common use-cases of Spark and the various interactive algorithms
15. Learn Spark SQL, creating, transforming, and querying Data frames
Learn more at https://www.simplilearn.com/big-data-and-analytics/big-data-and-hadoop-training
This presentation examines the main building blocks for building a big data pipeline in the enterprise. The content uses inspiration from some of the top big data pipelines in the world like the ones built by Netflix, Linkedin, Spotify or Goldman Sachs
Big data nowadays is a new challenge to be managed, not as a barrier to grow up business. Data storages costs relatively is inexpensive, with more transactions generated from social media, machine, and sensors, data increased from pieces by pieces into pentabytes.
This slide explained what the challenges of Big Data (Volume, Velocity, and Variety) and give a solution how to managed them.
There are many tools that could help to solve the problems, but the main focus tools in this slide is Apache Hadoop.
My class presentation at USC. It gives an introduction about what is data science, machine learning, applications, recommendation system and infrastructure.
A Seminar Presentation on Big Data for Students.
Big data refers to a process that is used when traditional data mining and handling techniques cannot uncover the insights and meaning of the underlying data. Data that is unstructured or time sensitive or simply very large cannot be processed by relational database engines. This type of data requires a different processing approach called big data, which uses massive parallelism on readily-available hardware.
Big Data Ppt PowerPoint Presentation Slides SlideTeam
Big data has brought about a revolution in the field of information technology. Our content-ready big data PPT PowerPoint presentation slides shed light on the importance and relevance of large volumes of data. The data management presentation covers myriad of topics such as big data sources, market forecast, 3 Vs, technologies, workflow, data analytics process, impact, benefit, future, opportunity and challenges, and many additional slides containing graphs and charts. The biggest benefit that this big data analytics presentation template offers is that it enables you to unearth the information that can be used to shape the future of your business. Moreover, these designs can also be utilized to craft your own presentation on predictive analytics, data processing application, database, cloud computing, business intelligence, and user behavior analytics. Download big data PPT visuals which will help you make accurate business decisions. Enlighten folks on fraud with our Big Data PPt PowerPoint Presentation Slides. Convince them to be highly alert.
Big data is a term that describes the large volume of data may be both structured and unstructured.
That inundates a business on a day-to-day basis. But it’s not the amount of data that’s important. It’s what organizations do with the data that matters.
Big Data e Governança de Dados, via DMM-Data Management Maturiy ModelCarlos Barbieri
Mostra um exemplo real de Governança de Dados com Big Data, numa empresa de Energia elétrica, aplicando os conceitos de DMM-Data Management Maturity Model
Enough taking about Big data and Hadoop and let’s see how Hadoop works in action.
We will locate a real dataset, ingest it to our cluster, connect it to a database, apply some queries and data transformations on it , save our result and show it via BI tool.
Cloud Protection Manager (CPM) is the leading backup, recovery and Disaster-Recovery Solution for Amazon EC2. This presentation gives a high-level overview of CPM's key features and advantages for backup and recovery in Amazon EC2 on the basis of Amazon's native snapshots (EBS snapshots and RDS snapshots),
Learn how Digital Advertising customers are leveraging the integration between Amazon DynamoDB and Amazon Redshift to manage their high scale data, from creation to analysis. In this session, we will describe the three essential ingredients of efficient data flow in the cloud, and introduce a reference architecture that enables customers to meet the demands for low latency and high volume encountered in the Digital Advertising industry. Using existing SQL-based tools and business intelligence systems, you will learn how to gain deeper insight from your data at lower cost. The design principles presented here will be useful to every environment where managing data at scale is a challenge.
Introduction to the Hadoop Ecosystem (IT-Stammtisch Darmstadt Edition)Uwe Printz
Talk held at the IT-Stammtisch Darmstadt on 08.11.2013
Agenda:
- What is Big Data & Hadoop?
- Core Hadoop
- The Hadoop Ecosystem
- Use Cases
- What‘s next? Hadoop 2.0!
Usama Fayyad talk at IIT Madras on March 27, 2015: BigData, AllData, Old Dat...Usama Fayyad
Title: BigData, AllData, Old Data: Predictive Analytics in a Changing Data Landscape
Abstract:
The landscape of the platform, access methodologies, shapes, and storage representations has changed dramatically. Much of the assumptions of a structured data world dominated by relational databases have been rendered obsolete. Today’s data analyst faces big challenges and a bewildering environment of technologies and challenges involving semi-structured and unstructured data with access methodologies that have almost no relation to the past. This talk will cover issues and challenges in how to make the benefits of advanced analytics fit within the application environment. The requirement for Real-time data streaming and in situ data mining is stronger than ever. We demonstrate how many of the critical problems remain open with much opportunity for innovative solutions to play a huge enabling role. This opportunity extends equally well to Knowledge Management and several related fields.
A comprehensive overview on the entire Hadoop operations and tools: cluster management, coordination, injection, streaming, formats, storage, resources, processing, workflow, analysis, search and visualization
Introduction to the Hadoop Ecosystem (FrOSCon Edition)Uwe Printz
Talk held at the FrOSCon 2013 on 24.08.2013 in Sankt Augustin, Germany
Agenda:
- What is Big Data & Hadoop?
- Core Hadoop
- The Hadoop Ecosystem
- Use Cases
- What‘s next? Hadoop 2.0!
Big Data and Architectural Patterns on AWS - Pop-up Loft Tel AvivAmazon Web Services
The world is producing an ever increasing volume, velocity, and variety of big data. Consumers and businesses are demanding up-to-the-second (or even millisecond) analytics on their fast-moving data, in addition to classic batch processing. AWS delivers many technologies for solving big data problems. But what services should you use, why, when, and how? In this session, we simplify big data processing as a data bus comprising various stages: ingest, store, process, and visualize. Next, we discuss how to choose the right technology in each stage based on criteria such as data structure, query latency, cost, request rate, item size, data volume, durability, and so on. Finally, we provide reference architecture, design patterns, and best practices for assembling these technologies to solve your big data problems at the right cost.
This presentation introduces concepts of Big Data in a layman's language. Author does not claim the originality of the content. The presentation is made by compiling from various sources. Author does not claim copyrights or privacy issues.
Big data is exponentially rising in today's age of information and digital shrinkage. This presentation potentially clears the concept and revolving hype around it.
Introduction to the Hadoop Ecosystem with Hadoop 2.0 aka YARN (Java Serbia Ed...Uwe Printz
Talk held at the Java User Group on 05.09.2013 in Novi Sad, Serbia
Agenda:
- What is Big Data & Hadoop?
- Core Hadoop
- The Hadoop Ecosystem
- Use Cases
- What‘s next? Hadoop 2.0!
Introduction to Hadoop Ecosystem was presented to Lansing Java User Group on 2/17/2015 by Vijay Mandava and Lan Jiang. The demo was built on top of HDP 2.2 and AWS cloud.
At Spotify we collect huge volumes of data for many purposes. Reporting to labels, powering our product features, and analyzing user growth are some of our most common ones. Additionally, we collect many operational metrics related to the responsiveness, utilization and capacity of our servers. To store and process this data, we use scalable and fault-tolerant multi-system infrastructure, and Apache Hadoop is a key part of it. Surprisingly or not, Apache Hadoop generates large amounts of data in the form of logs and metrics that describe its behaviour and performance. To process this data in a scalable and performant manner we use … also Hadoop! During this presentation, I will talk about how we analyze various logs generated by Apache Hadoop using custom scripts (written in Pig or Java/Python MapReduce) and available open-source tools to get data-driven answers to many questions related to the behaviour of our 690-node Hadoop cluster. At Spotify we frequently leverage these tools to learn how fast we are growing, when to buy new nodes, how to calculate the empirical retention policy for each dataset, optimize the scheduler, benchmark the cluster, find its biggest offenders (both people and datasets) and more.
Big data is a term that describes the large volume of data – both structured and unstructured – that inundates a business on a day-to-day basis. But it’s not the amount of data that’s important. It’s what organizations do with the data that matters. Big data can be analyzed for insights that lead to better decisions and strategic business moves.
This Presentation is completely on Big Data Analytics and Explaining in detail with its 3 Key Characteristics including Why and Where this can be used and how it's evaluated and what kind of tools that we use to store data and how it's impacted on IT Industry with some Applications and Risk Factors
Kubernetes & AI - Beauty and the Beast !?! @KCD Istanbul 2024Tobias Schneck
As AI technology is pushing into IT I was wondering myself, as an “infrastructure container kubernetes guy”, how get this fancy AI technology get managed from an infrastructure operational view? Is it possible to apply our lovely cloud native principals as well? What benefit’s both technologies could bring to each other?
Let me take this questions and provide you a short journey through existing deployment models and use cases for AI software. On practical examples, we discuss what cloud/on-premise strategy we may need for applying it to our own infrastructure to get it to work from an enterprise perspective. I want to give an overview about infrastructure requirements and technologies, what could be beneficial or limiting your AI use cases in an enterprise environment. An interactive Demo will give you some insides, what approaches I got already working for real.
The Art of the Pitch: WordPress Relationships and SalesLaura Byrne
Clients don’t know what they don’t know. What web solutions are right for them? How does WordPress come into the picture? How do you make sure you understand scope and timeline? What do you do if sometime changes?
All these questions and more will be explored as we talk about matching clients’ needs with what your agency offers without pulling teeth or pulling your hair out. Practical tips, and strategies for successful relationship building that leads to closing the deal.
Software Delivery At the Speed of AI: Inflectra Invests In AI-Powered QualityInflectra
In this insightful webinar, Inflectra explores how artificial intelligence (AI) is transforming software development and testing. Discover how AI-powered tools are revolutionizing every stage of the software development lifecycle (SDLC), from design and prototyping to testing, deployment, and monitoring.
Learn about:
• The Future of Testing: How AI is shifting testing towards verification, analysis, and higher-level skills, while reducing repetitive tasks.
• Test Automation: How AI-powered test case generation, optimization, and self-healing tests are making testing more efficient and effective.
• Visual Testing: Explore the emerging capabilities of AI in visual testing and how it's set to revolutionize UI verification.
• Inflectra's AI Solutions: See demonstrations of Inflectra's cutting-edge AI tools like the ChatGPT plugin and Azure Open AI platform, designed to streamline your testing process.
Whether you're a developer, tester, or QA professional, this webinar will give you valuable insights into how AI is shaping the future of software delivery.
GDG Cloud Southlake #33: Boule & Rebala: Effective AppSec in SDLC using Deplo...James Anderson
Effective Application Security in Software Delivery lifecycle using Deployment Firewall and DBOM
The modern software delivery process (or the CI/CD process) includes many tools, distributed teams, open-source code, and cloud platforms. Constant focus on speed to release software to market, along with the traditional slow and manual security checks has caused gaps in continuous security as an important piece in the software supply chain. Today organizations feel more susceptible to external and internal cyber threats due to the vast attack surface in their applications supply chain and the lack of end-to-end governance and risk management.
The software team must secure its software delivery process to avoid vulnerability and security breaches. This needs to be achieved with existing tool chains and without extensive rework of the delivery processes. This talk will present strategies and techniques for providing visibility into the true risk of the existing vulnerabilities, preventing the introduction of security issues in the software, resolving vulnerabilities in production environments quickly, and capturing the deployment bill of materials (DBOM).
Speakers:
Bob Boule
Robert Boule is a technology enthusiast with PASSION for technology and making things work along with a knack for helping others understand how things work. He comes with around 20 years of solution engineering experience in application security, software continuous delivery, and SaaS platforms. He is known for his dynamic presentations in CI/CD and application security integrated in software delivery lifecycle.
Gopinath Rebala
Gopinath Rebala is the CTO of OpsMx, where he has overall responsibility for the machine learning and data processing architectures for Secure Software Delivery. Gopi also has a strong connection with our customers, leading design and architecture for strategic implementations. Gopi is a frequent speaker and well-known leader in continuous delivery and integrating security into software delivery.
JMeter webinar - integration with InfluxDB and GrafanaRTTS
Watch this recorded webinar about real-time monitoring of application performance. See how to integrate Apache JMeter, the open-source leader in performance testing, with InfluxDB, the open-source time-series database, and Grafana, the open-source analytics and visualization application.
In this webinar, we will review the benefits of leveraging InfluxDB and Grafana when executing load tests and demonstrate how these tools are used to visualize performance metrics.
Length: 30 minutes
Session Overview
-------------------------------------------
During this webinar, we will cover the following topics while demonstrating the integrations of JMeter, InfluxDB and Grafana:
- What out-of-the-box solutions are available for real-time monitoring JMeter tests?
- What are the benefits of integrating InfluxDB and Grafana into the load testing stack?
- Which features are provided by Grafana?
- Demonstration of InfluxDB and Grafana using a practice web application
To view the webinar recording, go to:
https://www.rttsweb.com/jmeter-integration-webinar
Slack (or Teams) Automation for Bonterra Impact Management (fka Social Soluti...Jeffrey Haguewood
Sidekick Solutions uses Bonterra Impact Management (fka Social Solutions Apricot) and automation solutions to integrate data for business workflows.
We believe integration and automation are essential to user experience and the promise of efficient work through technology. Automation is the critical ingredient to realizing that full vision. We develop integration products and services for Bonterra Case Management software to support the deployment of automations for a variety of use cases.
This video focuses on the notifications, alerts, and approval requests using Slack for Bonterra Impact Management. The solutions covered in this webinar can also be deployed for Microsoft Teams.
Interested in deploying notification automations for Bonterra Impact Management? Contact us at sales@sidekicksolutionsllc.com to discuss next steps.
LF Energy Webinar: Electrical Grid Modelling and Simulation Through PowSyBl -...DanBrown980551
Do you want to learn how to model and simulate an electrical network from scratch in under an hour?
Then welcome to this PowSyBl workshop, hosted by Rte, the French Transmission System Operator (TSO)!
During the webinar, you will discover the PowSyBl ecosystem as well as handle and study an electrical network through an interactive Python notebook.
PowSyBl is an open source project hosted by LF Energy, which offers a comprehensive set of features for electrical grid modelling and simulation. Among other advanced features, PowSyBl provides:
- A fully editable and extendable library for grid component modelling;
- Visualization tools to display your network;
- Grid simulation tools, such as power flows, security analyses (with or without remedial actions) and sensitivity analyses;
The framework is mostly written in Java, with a Python binding so that Python developers can access PowSyBl functionalities as well.
What you will learn during the webinar:
- For beginners: discover PowSyBl's functionalities through a quick general presentation and the notebook, without needing any expert coding skills;
- For advanced developers: master the skills to efficiently apply PowSyBl functionalities to your real-world scenarios.
Securing your Kubernetes cluster_ a step-by-step guide to success !KatiaHIMEUR1
Today, after several years of existence, an extremely active community and an ultra-dynamic ecosystem, Kubernetes has established itself as the de facto standard in container orchestration. Thanks to a wide range of managed services, it has never been so easy to set up a ready-to-use Kubernetes cluster.
However, this ease of use means that the subject of security in Kubernetes is often left for later, or even neglected. This exposes companies to significant risks.
In this talk, I'll show you step-by-step how to secure your Kubernetes cluster for greater peace of mind and reliability.
Accelerate your Kubernetes clusters with Varnish CachingThijs Feryn
A presentation about the usage and availability of Varnish on Kubernetes. This talk explores the capabilities of Varnish caching and shows how to use the Varnish Helm chart to deploy it to Kubernetes.
This presentation was delivered at K8SUG Singapore. See https://feryn.eu/presentations/accelerate-your-kubernetes-clusters-with-varnish-caching-k8sug-singapore-28-2024 for more details.
State of ICS and IoT Cyber Threat Landscape Report 2024 previewPrayukth K V
The IoT and OT threat landscape report has been prepared by the Threat Research Team at Sectrio using data from Sectrio, cyber threat intelligence farming facilities spread across over 85 cities around the world. In addition, Sectrio also runs AI-based advanced threat and payload engagement facilities that serve as sinks to attract and engage sophisticated threat actors, and newer malware including new variants and latent threats that are at an earlier stage of development.
The latest edition of the OT/ICS and IoT security Threat Landscape Report 2024 also covers:
State of global ICS asset and network exposure
Sectoral targets and attacks as well as the cost of ransom
Global APT activity, AI usage, actor and tactic profiles, and implications
Rise in volumes of AI-powered cyberattacks
Major cyber events in 2024
Malware and malicious payload trends
Cyberattack types and targets
Vulnerability exploit attempts on CVEs
Attacks on counties – USA
Expansion of bot farms – how, where, and why
In-depth analysis of the cyber threat landscape across North America, South America, Europe, APAC, and the Middle East
Why are attacks on smart factories rising?
Cyber risk predictions
Axis of attacks – Europe
Systemic attacks in the Middle East
Download the full report from here:
https://sectrio.com/resources/ot-threat-landscape-reports/sectrio-releases-ot-ics-and-iot-security-threat-landscape-report-2024/
Transcript: Selling digital books in 2024: Insights from industry leaders - T...BookNet Canada
The publishing industry has been selling digital audiobooks and ebooks for over a decade and has found its groove. What’s changed? What has stayed the same? Where do we go from here? Join a group of leading sales peers from across the industry for a conversation about the lessons learned since the popularization of digital books, best practices, digital book supply chain management, and more.
Link to video recording: https://bnctechforum.ca/sessions/selling-digital-books-in-2024-insights-from-industry-leaders/
Presented by BookNet Canada on May 28, 2024, with support from the Department of Canadian Heritage.
Epistemic Interaction - tuning interfaces to provide information for AI supportAlan Dix
Paper presented at SYNERGY workshop at AVI 2024, Genoa, Italy. 3rd June 2024
https://alandix.com/academic/papers/synergy2024-epistemic/
As machine learning integrates deeper into human-computer interactions, the concept of epistemic interaction emerges, aiming to refine these interactions to enhance system adaptability. This approach encourages minor, intentional adjustments in user behaviour to enrich the data available for system learning. This paper introduces epistemic interaction within the context of human-system communication, illustrating how deliberate interaction design can improve system understanding and adaptation. Through concrete examples, we demonstrate the potential of epistemic interaction to significantly advance human-computer interaction by leveraging intuitive human communication strategies to inform system design and functionality, offering a novel pathway for enriching user-system engagements.
Epistemic Interaction - tuning interfaces to provide information for AI support
Big data introduction, Hadoop in details
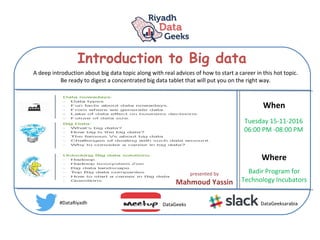
1. Introduction to Big data
When
Where
Tuesday 15-11-2016
06:00 PM -08:00 PM
Badir Program for
Technology Incubators
#DataRiyadh DataGeeks DataGeeksarabia
A deep introduction about big data topic along with real advices of how to start a career in this hot topic.
Be ready to digest a concentrated big data tablet that will put you on the right way.
presented by
Mahmoud Yassin
3. Agenda:
Data nowadays:
-Data types
-Fun facts about data nowadays.
-From where we generate data.
-Lake of data effect on business decisions.
-Future of data size.
Unlocking Big data solutions:
-Hadoop.
-Hadoop ecosystem Zoo
-Big data landscape
-Top Big data companies
-How to start a career in Big data
-Questions
Big Data:
-What’s big data?
-How big is the big data?
-The famous Vs about big data.
-Challenges of dealing with such data amount.
-Why to consider a career in big data?
5. Data Types:
information with a degree of
organization that is readily
searchable and quickly
consolidate into facts.
Examples: RDMBS, spreadsheet
information with a lack of
structure that is time and energy
consuming to search and find and
consolidate into facts
Exemples: email, documents, images,
reports
Semi Structured data : XML data
#DataRiyadh
6. Challenges for Unstructured data:
How do you store
Billions of Files?
How long does it take to
migrate 100’s of TB’s or
data every 3-5 years
Data has no
structure
Resources LimitationData Redundancy Data Backup
#DataRiyadh
7. Sources of data generation:
Social Media Sensors Cell Phones GPS Purchase
WWW E-mails Media streaming Healthcare IOT
#DataRiyadh
12. Facts about data:
70% of data is created by Individuals – but enterprises are
responsible for storing and managing 80% of it.
52% of travelers use social media to plan for their vacations.
35% of purchases on Amazon are though recommendations
75% of what people watch on Netflix are recommendations.
#DataRiyadh
17. Cost:
Even if RDBMS is used to handle and store “big data,” it will turn out to be very expensive.
Velocity:
Also, “big data” is generated at a very high velocity. RDBMS lacks in high velocity because it’s
designed for steady data retention rather than rapid growth.
Can traditional DBMS solve this ?
Data types:
Second, the majority of the data comes in a semi-structured or unstructured format from social
media, audio, video, texts, and emails. However, the second problem related to unstructured data is
outside the purview of RDBMS because relational databases just can’t categorize unstructured data.
They’re designed and structured to accommodate structured data such as weblog sensor and
financial data.
Size:
First, the data size has increased tremendously to the range of petabytes—one petabyte = 1,024
terabytes. RDBMS finds it challenging to handle such huge data volumes. To address this, RDBMS
added more central processing units (or CPUs) or more memory to the database management
system to scale up vertically.
#DataRiyadh
19. What is Big data:
Big data is a term that describes the large volume of data – both structured and
unstructured – that generates on a day-to-day basis. But it’s not the amount of data
that’s important. It’s what organizations do with the data that matters. Big data can
be analyzed for insights that lead to better decisions and strategic business moves.
Big data is high-volume, high-velocity and/or high-variety information assets that
demand cost-effective, innovative forms of information processing that enable
enhanced insight, decision making, and process automation
Big data is a term for data sets that are so large or complex that traditional data
processing applications are inadequate to deal with them. Challenges include
analysis, capture, data curation, search, sharing, storage, transfer, visualization,
querying, updating and information privacy.
#DataRiyadh
21. Big data in action:
UPS stores a large amount of data – much of which comes
from sensors in its vehicles - GPS
ORION (On-Road Integration Optimization and Navigation)
Data Analytics
and Data Science
Data Analytics
and Data Science
the world's
largest
operations
research project
the world's
largest
operations
research project
savings of more
than 8.4 million
85 million miles
off of daily routes
Saved
$30 million/Day
#DataRiyadh
22. Big data in action:
Walmart collects 2.5 petabytes of information from 1 million customers.
from 6000 store
Big data System (Kosmix)
Pricing
strategies
Pricing
strategies
Advertising
campaigns
Advertising
campaigns
30% on their
Online sales
Revenue got
increased by 40%
“We want to know what every product in
the world is. We want to know who every
person in the world is. And we want to
have the ability to connect them together
in a transaction.”
-Neil Ashe, CEO of Global E-commerce at
Walmart
#DataRiyadh
23. Big data in action:
Based on data analysis based on Big data platform:
- What users made purchases in the past.
- Which items do they have in their shopping cart
- Which items did customers rate and like
- What influence did the rating have on other customers to make purchase
Personalization of the online store
based on your previous searches
24. Big data in action:
#DataRiyadh
Zynga collects over 25 Terabytes / Day from FarmVille to drive higher in-game purchases.
25. Big data in quotes:
“Without big data analytics, companies are blind and deaf, wandering out onto the web like
deer on a freeway.” – Geoffrey Moore management consultant and author
“Data is the new science. Big Data holds the answers.” – Pat Gelsinger Chief Executive Officer of VMware
“With too little data, you won’t be able to make any conclusions that you trust. With loads of
data you will find relationships that aren’t real… Big data isn’t about bits, it’s about talent.” –
Douglas Merrill CEO and founder of ZestFinance.com
“The world is one big data problem.” – Andrew McAfee MIT
27. Big data market forecast:
The “big data” market is expected to cross $50 billion by 2017.
#DataRiyadh
28. Big data jobs trend:
The median advertised salary for professionals with big data expertise
is $124,000 a year.
IBM , Cisco and Oracle together advertised 26,488 open positions that
required big data expertise in the last twelve months.
124000 usd to sar =
465012
/12
= 38751 SAR/Month
#DataRiyadh
29. How to solve big data
Hadoop: is a big data analysis engine
#DataRiyadh
30. What is Hadoop
The Apache Hadoop software library is a framework that allows for the distributed
processing of large data sets across clusters of computers using simple programming
models.
Hadoop is an open-source software framework for storing data and running
applications on clusters of commodity hardware. It provides massive storage for any
kind of data, enormous processing power and the ability to handle virtually limitless
concurrent tasks or jobs.
#DataRiyadh
31. Hadoop history
Nutch is a well matured, production ready Web crawler. that enables fine
grained configuration, relying on Apache Hadoop™ data structures, which
are great for batch processing.
#DataRiyadh
32. Why Hadoop is important ?
Ability to store and process huge amounts of
any kind of data, quickly.
With data volumes and varieties constantly
increasing, especially from social media and the
Internet of Things (IoT), that's a key
consideration.
Computing power. Hadoop's distributed computing model processes big data fast. The
more computing nodes you use, the more processing power you have.
Fault tolerance. Data and application processing are protected against hardware failure.
If a node goes down, jobs are automatically redirected to other nodes to make sure the
distributed computing does not fail. Multiple copies of all data are stored automatically.
33. Why Hadoop is important ?
Flexibility. Unlike traditional relational databases, you
don’t have to preprocess data before storing it. You
can store as much data as you want and decide how
to use it later. That includes unstructured data like
text, images and videos.
Low cost. The open-source framework is free and uses commodity hardware
to store large quantities of data.
Scalability. You can easily grow your system to handle more data simply by
adding nodes. Little administration is required.
Scalability
Horizontal scaling means that you scale by adding more
machines into your pool of resources
Vertical scaling means that you scale by adding more
power (CPU, RAM) to an existing machine #DataRiyadh
34. How is Hadoop being used?
Going beyond its original goal of searching millions (or billions) of web pages and returning
relevant results, many organizations are looking to Hadoop as their next big data platform.
Popular uses today include:
#DataRiyadh
39. Hadoop | Data Ingestion
Apache Sqoop is a tool designed for efficiently transferring bulk data between
Apache Hadoop and structured data stores such as relational databases.
#DataRiyadh
40. Hadoop | Data Ingestion
Flume is a distributed, reliable, and available service for efficiently collecting,
aggregating, and moving large amounts of log data.
It is robust and fault tolerant with tunable reliability mechanisms and many
failover and recovery mechanisms.
#DataRiyadh
41. Hadoop | Data Ingestion
Storm is real-time computation system. Storm makes it easy to reliably
process unbounded streams of data, doing for real-time processing.
A Storm topology consumes streams of data and processes those streams in
arbitrarily complex ways, repartitioning the streams between each stage of
the computation however needed.
#DataRiyadh
42. Hadoop | Data Ingestion
An easy to use, powerful, and reliable system to process and distribute data.
Apache NiFi supports powerful and scalable directed graphs of data routing,
transformation, and system mediation logic in a Web-based user interface
#DataRiyadh
43. Hadoop | Data Ingestion
Kafka™ is used for building real-time data pipelines and streaming apps. It is
horizontally scalable, fault-tolerant, wicked fast, and runs in production in
thousands of companies.
#DataRiyadh
44. Hadoop | Data Ingestion
Large scale log aggregator, and analytics.
Fluentd is an open source data collector for unified logging
layer.
Fluentd allows you to unify data collection and consumption
for a better use and understanding of data.
Apache Samza is a distributed stream processing framework.
It uses Apache Kafka for messaging, and Apache Hadoop
YARN to provide fault tolerance, processor isolation, security,
and resource management.
#DataRiyadh
46. Hadoop | Data Storage Layer
Hadoop Distributed File System (HDFS) offers a way to store large files across
multiple machines. Hadoop and HDFS was derived from Google File System
(GFS) paper.
#DataRiyadh
48. Hadoop | Data Storage Layer
A distributed, column-oriented database. HBase uses HDFS for its underlying
storage, and supports both batch-style computations using MapReduce and
point queries (random reads)
Doesn’t support SQL like RDBMS
#DataRiyadh
49. Hadoop | Data Storage Layer
A metadata and table management system for Hadoop. It shares the
metadata with other tools like map reduce, Pig and Hive.
It provides one constant data model for all Hadoop tools along with a shared
schema.
#DataRiyadh
51. Hadoop | Data Processing Layer
MapReduce is the heart of Hadoop. It is this programming paradigm that
allows for massive scalability across hundreds or thousands of servers in a
Hadoop cluster with a parallel, distributed algorithm.
#DataRiyadh
53. Hadoop | Data Processing Layer
A scripting SQL based language and execution environment for creating complex
MapReduce transformations. Functions are written in Pig Latin (the language)
and translated into executable MapReduce jobs. Pig also allows the user to
create extended functions (UDFs) using Java.
#DataRiyadh
54. Hadoop | Data Processing Layer
In memory data analytics cluster computing framework originally developed in the
AMPLab at UC Berkeley.
Run programs up to 100x faster than Hadoop MapReduce in memory, or 10x faster
on disk.
#DataRiyadh
56. Hadoop | Data Querying Layer
A distributed data warehouse built on top of HDFS to manage and organize
large amounts of data. Hive provides a query language based on SQL semantic
(HiveQL) which is translated by the runtime engine to MapReduce jobs for
querying the data.
#DataRiyadh
57. Hadoop | Data Querying Layer
open source massively parallel processing (MPP) SQL query engine for data
stored in a computer cluster running Apache Hadoop.
#DataRiyadh
59. Hadoop | Management Layer
intuitive, easy-to-use Hadoop management web UI. Apache Ambari was
donated by Hortonworks team. It's a powerful and nice interface for Hadoop
and other typical applications from the Hadoop ecosystem.
62. Big data existing solutions:
Data Sources
YARN: A framework for job scheduling and cluster resource management.
A platform for manipulating data
stored in HDFS via a high-level
language called Pig Latin. It does
data extractions, transformations
and loading, and basic analysis in
patch mode
A data warehousing and SQL-like
query language that presents data
in the form of tables. Hive
programming is similar to database
programming.
Ambari: A web interface for managing, configuring and testing Hadoop services and components.
An open-source
cluster computing
framework with in-
memory analytics.
HDFS :A platform for manipulating data
stored in HDFS via a high-level
language called Pig Latin. It does
data extractions, transformations
and loading, and basic analysis in
patch mode
HBase:A distributed, column-oriented
database. HBase uses HDFS for its
underlying storage, and supports
both batch-style computations
using MapReduce and point
queries.
HCatalog
A table and storage management layer
for Hadoop that enables Hadoop
applications (Pig, MapReduce, and
Hive) to read and write data to a
tabular form as opposed to files.
A distributed data processing
model and execution
environment that runs on large
clusters of commodity machines.
MapReduce
A Scalable machine learning and data mining library
A high-performance
coordination service for
distributed applications.
is a Java Web application
used to schedule Apache
Hadoop jobs
data collection system for monitoring large
distributed systems.
A web-based tool for
provisioning, managing, and
monitoring Apache Hadoop
clusters. Ambari also provides a
dashboard for viewing cluster
health such as heatmaps and
ability to view MapReduce, Pig
and Hive applications visually
along with features to diagnose
their performance.
is a data serialization system
63. Other apache projects:
Apache Flink
is an open source
platform for
distributed stream
and batch data
processing.
Apache Falcon
Feed management
and data processing
platform
Apache Ranger
Ranger is a framework
to enable, monitor and
manage comprehensive
data security across the
Hadoop platform.
Apache Tez
to develop a generic
application which
can be used to
process complex
data-processing task
Apache Tika
toolkit detects and
extracts metadata
and text from over
a thousand
different file types
Apache Parquet
columnar storage
format available to
any project in the
Hadoop ecosystem
Apache Zeppelin
A web-based notebook
that enables interactive
data analytics.
Apache Drill
Schema-free SQL
Query Engine for
Hadoop, NoSQL
and Cloud Storage
#DataRiyadh
64.
65. Top Leading Big data companies
The Apache Software Foundation (ASF) is an American non-
profit corporation to support Apache projects
#DataRiyadh
66. How to start
1. Identify business use cases tied to business
outcomes, metrics and your big data roadmap
2. Identify big data champions from both the
business and IT sides of your organization
3. Select infrastructure, tools and architecture
for your big data POC/implementation
4. Staff the project with the right big data skills
or a strategic big data implementation partner
5. Run your project/POC in sprints or short
projects with tangible and measurable
outcomes
6. Try to scale your success POC up to test
your
Logic implementation against the big dataset.
#DataRiyadh
https://datafloq.com/read/3vs-sufficient-describe-big-data/166
Velocity
The Velocity is the speed at which the data is created, stored, analyzed and visualized. In the past, when batch processing was common practice, it was normal to receive an update from the database every night or even every week. Computers and servers required substantial time to process the data and update the databases. In the big data era, data is created in real-time or near real-time. With the availability of Internet connected devices, wireless or wired, machines and devices can pass-on their data the moment it is created.
The speed at which data is created currently is almost unimaginable: Every minute we upload 100 hours of video on YouTube. In addition, every minute over 200 million emails are sent, around 20 million photos are viewed and 30.000 uploaded on Flickr, almost 300.000 tweets are sent and almost 2,5 million queries on Google are performed.
The challenge organizations have is to cope with the enormous speed the data is created and used in real-time.
Volume
90% of all data ever created, was created in the past 2 years. From now on, the amount of data in the world will double every two years. By 2020, we will have 50 times the amount of data as that we had in 2011. The sheer volume of the data is enormous and a very large contributor to the ever expanding digital universe is the Internet of Things with sensors all over the world in all devices creating data every second. The era of a trillion sensors is upon us.
If we look at airplanes they generate approximately 2,5 billion Terabyte of data each year from the sensors installed in the engines. Self-driving cars will generate 2 Petabyte of data every year. Also the agricultural industry generates massive amounts of data with sensors installed in tractors. Shell uses super-sensitive sensors to find additional oil in wells and if they install these sensors at all 10.000 wells they will collect approximately 10 Exabyte of data annually. That again is absolutely nothing if we compare it to the Square Kilometer Array Telescope that will generate 1 Exabyte of data per day.
In the past, the creation of so much data would have caused serious problems. Nowadays, with decreasing storage costs, better storage solutions like Hadoop and the algorithms to create meaning from all that data this is not a problem at all.
Variety
In the past, all data that was created was structured data, it neatly fitted in columns and rows but those days are over. Nowadays, 90% of the data that is generated by organization is unstructured data. Data today comes in many different formats: structured data, semi-structured data, unstructured data and even complex structured data. The wide variety of data requires a different approach as well as different techniques to store all raw data.
There are many different types of data and each of those types of data require different types of analyses or different tools to use. Social media like Facebook posts or Tweets can give different insights, such as sentiment analysis on your brand, while sensory data will give you information about how a product is used and what the mistakes are.
Are you looking for Big Data Jobs or Candidates? Please go to our WORK section
The Four Additional V’s
Now that the context is set regarding the traditional V’s, let’s see which other V’s are important for organizations to keep in mind when they develop a big data strategy.
Veracity
Having a lot of data in different volumes coming in at high speed is worthless if that data is incorrect. Incorrect data can cause a lot of problems for organizations as well as for consumers. Therefore, organizations need to ensure that the data is correct as well as the analyses performed on the data are correct. Especially in automated decision-making, where no human is involved anymore, you need to be sure that both the data and the analyses are correct.
If you want your organization to become information-centric, you should be able to trust that data as well as the analyses. accountability.
Variability
Big data is extremely variable. Brian Hopkins, a Forrester principal analyst, defines variability as the “variance in meaning, in lexicon”. He refers to the supercomputer Watson who won Jeopardy. The supercomputer had to “dissect an answer into its meaning and […] to figure out what the right question was”. That is extremely difficult because words have different meanings an all depends on the context. For the right answer, Watson had to understand the context.
Variability is often confused with variety. Say you have bakery that sells 10 different breads. That is variety. Now imagine you go to that bakery three days in a row and every day you buy the same type of bread but each day it tastes and smells different. That is variability.
Variability is thus very relevant in performing sentiment analyses. Variability means that the meaning is changing(rapidly). In (almost) the same tweets a word can have a totally different meaning. In order to perform a proper sentiment analyses, algorithms need to be able to understand the context and be able to decipher the exact meaning of a word in that context. This is still very difficult.
Visualization
This is the hard part of big data. Making all that vast amount of data comprehensible in a manner that is easy to understand and read. With the right analyses and visualizations, raw data can be put to use otherwise raw data remains essentially useless. Visualizations of course do not mean ordinary graphs or pie charts. They mean complex graphs that can include many variables of data while still remaining understandable and readable.
Visualizing might not be the most technological difficult part; it sure is the most challenging part. Telling a complex story in a graph is very difficult but also extremely crucial. Luckily there are more and more big data startups appearing that focus on this aspect and in the end, visualizations will make the difference. One of them is future this will be the direction to go, where visualizations help organizations answer questions they did not know to ask.
Value
All that available data will create a lot of value for organizations, societies and consumers. Big data means big business and every industry will reap the benefits from big data. McKinsey states that potential annual value of big data to the US Health Care is $ 300 billion, more than double the total annual health care spending of Spain. They also mention that big data has a potential annual value of € 250 billion to the Europe’s public sector administration. Even more, in their well-regarded report from 2011, they state that the potential annual consumer surplus from using personal location data globally can be up to $ 600 billion in 2020. That is a lot of value.
Of course, data in itself is not valuable at all. The value is in the analyses done on that data and how the data is turned into information and eventually turning it into knowledge. The value is in how organisations will use that data and turn their organisation into an information-centric company that relies on insights derived from data analyses for their decision-making.
http://bridg.com/blog/walmart-big-data/
One such project was an open-source web search engine called Nutch – the brainchild of Doug Cutting and Mike Cafarella. They wanted to return web search results faster by distributing data and calculations across different computers so multiple tasks could be accomplished simultaneously. During this time, another search engine project called Google was in progress. It was based on the same concept – storing and processing data in a distributed, automated way so that relevant web search results could be returned faster.
In 2006, Cutting joined Yahoo and took with him the Nutch project as well as ideas based on Google’s early work with automating distributed data storage and processing. The Nutch project was divided – the web crawler portion remained as Nutch and the distributed computing and processing portion became Hadoop (named after Cutting’s son’s toy elephant). In 2008, Yahoo released Hadoop as an open-source project. Today, Hadoop’s framework and ecosystem of technologies are managed and maintained by the non-profit Apache Software Foundation (ASF), a global community of software developers and contributors.