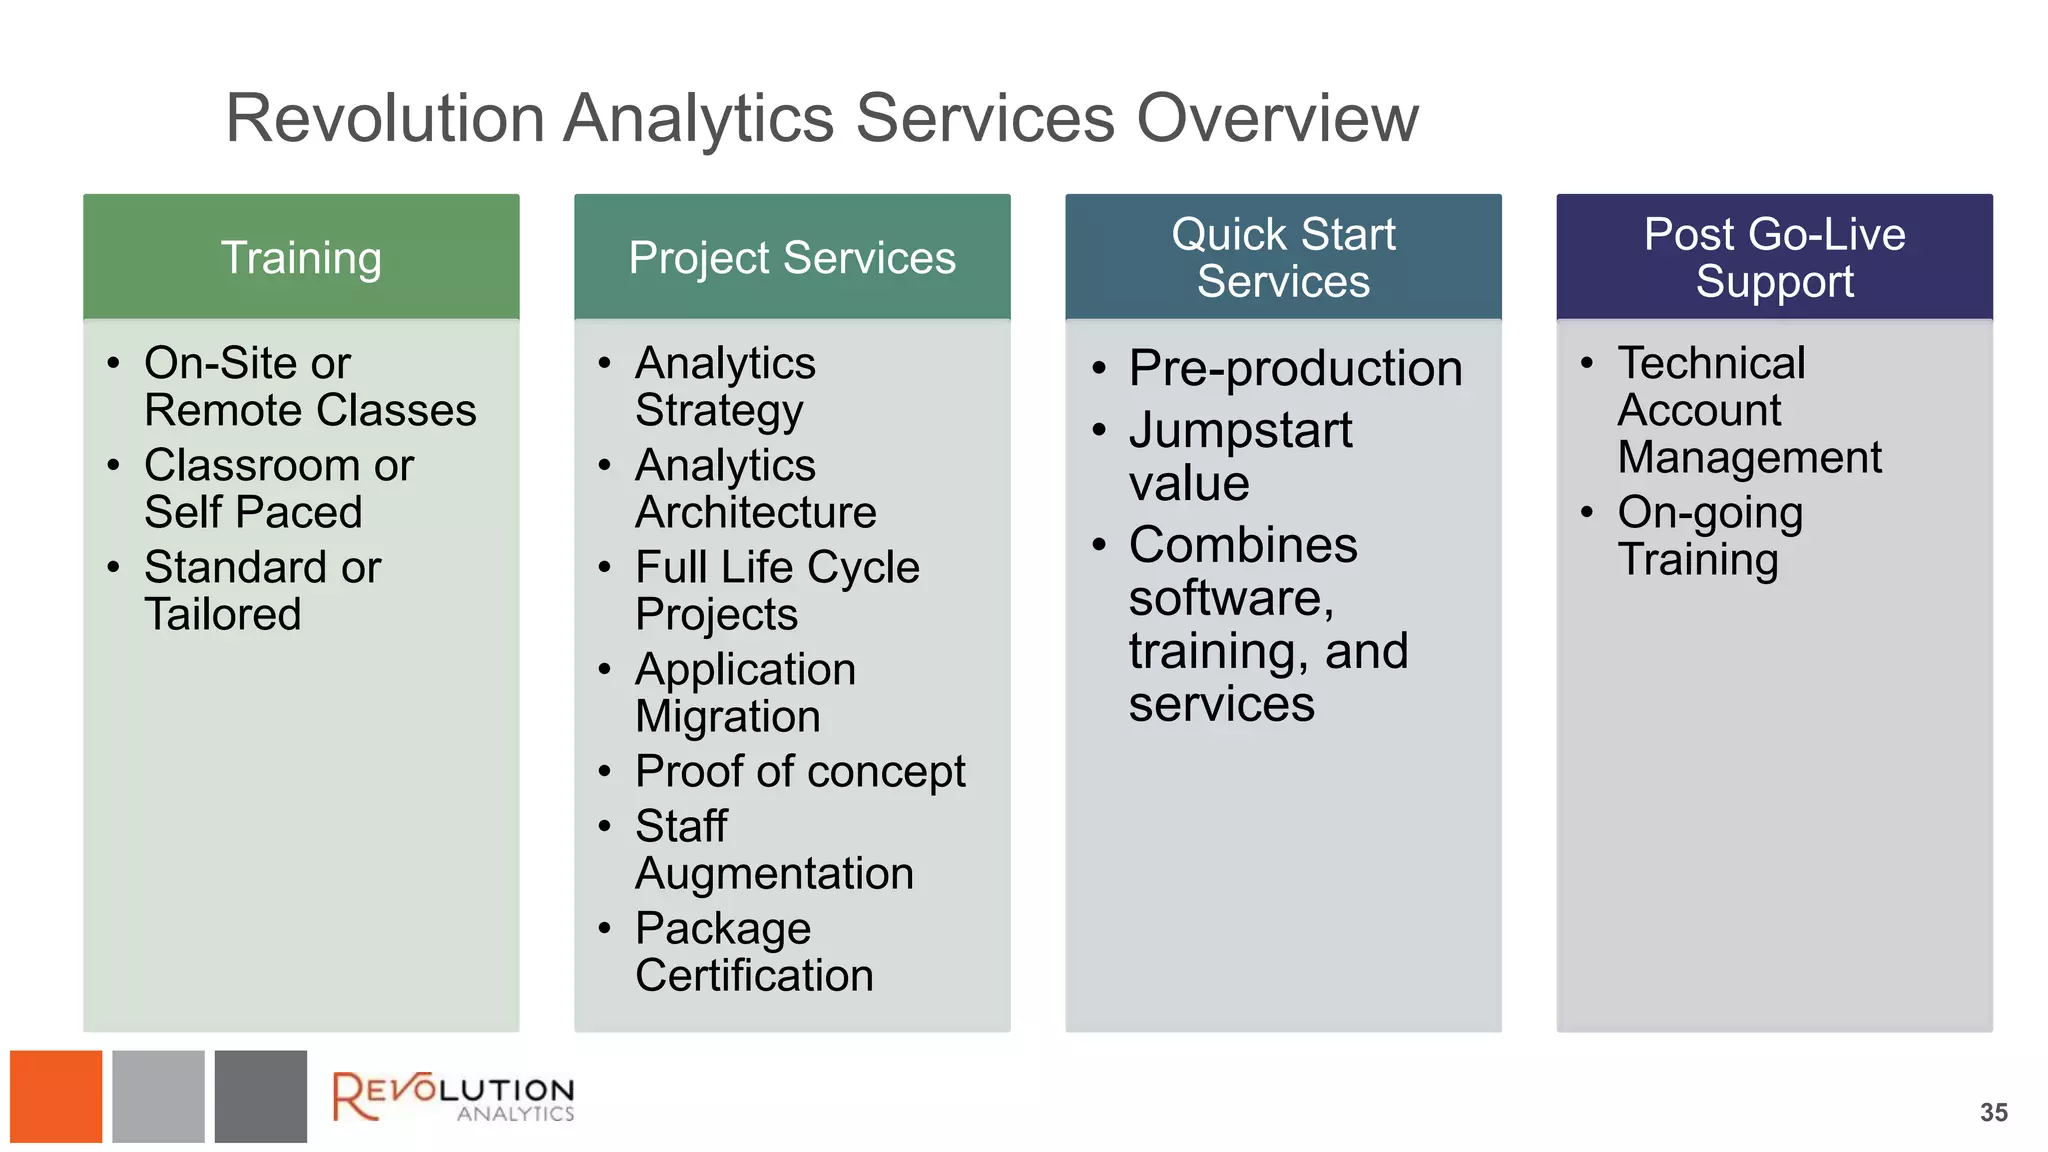
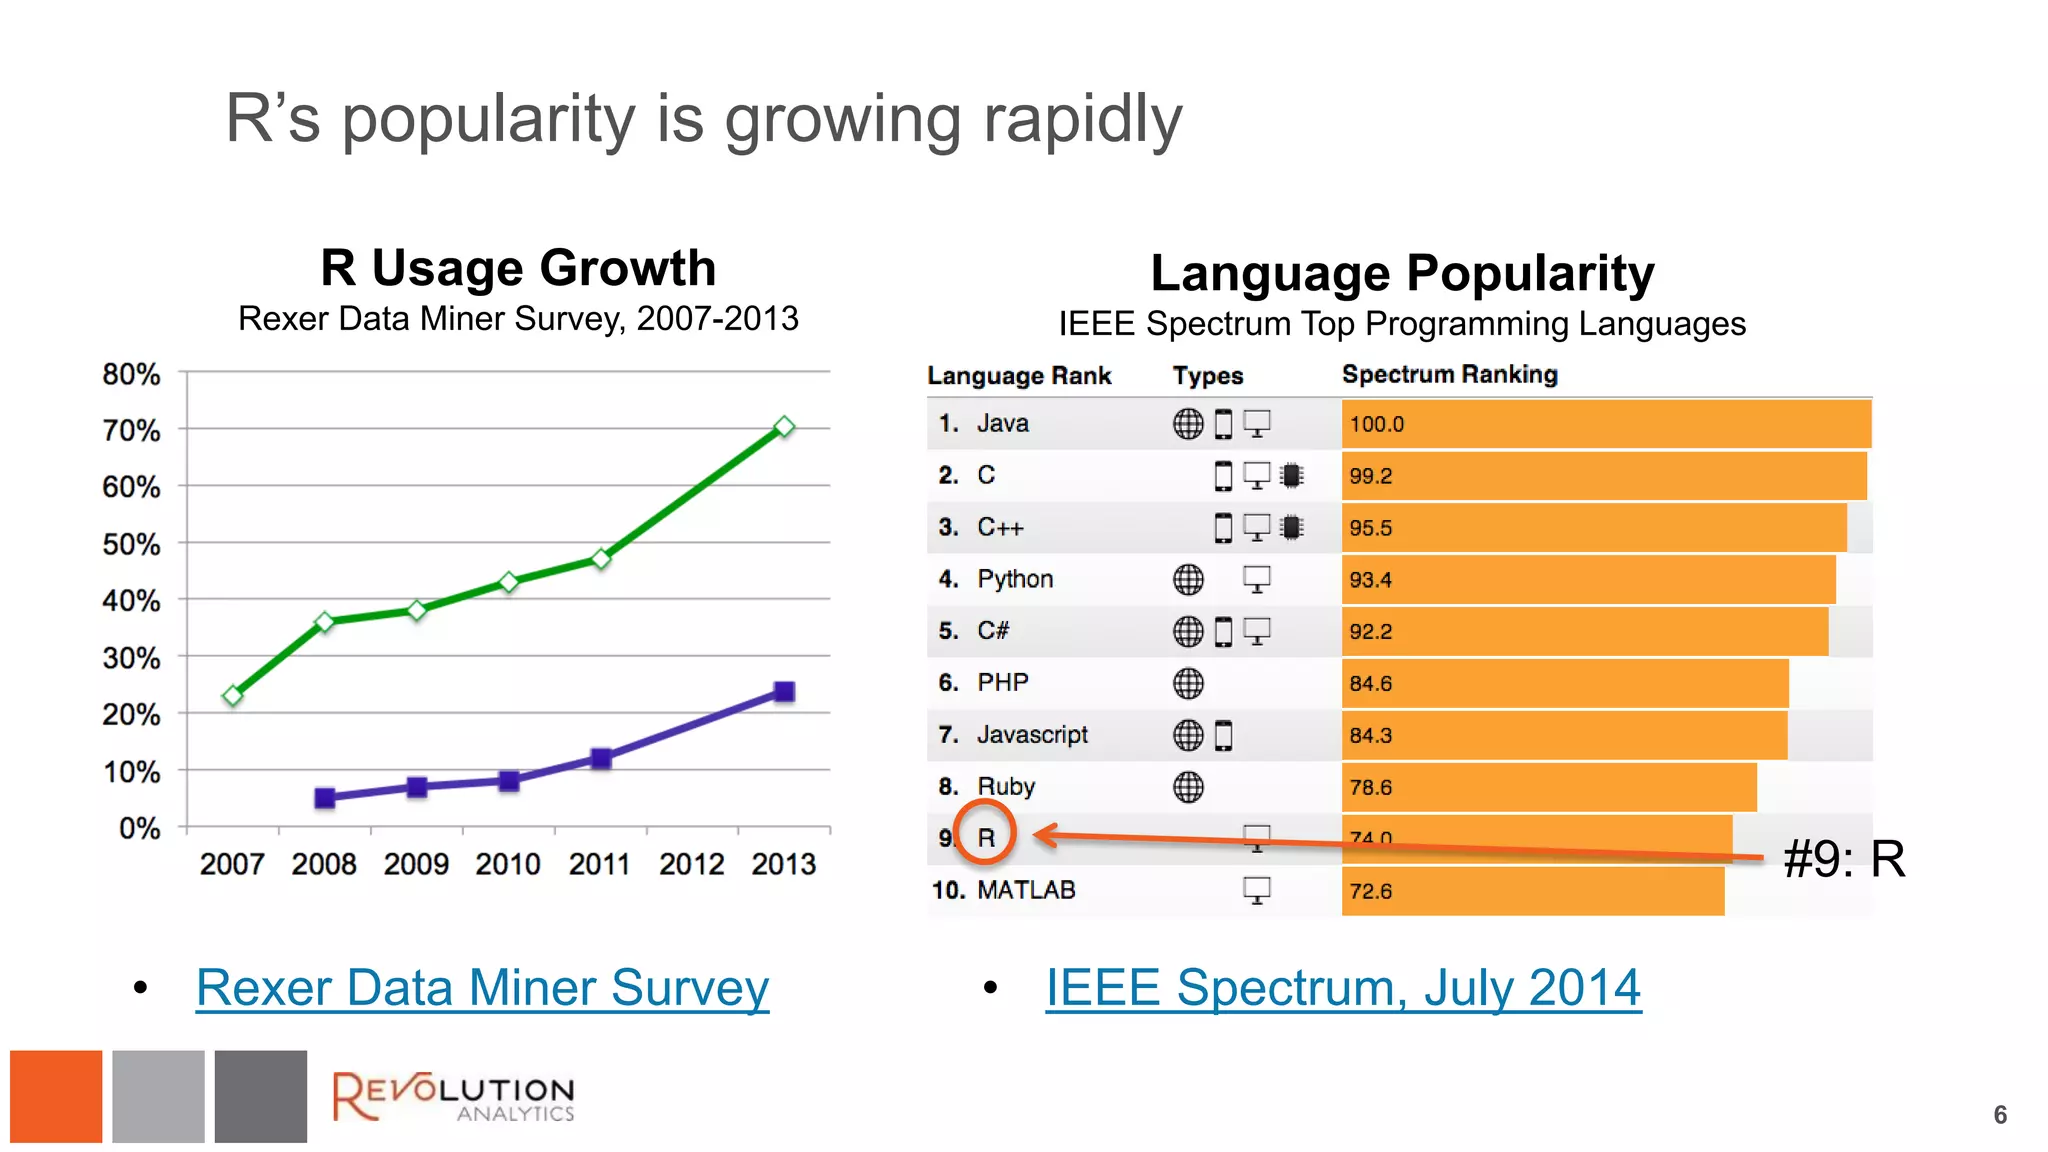
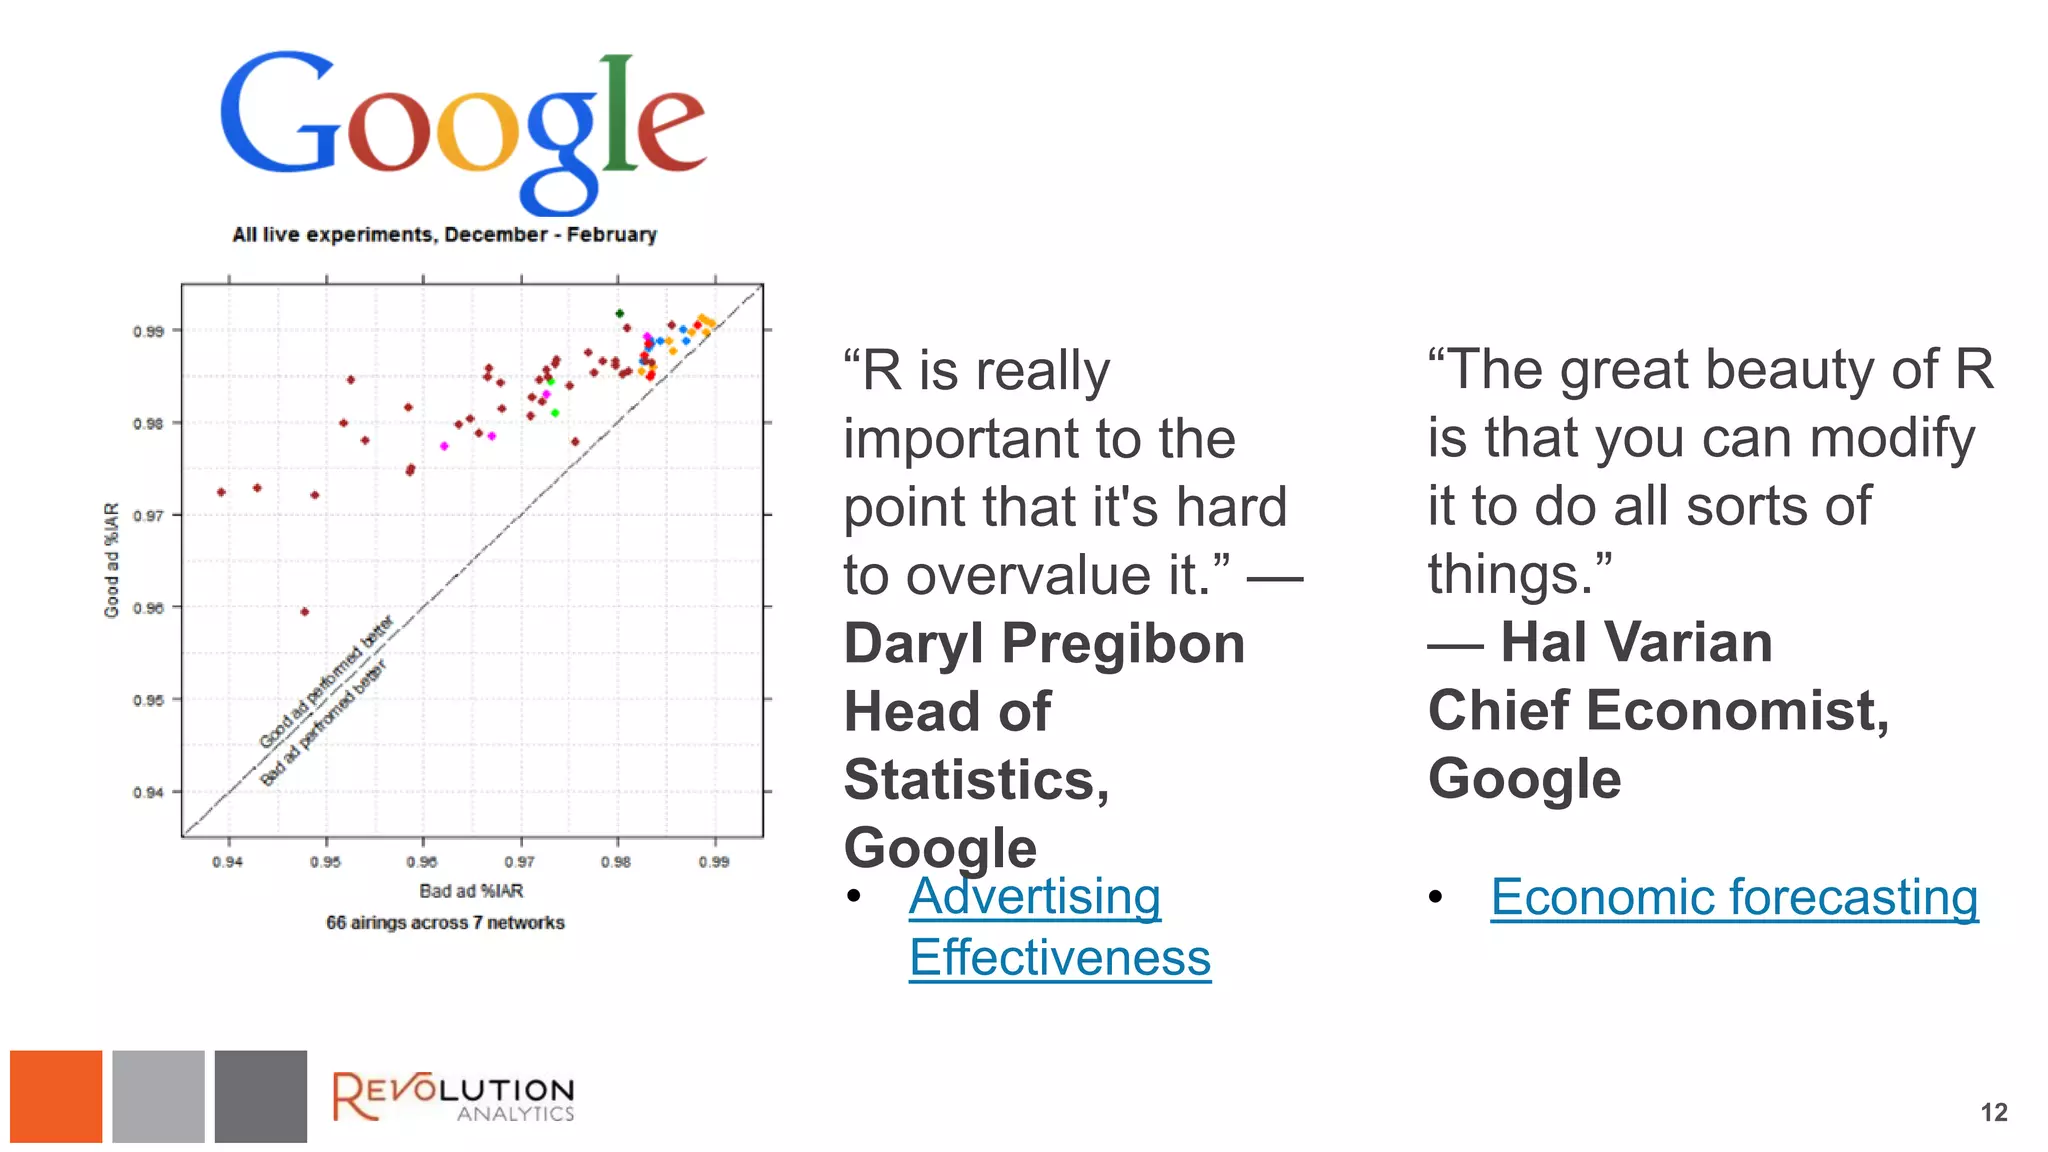
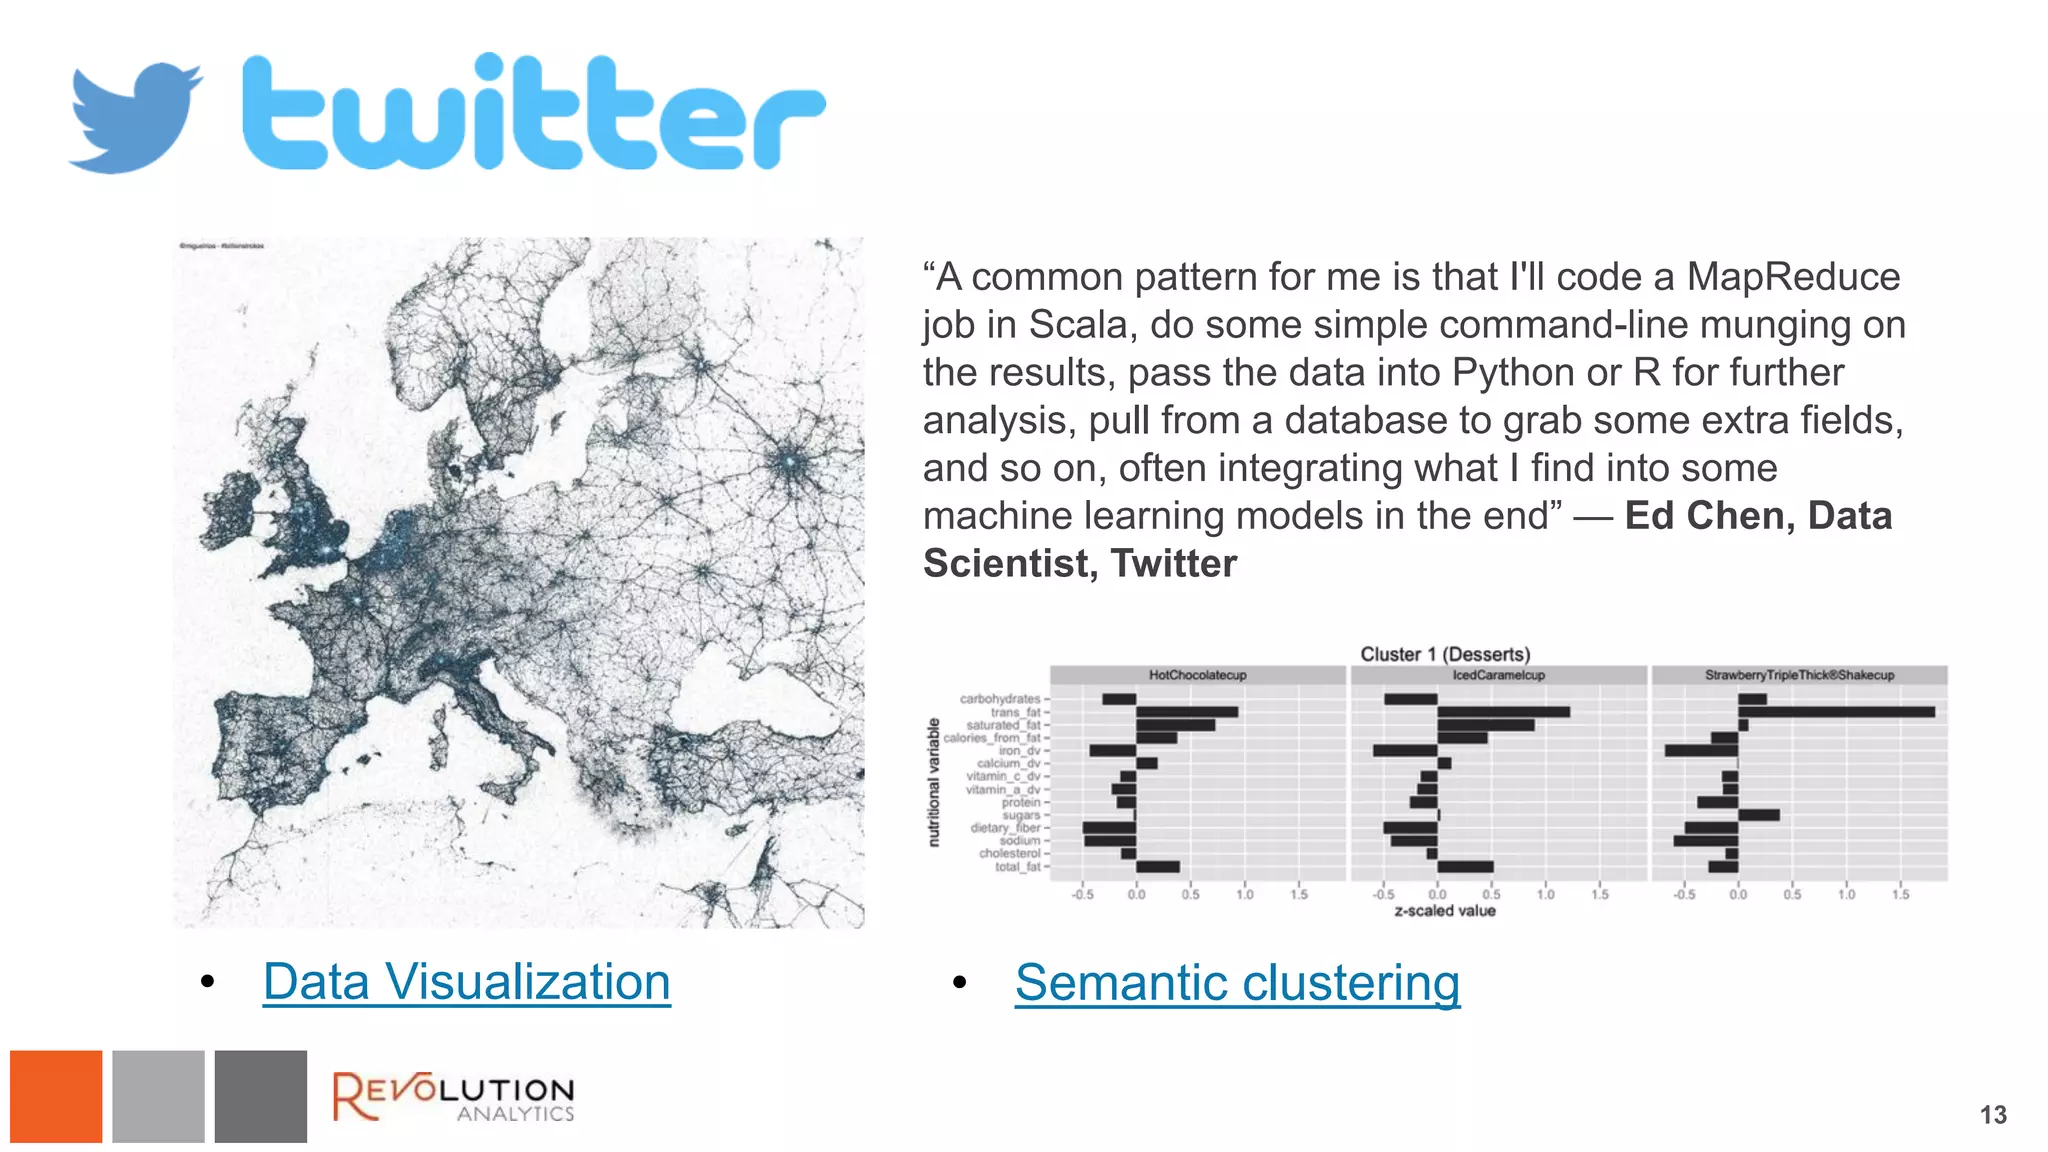
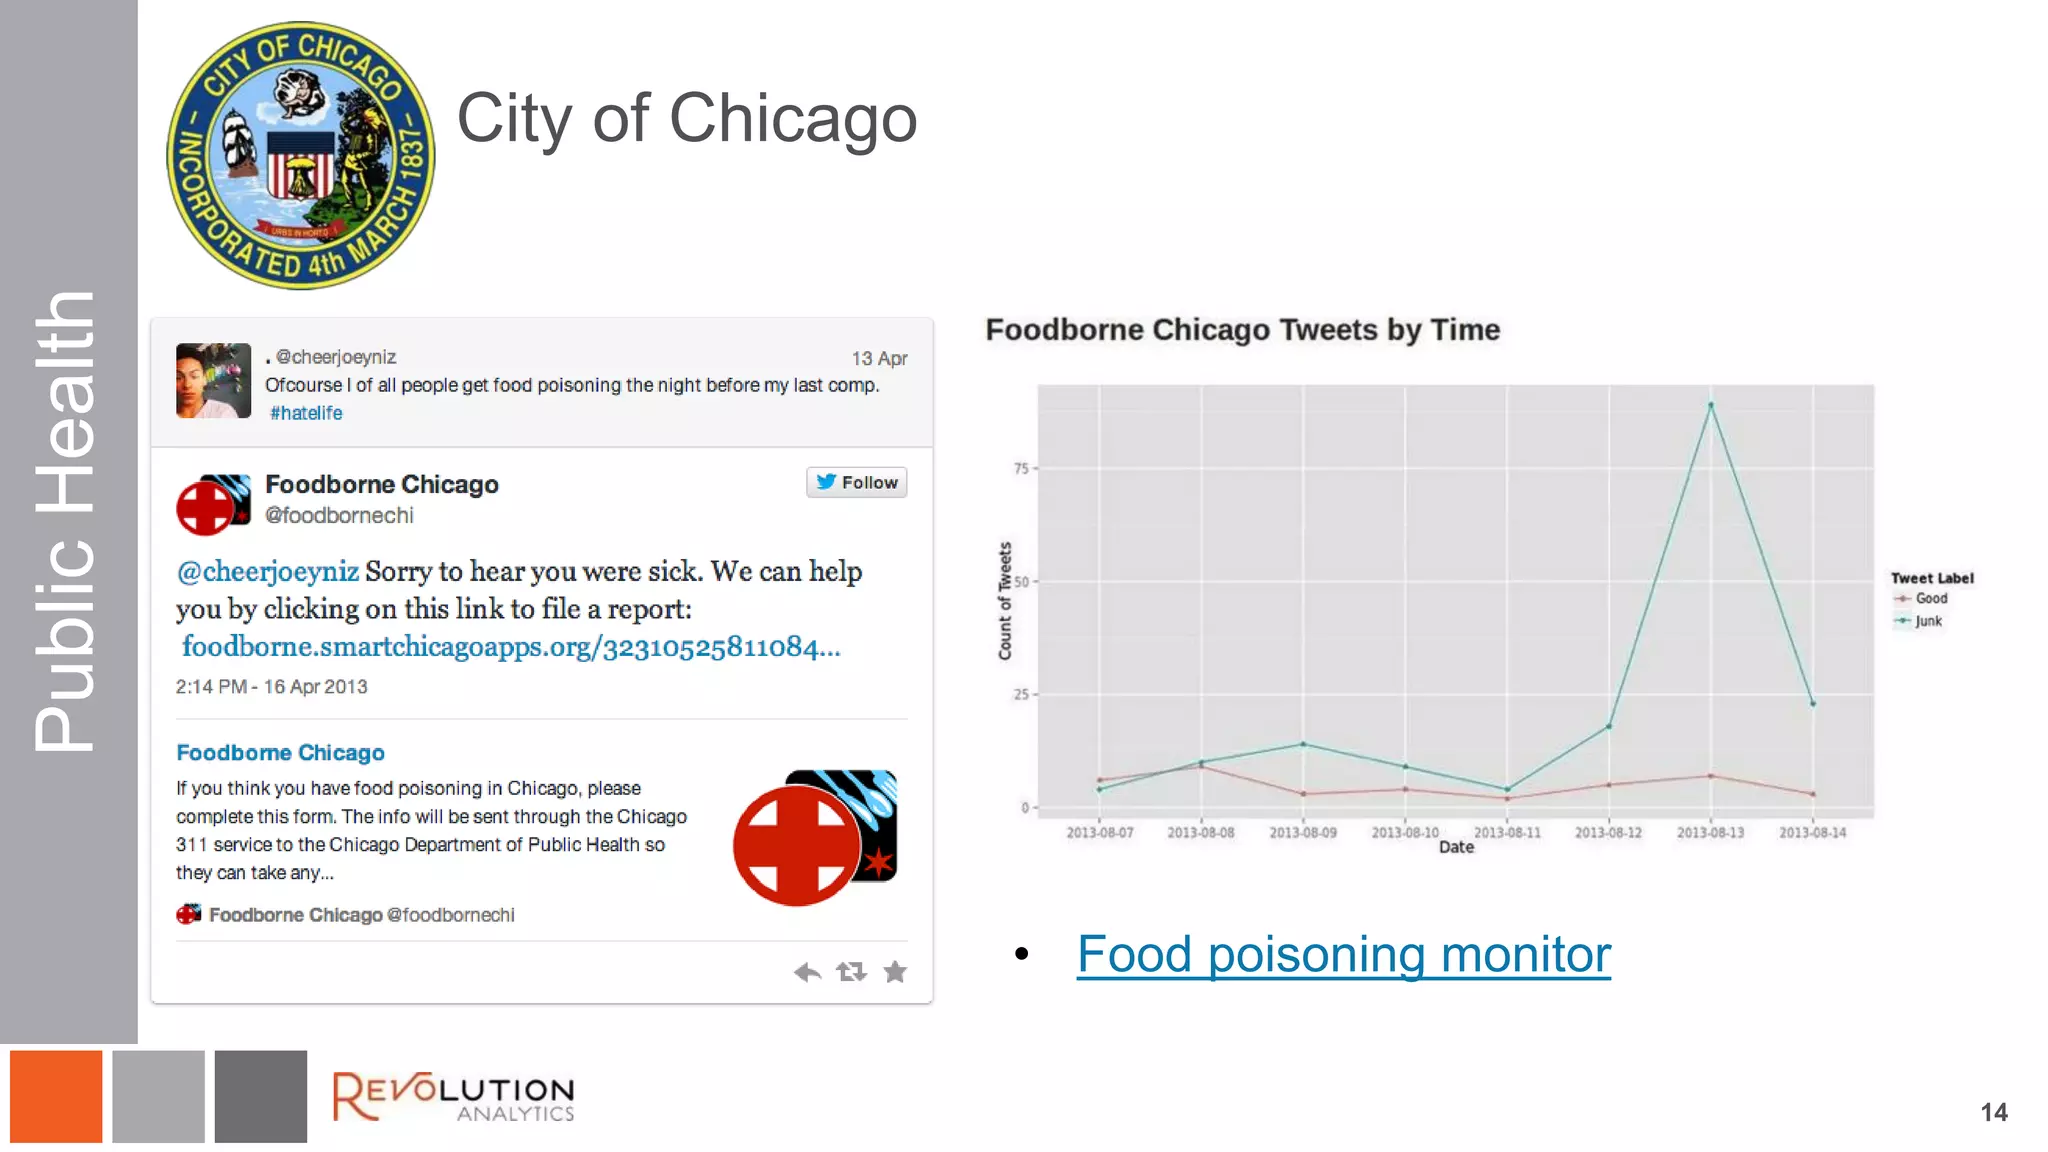
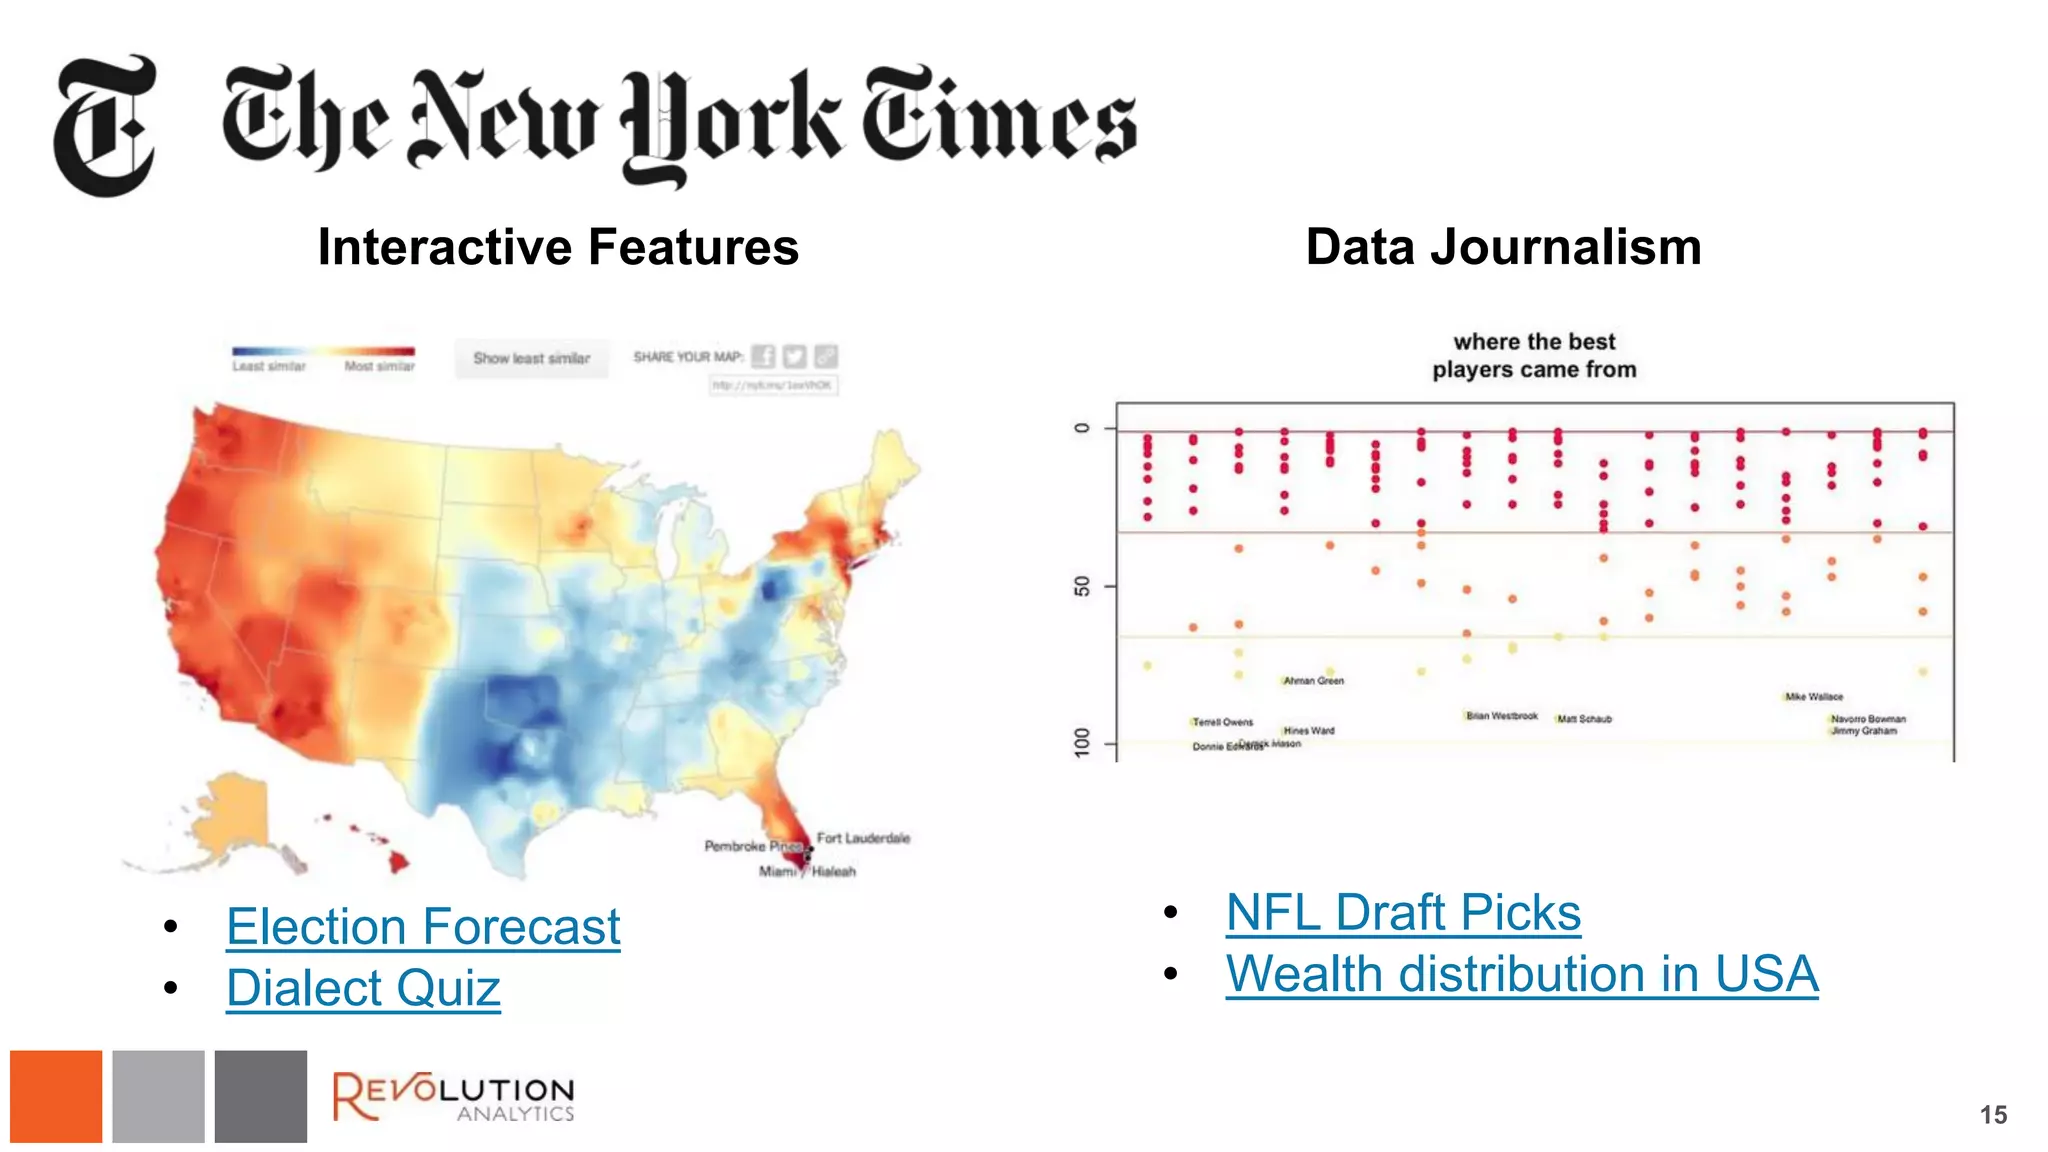
This document summarizes an event where Revolution Analytics discussed applications of R and lessons learned from its use in the marketplace. The presentation covered how companies like Facebook, Google, Twitter, The New York Times, gaming companies and others use R for exploratory data analysis, data visualization, statistical modeling and more. It also provided examples of how pharmaceutical, finance, retail and other industries apply R at scale. The document concludes with a discussion of Revolution Analytics' training and support services to help organizations build out their use of R.
Presenters:
Tal Sansani, CFA (Quantitative Analyst / Portfolio Manager, American Century Investments)
Sampath Thummati (IT Manager / Advisor, American Century Investments)
Presentation Date: February 26, 2013
This presentation is about how American Century Investments revamped their research and production platforms with Revolution R Enterprise.
[Presented to the 7th China R Users Conference, Beijing, May 2014.]
Adoption of the R language has grown rapidly in the last few years, and is ranked as the number-one data science language in several surveys. This accelerating R adoption curve has been driven by the Big Data revolution, and the fact that so many data scientists — having learned R at university — are actively unlocking the secrets hidden in these new, vast data troves.
In more than 6 years of writing for the Revolutions blog, I’ve discovered hundreds of applications of R in business, in government, and in the non-profit sector. Sometimes the use of R is obvious, and sometimes it takes a little bit of detective work to learn how R is operating behind the scenes. In this talk, I’ll begin by presenting some recent statistics on the growth of R. Then I’ll recount some of my favourite applications of R, and show how R is behind some amazing innovations in today’s world.
Adoption of the R language has grown rapidly in the last few years, and is ranked as the number-one data science language in several surveys. This accelerating R adoption curve has been driven by the Big Data revolution, and the fact that so many data scientists — having learned R at university — are actively unlocking the secrets hidden in these new, vast data troves. In more than 6 years of writing for the Revolutions blog, I’ve discovered hundreds of applications of R in business, in government, and in the non-profit sector. Sometimes the use of R is obvious, and sometimes it takes a little bit of detective work to learn how R is operating behind the scenes. In this talk, I'll recount some of my favourite applications of R, and show how R is behind some amazing innovations in today’s world.
Big Data Predictive Analytics with Revolution R Enterprise (Gartner BI Summit...Revolution Analytics
Presented by David Smith, Chief Community Officer, Revolution Analytics at Garner Business Intelligence and Analytics Summit, April 2014.
In this presentation, I'll introduce the open source R language — the modern standard for Data Science — and the enhanced performance, scalability and ease-of-use capabilities of Revolution R Enterprise. Customer case studies will illustrate Revolution R Enterprise as a component of the real-time analytics deployment process, via integration with Hadoop, database warehousing systems and Cloud platforms, to implement data-driven end-user applications.
In-Database Analytics Deep Dive with Teradata and RevolutionRevolution Analytics
Teradata and Revolution Analytics worked together to develop in-database analytical capabilities for Teradata Database. Teradata v14.10 provides a foundation for in-database analytics in Teradata. Revolution Analytics has ported its Revolution R Enterprise (RRE) Version 7.1 to use the in-database capabilities of version 14.10. With RRE inside Teradata, users can run fully parallelized algorithms in each node of the Teradata appliance to achieve performance and data scale heretofore unavailable. We'll get past the market-ecture quickly and dive into a “how it really works” presentation, review implications for system configuration and administration, and then take questions from Teradata users who will be charged with deploying and administering Teradata systems as platforms for big data analytics inside the database engine.
Performance and Scale Options for R with Hadoop: A comparison of potential ar...Revolution Analytics
R and Hadoop go together. In fact, they go together so well, that the number of options available can be confusing to IT and data science teams seeking solutions under varying performance and operational requirements.
Which configuration is faster for big files? Which is faster for sharing data and servers among groups? Which eliminates data movement? Which is easiest to manage? Which works best with iterative and multistep algorithms? What are the hardware requirements of each alternative?
This webinar is intended to help new users of R with Hadoop select their best architecture for integrating Hadoop and R, by explaining the benefits of several popular configurations, their performance potential, workload handling and programming model and administrative characteristics.
Presenters from Revolution Analytics will describe the options for using Revolution R Open and Revolution R Enterprise with Hadoop including servers, edge nodes, rHadoop and ScaleR. We’ll then compare the characteristics of each configuration as regards performance but also programming model, administration, data movement, ease of scaling, mixed workload handling, and performance for large individual analyses vs. mixed workloads.
Presented by Jack Norris, SVP Data & Applications at Gartner Symposium 2016.
Jack presents how companies from TransUnion to Uber use event-driven processing to transform their business with agility, scale, robustness, and efficiency advantages.
More info: https://www.mapr.com/company/press-releases/mapr-present-gartner-symposiumitxpo-and-other-notable-industry-conferences
Stephen Cantrell, kdb+ Developer at Kx Systems “Kdb+: How Wall Street Tech c...Dataconomy Media
Stephen Cantrell, kdb+ Developer at Kx Systems
“Kdb+: How Wall Street Tech can Speed up the World"
You can see some additional notes here:
https://github.com/cantrells/berlin_kdb_demo?files=1
Insight Platforms Accelerate Digital TransformationMapR Technologies
Many organizations have invested in big data technologies such as Hadoop and Spark. But these investments only address how to gain deeper insights from more diverse data. They do not address how to create action from those insights.
Forrester has identified an emerging class of software—insight platforms—that combine data, analytics, and insight execution to drive action using a big data fabric.
In this presentation, our guest, Forrester Research VP and Principal Analyst, Brian Hopkins, will:
o Present Forrester's recent research on insight platforms and big data fabrics.
o Provide strategies for getting more value from your big data investments.
MapR will share:
o Examples of leading companies and best practices for creating modern applications.
o How to combine analytics and operations to accelerate digital transformation and create competitive advantage.
Agile Big Data Analytics Development: An Architecture-Centric ApproachSoftServe
Presented at The Hawaii International Conference on System Sciences by Hong-Mei Chen and Rick Kazman (University of Hawaii), Serge Haziyev (SoftServe).
The Rise of the DataOps - Dataiku - J On the Beach 2016 Dataiku
Many organisations are creating groups dedicated to data. These groups have many names : Data Team, Data Labs, Analytics Teams….
But whatever the name, the success of those teams depends a lot on the quality of the data infrastructure and their ability to actually deploy data science applications in production.
In that regards a new role of “DataOps” is emerging. Similar, to Dev Ops for (Web) Dev, the Data Ops is a merge between a data engineer and a platform administrator. Well versed in cluster administration and optimisation, a data ops would have also a perspective on the quality of data quality and the relevance of predictive models.
Do you want to be a Data Ops ? We’ll discuss its role and challenges during this talk
Self-Service Data Science for Leveraging ML & AI on All of Your DataMapR Technologies
MapR has launched the MapR Data Science Refinery which leverages a scalable data science notebook with native platform access, superior out-of-the-box security, and access to global event streaming and a multi-model NoSQL database.
MapR on Azure: Getting Value from Big Data in the Cloud -MapR Technologies
Public cloud adoption is exploding and big data technologies are rapidly becoming an important driver of this growth. According to Wikibon, big data public cloud revenue will grow from 4.4% in 2016 to 24% of all big data spend by 2026. Digital transformation initiatives are now a priority for most organizations, with data and advanced analytics at the heart of enabling this change. This is key to driving competitive advantage in every industry.
There is nothing better than a real-world customer use case to help you understand how to get value from big data in the cloud and apply the learnings to your business. Join Microsoft, MapR, and Sullexis on November 10th to:
Hear from Sullexis on the business use case and technical implementation details of one of their oil & gas customers
Understand the integration points of the MapR Platform with other Azure services and why they matter
Know how to deploy the MapR Platform on the Azure cloud and get started easily
You will also get to hear about customer use cases of the MapR Converged Data Platform on Azure in other verticals such as real estate and retail.
Speakers
Rafael Godinho
Technical Evangelist
Microsoft Azure
Tim Morgan
Managing Director
Sullexis
Enabling Real-Time Business with Change Data CaptureMapR Technologies
Machine learning (ML) and artificial intelligence (AI) enable intelligent processes that can autonomously make decisions in real-time. The real challenge for effective ML and AI is getting all relevant data to a converged data platform in real-time, where it can be processed using modern technologies and integrated into any downstream systems.
Big data analytics on teradata with revolution r enterprise bill jacobsBill Jacobs
Revolution Analytics brings big data analytics to Teradata database. Presentation from Teradata Partners, October 2013 overviewing Revolution R Enterprise for Teradata by Bill Jacobs, Director, Product Marketing, Revolution Analytics.
In this presentation from Revolution Analytics, Bill Jacobs presents: Are You Ready for Big Data Analytics?
"Revolution Analytics delivers advanced analytics software at half the cost of existing solutions. By building on open source R—the world's most powerful statistics software—with innovations in big data analysis, integration and user experience, Revolution Analytics meets the demands and requirements of modern data-driven businesses."
Learn more: http://www.revolutionanalytics.com
Watch the presentation video: http://wp.me/p3RLEV-12S
This session will demonstrate how the all-star line-up featuring R and Storm enables real-time processing on massive data sets; a real home run! The presenters will use actual baseball data and a real-world use case to compose an implementation of the use case as Storm components (spouts, bolts, etc.) and highlight how R can be an effective tool in prototyping a solution. Attendees will leave the session with information that could easily be applied for other use cases such as video game analytics, fraud detection, intrusion detection, and consumer propensity to buy calculations.
The business need for real-time analytics at large scale has focused attention on the use of Apache Storm, but an approach that is sometimes overlooked is the use of Storm and R together. This novel combination of real-time processing with Storm and the practical but powerful statistical analysis offered by R substantially extends the usefulness of Storm as a solution to a variety of business critical problems. By architecting R into the Storm application development process, Storm developers can be much more effective. The aim of this design is not necessarily to deploy faster code but rather to deploy code faster. Just a few lines of R code can be used in place of lengthy Storm code for the purpose of early exploration – you can easily evaluate alternative approaches and quickly make a working prototype.
Crawl, Walk, Run: How to Get Started with HadoopInside Analysis
The Briefing Room with William McKnight and Splice Machine
Live Webcast Jan. 20, 2015
Watch the archive: https://bloorgroup.webex.com/bloorgroup/lsr.php?RCID=b7509f6e4072f18344831dc83a20161a
People get excited when shiny a new technology comes along, especially when it promises to solve major pain points. But sometimes jumping in with both feet too soon can cause unforeseen and unpleasant consequences. When organizations want to take advantage of the next big thing, it’s important to first take a hard look at what the company’s needs and resources are before making the big leap into the unknown.
Register for this episode of The Briefing Room to hear veteran Analyst William McKnight as he explains how Hadoop is transitioning from a novel concept to a key component of modern data management architectures. He’ll be briefed by Rich Reimer of Splice Machine, who will discuss how they have helped customers get started in Hadoop with an Operational Data Lake, a Hadoop-based, scale-out solution designed to replace stressed out Operational Data Stores (ODSs). He will show an Operational Data Lake becomes a great on-ramp to Big Data, ensuring that companies get immediate value from their Hadoop investment and avoid the trap of the never-ending "science" project.
Visit InsideAnalysis.com for more information.
A webinar on how Neo4j customers like Nasa, AirBnB, eBay, government agencies, investigative journalists and others are building Knowledge Graphs to inform today and tomorrow’s solutions.
Are you getting the most out of your data?SAS Canada
Data is an organizations most valuable asset, but raw data by itself has little value. To drive data’s worth, it must be managed and processed to extract value and information that decision makers can leverage and turn into actionable insights. It is the ways in which a company choses to put that information to use that will determine the true value of its data.
Through business intelligence and business analytic tools, businesses are enabling themselves to make more strategic, accurate decisions, while optimizing business processes. Hear from Info-Tech Research Group and learn what you need to consider when choosing an analytics solution provider. The webinar will highlight Info-Tech Research Group’s recently published vendor landscape for selecting and implementing Business Intelligence and Business Analytics solutions. The report positions SAS as the only leader across all four categories of Enterprise BI, Mid-Market BI, Enterprise BA and Mid-Market BA.
How to Identify, Train or Become a Data ScientistInside Analysis
The Briefing Room with Neil Raden and Actian
Live Webcast Sept. 3, 2013
Visit: www.insideanalysis.com
Respected research institutes keep saying we have a shortage of data scientists, which makes sense because the title is so new. But most business analysts and serious data managers have at least some of the necessary training to fill this new role. And any number of curious, diligent professionals can learn how to be a data scientist, if they can get access to the right tools and education.
Register for this episode of The Briefing Room to hear veteran Analyst Neil Raden of Hired Brains offer insights about how to identify the key characteristics of a data scientist role. He'll then explain how professionals can incrementally improve their data science skills. He'll be briefed by John Santaferraro of Actian, who will showcase his company's Data Flow Engine, which provides unprecedented visual access to highly complex data flows. This, coupled with Actian's multiple analytics database technologies, opens the door to whole new avenues of possible insights.
Gain a Holistic View of your Customer's JourneyPlatfora
Today, companies are capturing information about customers at every touchpoint, but the reality is that most companies are working with siloed marketing data because they’re using disparate tools to track online, offline, web, social, mobile, and advertising data.
In this presentation, Rod Fontecilla, VP of Application Modernization at Unisys, explains how his team uses Platfora to analyze, interact and understand data to drive customer success at Unisys.
Rod will highlight three specific Unisys use cases of Platfora, one of which involved a timely text survey sentiment analysis that produced insights enabling a course correction in favor of improved customer satisfaction.
Revolution in Business Analytics-Zika Virus ExampleBardess Group
Even from the “man in the street” perspective, there is a sense that we are living in an increasingly algorithmic world. Self-driving cars, pizza delivery by drone, and smart houses are commonplace. The technologies enabling this revolution are both simultaneously mature and evolving rapidly.
In this session, we’ll took a look at a real world problem, the recent global outbreak of the ZIka virus, and used data analytics technologies to gain valuable insights that can assist authorities and the general public to understand and potentially prevent the spread of this disease.
Bardess Group, a sponsor of the event and business analytics consulting firm, will demonstrate how huge, extremely jagged data from a variety of sources can be collected and prepared and rapidly made available for analysis. Advanced machine learning and predictive analysis further enhance the value of those insights.
Finally, Bardess will make the case that using a systematic approach to conceptually visualize the strategic journey to insightful business analytics, the analytics value chain, can assist any organization prepare for this revolution in analytics.
Also see http://cloudera.qlik.com for the demos.
In this slidedeck, Infochimps Director of Product, Tim Gasper, discusses how Infochimps tackles business problems for customers by deploying a comprehensive Big Data infrastructure in days; sometimes in just hours. Tim unlocks how Infochimps is now taking that same aggressive approach to deliver faster time to value by helping customers develop analytic applications with impeccable speed.
Similar to Applications in R - Success and Lessons Learned from the Marketplace (20)
Presented to eRum (Budapest), May 2018
There are many common workloads in R that are "embarrassingly parallel": group-by analyses, simulations, and cross-validation of models are just a few examples. In this talk I'll describe the doAzureParallel package, a backend to the "foreach" package that automates the process of spawning a cluster of virtual machines in the Azure cloud to process iterations in parallel. This will include an example of optimizing hyperparameters for a predictive model using the "caret" package.
By David Smith. Presented at Microsoft Build (Seattle), May 7 2018.
Your data scientists have created predictive models using open-source tools, proprietary software, or some combination of both, and now you are interested in lifting and shifting those models to the cloud. In this talk, I'll describe how data scientists can transition their existing workflows — while using mostly the same tools and processes — to train and deploy machine learning models based on open source frameworks to Azure. I'll provide guidance on keeping connections to data sources up-to-date, evaluating and monitoring models, and deploying applications that make use of those models.
Presentation delivered by David Smith to NY R Conference https://www.rstats.nyc/, April 2018:
Minecraft is an open-world creativity game, and a hit with kids. To get kids interested in learning to program with R, we created the "miner" package. This package is a collection of simple functions that allow you to connect with a Minecraft instance, manipulate the world within by creating blocks and controlling the player, and to detect events within the world and react accordingly.
The miner package is intended mainly for kids, to inspire them to learn R while playing Minecraft. But the development of the package also provides some useful insights into how to build an R package to interface with a persistent API, and how to instruct others on its use. In this talk I'll describe how to set up your own Minecraft server, and how to use and extend the package. I'll also provide a few examples of the package in action in a live Minecraft session.
While Python is a widely-used tool for AI development, in this talk I'll make the case for considering R as a platform for developing models for intelligent applications. Firstly, R provides a first-class experience working deep learning frameworks with its keras integration. Equally importantly, it provides the most comprehensive suite of statistical data analysis tools, which are extremely useful for many intelligent applications such as transfer learning. I'll give a few high-level examples in this talk, and we'll go into further detail in the accompanying interactive code lab.
There are many common workloads in R that are "embarrassingly parallel": group-by analyses, simulations, and cross-validation of models are just a few examples. In this talk I'll describe several techniques available in R to speed up workloads like these, by running multiple iterations simultaneously, in parallel.
Many of these techniques require the use of a cluster of machines running R, and I'll provide examples of using cloud-based services to provision clusters for parallel computations. In particular, I will describe how you can use the SparklyR package to distribute data manipulations using the dplyr syntax, on a cluster of servers provisioned in the Azure cloud.
Presented by David Smith at Data Day Texas in Austin, January 27 2018.
A look at the changing perceptions of R, from the early days of the R project to today. Microsoft sponsor talk, presented by David Smith to the useR!2017 conference in Brussels, July 5 2017.
Predicting Loan Delinquency at One Million Transactions per SecondRevolution Analytics
Real-time applications of predictive models must be able to generate predictions at the rate that transactions are generated. Previously, such applications of models trained using R needed to be converted to other languages like C++ or Java to achieve the required throughput. In this talk, I’ll describe how to use the in-database R processing capabilities of Microsoft R Server to detect fraud in a SQL Server database of loan records at a rate exceeding one million transactions per second. I will also show the process of training the underlying gradient-boosted tree model on a large training set using the out-of-memory algorithms of Microsoft R.
Presented by David Smith at The Data Science Summit, Chicago, April 20 2017.
The ability to independently reproduce results is a critical issue within the scientific community today, and is equally important for collaboration and compliance in business. In this talk, I'll introduce several features available in R that help you make reproducibility a standard part of your data science workflow. The talk will include tips on working with data and files, combining code and output, and managing R's changing package ecosystem.
Presented by David Smith, R Community Lead (Microsoft), at Monktoberfest October 2016.
The value of open source isn’t just in the software itself. The communities that form around open source software provide just as much value and sometimes even more: in ongoing development, in documentation, in support, in marketing, and as a supply of ready-trained employees. Companies who build on open source tend to focus on the software, but neglect communities at their peril.
In this talk, I share some of my experiences in building community for an open-source software company, Revolution Analytics, and perspectives since the acquisition by Microsoft in 2015.
R is more than just a language. Many of the reasons why R has become such a popular tool for data science come from the ecosystem surrounding the R project. R users benefit from the many resources and packages created by the community, while commercial companies (including Microsoft) provide tools to extend and support R, and services to help people use R.
In this talk, I will give an overview of the R Ecosystem and describe how it has been a critical component of R’s success, and include several examples of Microsoft’s contributions to the ecosystem.
(Presented to EARL London, September 2016)
(Presented by David Smith at useR!2016, June 2016. Recording: https://channel9.msdn.com/Events/useR-international-R-User-conference/useR2016/R-at-Microsoft )
Since the acquisition of Revolution Analytics in April 2015, Microsoft has embarked upon a project to build R technology into many Microsoft products, so that developers and data scientists can use the R language and R packages to analyze data in their data centers and in cloud environments.
In this talk I will give an overview (and a demo or two) of how R has been integrated into various Microsoft products. Microsoft data scientists are also big users of R, and I'll describe a couple of examples of R being used to analyze operational data at Microsoft. I'll also share some of my experiences in working with open source projects at Microsoft, and my thoughts on how Microsoft works with open source communities including the R Project.
Hadoop is famously scalable. Cloud Computing is famously scalable. R – the thriving and extensible open source Data Science software – not so much. But what if we seamlessly combined Hadoop, Cloud Computing, and R to create a scalable Data Science platform? Imagine exploring, transforming, modeling, and scoring data at any scale from the comfort of your favorite R environment. Now, imagine calling a simple R function to operationalize your predictive model as a scalable, cloud-based Web Service. Learn how to leverage the magic of Hadoop on-premises or in the cloud to run your R code, thousands of open source R extension packages, and distributed implementations of the most popular machine learning algorithms at scale.
Show drafts
volume_up
Empowering the Data Analytics Ecosystem: A Laser Focus on Value
The data analytics ecosystem thrives when every component functions at its peak, unlocking the true potential of data. Here's a laser focus on key areas for an empowered ecosystem:
1. Democratize Access, Not Data:
Granular Access Controls: Provide users with self-service tools tailored to their specific needs, preventing data overload and misuse.
Data Catalogs: Implement robust data catalogs for easy discovery and understanding of available data sources.
2. Foster Collaboration with Clear Roles:
Data Mesh Architecture: Break down data silos by creating a distributed data ownership model with clear ownership and responsibilities.
Collaborative Workspaces: Utilize interactive platforms where data scientists, analysts, and domain experts can work seamlessly together.
3. Leverage Advanced Analytics Strategically:
AI-powered Automation: Automate repetitive tasks like data cleaning and feature engineering, freeing up data talent for higher-level analysis.
Right-Tool Selection: Strategically choose the most effective advanced analytics techniques (e.g., AI, ML) based on specific business problems.
4. Prioritize Data Quality with Automation:
Automated Data Validation: Implement automated data quality checks to identify and rectify errors at the source, minimizing downstream issues.
Data Lineage Tracking: Track the flow of data throughout the ecosystem, ensuring transparency and facilitating root cause analysis for errors.
5. Cultivate a Data-Driven Mindset:
Metrics-Driven Performance Management: Align KPIs and performance metrics with data-driven insights to ensure actionable decision making.
Data Storytelling Workshops: Equip stakeholders with the skills to translate complex data findings into compelling narratives that drive action.
Benefits of a Precise Ecosystem:
Sharpened Focus: Precise access and clear roles ensure everyone works with the most relevant data, maximizing efficiency.
Actionable Insights: Strategic analytics and automated quality checks lead to more reliable and actionable data insights.
Continuous Improvement: Data-driven performance management fosters a culture of learning and continuous improvement.
Sustainable Growth: Empowered by data, organizations can make informed decisions to drive sustainable growth and innovation.
By focusing on these precise actions, organizations can create an empowered data analytics ecosystem that delivers real value by driving data-driven decisions and maximizing the return on their data investment.
Techniques to optimize the pagerank algorithm usually fall in two categories. One is to try reducing the work per iteration, and the other is to try reducing the number of iterations. These goals are often at odds with one another. Skipping computation on vertices which have already converged has the potential to save iteration time. Skipping in-identical vertices, with the same in-links, helps reduce duplicate computations and thus could help reduce iteration time. Road networks often have chains which can be short-circuited before pagerank computation to improve performance. Final ranks of chain nodes can be easily calculated. This could reduce both the iteration time, and the number of iterations. If a graph has no dangling nodes, pagerank of each strongly connected component can be computed in topological order. This could help reduce the iteration time, no. of iterations, and also enable multi-iteration concurrency in pagerank computation. The combination of all of the above methods is the STICD algorithm. [sticd] For dynamic graphs, unchanged components whose ranks are unaffected can be skipped altogether.
Applications in R - Success and Lessons Learned from the Marketplace
1. Applications in R
Success and Lessons Learned from the Marketplace
David Smith
Chief Community Officer
Revolution Analytics
July 29, 2014
Neera Talbert
VP Professional Services
Revolution Analytics
2. Agenda
Introduction to R
Growth of R
Applications of R
Q&A
David Smith
Chief Community Officer
@revodavid
Editor, blog.revolutionanalytics.com
Co-author, “Introduction to R”
3. 3
OUR COMPANY
The leading provider
of advanced analytics
software and services
based on open source R,
since 2007
OUR SOFTWARE
The only Big Data, Big
Analytics software platform
based on the data science
language R
SOME KUDOS
Visionary
Gartner Magic Quadrant
for Advanced Analytics
Platforms, 2014
4. What is R?
Most widely used data analysis software
• Used by 2M+ data scientists, statisticians and analysts
Most powerful statistical programming language
• Flexible, extensible and comprehensive for productivity
Create beautiful and unique data visualizations
• As seen in New York Times, Twitter and Flowing Data
Thriving open-source community
• Leading edge of analytics research
Fills the talent gap
• New graduates prefer R
www.revolutionanalytics.com/what-r
6. 6
R’s popularity is growing rapidly
R Usage Growth
Rexer Data Miner Survey, 2007-2013
• Rexer Data Miner Survey • IEEE Spectrum, July 2014
#9: R
Language Popularity
IEEE Spectrum Top Programming Languages
7. 7
R is among the highest-paid IT skills in the US
Dice Tech Salary Survey, January 2014 O’Reilly Strata 2013 Data Science Salary Survey
8. 8
Technical Support for Open Source R
AdviseR™ from Revolution Analytics
Technical support for open source R, from the R experts.
Email and phone support 8AM-6PM, Mon-Fri
Support for R, validated packages, and third-party software
connections
On-line case management and knowledgebase
Access to technical resources, documentation and user forums
Exclusive on-line webinars from community experts
Guaranteed response times
Also available: expert hands-on and on-line training for R, from
Revolution Analytics AcademyR.
www.revolutionanalytics.com/AdviseR
R SUPPORT
12 MONTHS
$795
PER USER
10. Facebook
• Exploratory Data
Analysis
• Experimental Analysis
“Generally, we use R to move
fast when we get a new data
set. With R, we don’t need to
develop custom tools or write
a bunch of code. Instead, we
can just go about cleaning
and exploring the data.” —
Solomon Messing, data
scientist at Facebook
11. Facebook
• Big-Data Visualization
“It resonated with
many people. It's not
just a pretty picture,
it's a reaffirmation of
the impact we have
in connecting
people, even across
oceans and
borders.” — Paul
Butler, data
scientist, Facebook
12. Google
12
“The great beauty of R
is that you can modify
it to do all sorts of
things.”
— Hal Varian
Chief Economist,
Google
• Advertising
Effectiveness
“R is really
important to the
point that it's hard
to overvalue it.” —
Daryl Pregibon
Head of
Statistics,
Google
• Economic forecasting
13. 13
Twitter
• Data Visualization • Semantic clustering
“A common pattern for me is that I'll code a MapReduce
job in Scala, do some simple command-line munging on
the results, pass the data into Python or R for further
analysis, pull from a database to grab some extra fields,
and so on, often integrating what I find into some
machine learning models in the end” — Ed Chen, Data
Scientist, Twitter
15. 15
The New York Times
Interactive Features
• Election Forecast
• Dialect Quiz
Data Journalism
• NFL Draft Picks
• Wealth distribution in USA
16. 16
The New York Times
Data Visualization
• Facebook IPO
• Baseball legends
17. 17
Video Gaming
• Multiplayer Matchmaking
• Player Churn
• Game design
• Difficulty curve
• Level trouble-spots
• In-game purchase optimization
• Fraud detection
• Player communities
• Game Analysis
VideoGames
18. 18
Housing
• Crime mapping
• choroplethr package
“The core innovation that Zillow
offers are its advanced
statistical predictive products,
including the Zestimate®, the
Rent Zestimate and the ZHVI®
family of real estate indexes. By
using R in production as well as
research, Zillow maximizes
flexibility and minimizes the
latency in rolling out updates
and new products.”
• Statistical forecasting
RealEstate
20. 20
Pharmaceuticals “R use at the FDA is completely
acceptable and has not caused
any problems.” — Dr Jae
Brodsky, Office of
Biostatistics, Food and Drug
Administration
Regulatory Drug Approvals
• Reproducible research
• Accurate, reliable and consistent statistical analysis
• Internal reporting (Section 508 compliance)
21. Power
“We’ve combined Revolution R
Enterprise and Hadoop to build and
deploy customized exploratory data
analysis and GAM survival models for
our marketing performance
management and attribution platform.
Given that our data sets are already in
the terabytes and are growing rapidly,
we depend on Revolution R Enterprise’s
scalability and power – we saw about
a 4x performance improvement on 50
million records. It works brilliantly.”
- CEO, John Wallace, DataSong
4X performance
50M records scored daily
Scalability
“We’ve been able to scale our solution to a
problem that’s so big that most companies could
not address it. If we had to go with a different
solution we wouldn’t be as efficient as we are
now.”
- SVP Analytics, Kevin Lyons, eXelate
TB’s data from 200+ data sources
10’s thousands attributes
100’s millions of scores daily
2X data
2X attributes
no impact on performance
Performance
“We need a high-performance
analytics infrastructure because
marketing optimization is a lot like a
financial trading. By watching the
market constantly for data or market
condition updates, we can now
identify opportunities for our clients
that would otherwise be lost.”
- Chief Analytics Officer, Leon Zemel,
[x+1]
MarketingAnalytics
22. All of Open Source R plus:
Big Data scalability
High-performance analytics
Development and deployment
tools
Data source connectivity
Application integration framework
Multi-platform architecture
Technical Support
Available training and services
22
is the
Big Data Big Analytics Platform
24. 24
Neera Talbert, VP Big Data & Advanced Analytic Services
Leads Services at Revolution Analytics
Fifteen years of experience the business analytics software industry
Works with Fortune 500 companies to define analytics strategy, implement analytic based
decision making, reduce decision latency, and increase speed of decision making
– Analytics, business intelligence, big data analytics, risk
– Customer intelligence, supply chain, manufacturing, retail, oil & gas, public sector.
25. Organizational
Readiness
“There will be almost half a million jobs in five years, and a
shortage of up to 190,000 qualified data scientists, plus a
need for 1.5 million executives and support staff who have
an understanding of data”
McKinsey Global Institute
April 2013
26. Opportunity to develop talent
Data Science “the sexiest job in the 21st
century,” - Harvard Business Review
A cross between computer engineers,
statisticians and business analyst – people who
ask good questions and open to working with
unstructured information
Universities can’t produce them fast enough –
need 60% more resources – McKinsey Global
Institute
27. Our Philosophy
“The Hands-on exercises were the best part of Revolution Analytics
training”
- A participant from a global telecom company
29. RRE Certification Testing
Demonstrate your R and RRE programming knowledge
– Fundamentals in R Language
– Data Management in Revolution R Enterprise
– Modeling in Revolution R Enterprise
Independently proctored exam – online and onsite
30. Training Data Science team for Big Data Analytics
30
“Given that our data sets are already in the
terabytes and are growing rapidly, we depend
on Revolution R Enterprise’s scalability
and power. We saw about a 4x
performance improvement on 50 million
records. It works brilliantly.”
CEO, John Wallace
(DataSong formerly named UpStream)
4X performance
50M+ records scored daily
Key Technology: Revolution R Enterprise and Hadoop,
replacing SAS and Open Source R
Outcomes: Massively scalable infrastructure to
support attribution and optimization at an individual
customer level (segments of one) for clients such as
Williams-Sonoma. Client saved $250K in one campaign.
Rapid development and deployment of customer-specific
models, using innovative analytic techniques such as big
data GAM Survival models
Bottom Line: Driving revenue lift and cost savings through
marketing optimization
Profile: Multi-channel marketing attribution
and analytics software developer and service
provider. Growing, innovative, cost-conscious.
31. Model Development for Supply Chain Analytics with Hadoop
31
Profile: The Application Development team worked with
Revolution Analytics Consultants to build cloud-based supply
chain analytics platform
Key Technology and Services: R for Big Data
Analytics, Consulting, Training
Analytic Approach: Aggregate data from 15 data
sources including ERP data, store sales data and
sales forecast data to 25,000 store locations, 50 SKUs
nightly across 6 forecast models, order planning
models, running back tests and validation. Worked
with client to establish big data environment and
models that will generate 6.5 billion computations
daily by end of the year (in a 4-hour window for
processing). Scale and performance will allow new
capabilities such as seasonality, promotions and
incentives.
>Sales and Demand Data Analysis
>R/RRE Model Development
Bottom line: Work with client to develop predictive models,
starting with rigorous forecasts across various models,
generating forecast statistics and scoring each model
against historical data to come up with the best fit. The
forecast is input into an order-planning model that generates
recommendations to optimize product distribution and
ensure in-stock rate targets are achieved so that the right
amount of product is in the right location at the right time. .
“The amount of analytic horsepower required for this
application cannot be supported in traditional means; it
would require millions of dollars of hardware. R +
Hadoop is allowing us to have the compute capacity to
run 6.5 billion computations on nightly basis to
generate order plans for our clients.” VP Application
Development
Confidential – Do Not Distribute
32. Model Development for Vehicle Data Analysis
32
Profile: The Analytics R&D team of the multinational
automobile manufacturer worked with Revolution Analytics
Consultants to perform Survival Analysis, and to build and
deploy Decision Trees and Time Series models
Key Technology and Services: Revolution R Enterprise
for Big Data Analytics, Consulting, Training
Analytic Approach – Warranty Data Analysis:
Estimating the life of an automobile component using
Survival Analysis with Cox proportional hazards. Models
are trained using historical data, consisting of warranty
claims, and region and weather related variables such
snow, rain, temperature etc.
Outcome: New analytics paradigm for existing
processes introduced, with potential for millions of dollars
in cost savings through improved warranty contracts, and
re-designed automobile components.
>Warranty & Sensor Data Analysis
>R/Revolution R Enterprise Training
Analytic Approach – Sensor Data Analysis: Use sensor
data from vehicle components to build Decision Trees for
classification, and to establish range of predicted values for
sensor readings so that actual readings can be analyzed for
outliers.
Bottom line: New analytics initiative for building an
intelligent automobile system that’s capable of guiding the
driver upon detection of anomalies in driving patterns.
“The consultants and training instructors from
Revolution Analytics were very knowledgeable and
supported me very well. I am looking forward to taking
my learnings to the larger analytics team at my
company.” Senior Researcher, Analytics R&D
Confidential – Do Not Distribute
33. R Package Validation
33
Profile: The Clinical Trials Analytics team at the
multinational biopharmaceutical company moved from
SAS to R to develop big data analytics for Clinical Trials
Key Technology and Services: RUnit testing framework,
Revolution R Enterprise (RRE) and open source R
Approach: Validate third party (user-contributed) R
packages from CRAN by executing unit and regression
tests for functions both in the stated base package and its
dependent packages.
Outcome: Client moving from SAS to RRE for new
analytics initiatives for improved performance and cost
savings, and requires validation for user contributed
packages for reliability and compliance.
Challenge: The Clinical Trials Analytics team had “big data”
and “big computation” challenges, and needed a
centralized, scalable, and high-performance platform to
concurrently run the analytic models for faster analysis.
Bottom Line: Revolution R Enterprise acts as their
statistical analytics platform providing a centralized and
scalable platform for 10’s of data scientists and analysts.
Confidential – Do Not Distribute
User-contributed, Open Source R package
validation for Clinical Trial compliance to
support move from SAS to R & RRE
34. Model Optimization for Customer Analytics
34
Profile: The advanced analytics & IT Infrastructure teams at the
Las Vegas-based gaming corporation build and deploy
analytical models for internal customers such as Marketing &
Sales.
Key Technology and Services: Hadoop, Open Source R,
Consulting and Training
Analytic Approach: Assess the end-to-end flow of the
current Guest scoring model, and re-write the existing rmr/
R code using optimization techniques.
Outcome: 84% reduction in run time of the Guest Scoring
model, which helps the gaming company target their
customers with a customized marketing campaign within
minutes of performing a new activity such as checking into
the hotel, and buying tickets to a show.
Challenge: The IT Infrastructure team at the company was
challenged to support innovative, R-powered big data analytics
initiatives and needed to optimize their Analytics and Visualization
architecture.
Bottom line: Revolution Analytics consultants helped re-write R
analytics running inside Hadoop to achieve superior performance
and as a second project, designed a big data architecture
incorporating Cloudera, Teradata, Alteryx and Tableau
“Excellent work, Revolution!! We’re very glad that you came
on board to help us. Revolution Consultants get an A+.”
Technical Program Manager, Big Data Initiatives
Confidential – Do Not Distribute
> 84% improvement in performance &
reliability of Guest Scoring model
> Multi-layer big data infrastructure
architecture design
35. Revolution Analytics Services Overview
35
Training
• On-Site or
Remote Classes
• Classroom or
Self Paced
• Standard or
Tailored
Project Services
• Analytics
Strategy
• Analytics
Architecture
• Full Life Cycle
Projects
• Application
Migration
• Proof of concept
• Staff
Augmentation
• Package
Certification
Quick Start
Services
• Pre-production
• Jumpstart
value
• Combines
software,
training, and
services
Post Go-Live
Support
• Technical
Account
Management
• On-going
Training
37. 37
Why are so many companies using R?
Big Data
Data Science
Competition and Innovation
Open Source
Ecosystem
38. 38
Q&A / Resources
What is R?
revolutionanalytics.com/what-is-r
Companies using R
revolutionanalytics.com/companies-using-r
AcademyR training
revolutionanalytics.com/AcademyR
AcademyR Certification
revolutionanalytics.com/AcademyR-certification
Contact Revolution Analytics
revolutionanalytics.com/contact-us
39. Thank you
Join us August 7th at 10:00 AM, Pacific, for our
Moving from SAS to R webinar. Please visit
our website to register.
www.revolutionanalytics.com, 1.855.GET.REVO, Twitter: @RevolutionR
39