Downloaded 468 times

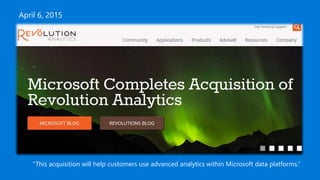

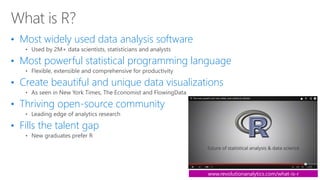
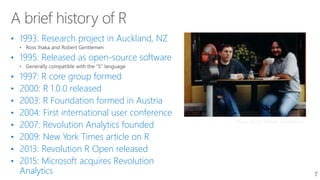
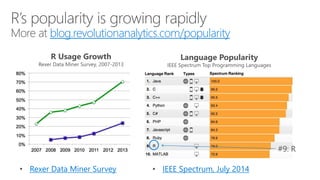
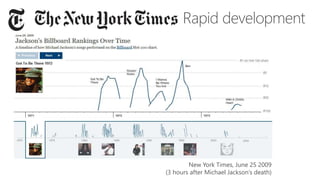


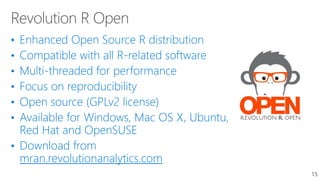


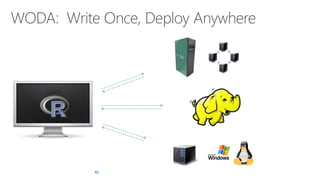
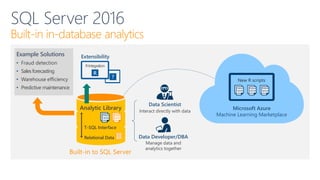
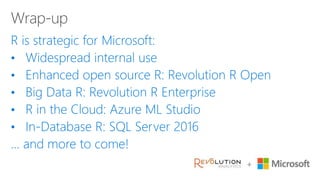

This document summarizes R at Microsoft, including its acquisition of Revolution Analytics. Key points include: - R is a widely used open-source statistical programming language. Microsoft acquired Revolution Analytics to help customers use advanced analytics within its data platforms. - Microsoft products like SQL Server will integrate Revolution R Open, an enhanced open-source R distribution, to allow running R scripts directly from SQL queries. - Microsoft aims to make R and advanced analytics more accessible and scalable through products like the Machine Learning marketplace and by running R on servers to handle large datasets within SQL Server and Azure.