Downloaded 288 times
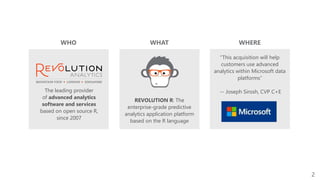
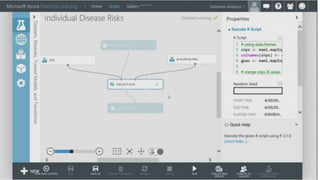
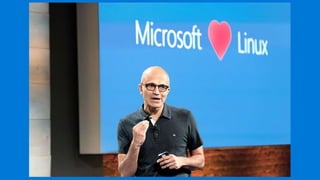


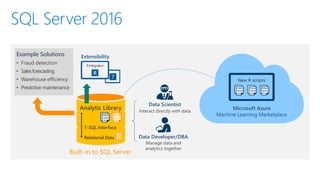

The document discusses Revolution Analytics, a company that provides analytics software and services based on the open source R language. It was acquired by Microsoft to help customers use advanced analytics within Microsoft data platforms. The document provides overviews of R, data science in the cloud using Azure, connecting R to SQL, solving scalability issues with Revolution R Enterprise (RRE), using R in SQL Server, and moving analytics workflows to the cloud.