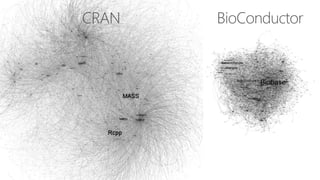
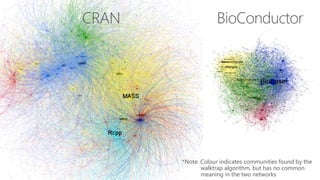
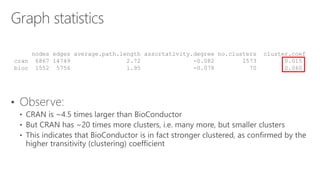
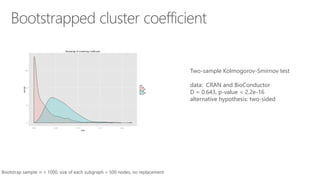
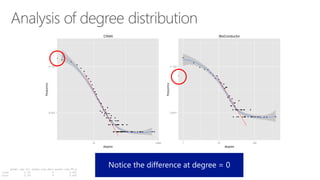
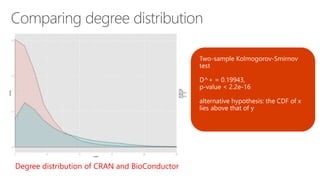
adevries@microsoft.com jrickert@microsoft.com
•
•
•
•
•
*Note: Colour indicates communities found by the
walktrap algorithm, but has no common
meaning in the two networks
nodes edges average.path.length assortativity.degree no.clusters cluster.coef
cran 6867 14749 2.72 -0.082 1573 0.015
bioc 1552 5756 1.95 -0.078 70 0.060
Bootstrap sample: n = 1000, size of each subgraph = 500 nodes, no replacement
Two-sample Kolmogorov-Smirnov test
data: CRAN and BioConductor
D = 0.643, p-value < 2.2e-16
alternative hypothesis: two-sided
power.law.fit power.law.xmin power.law.KS.p
cran 2.55 5 0.061
bioc 2.59 9 0.632
Degree distribution of CRAN and BioConductor
Typical small sample n =100 P-value distribution
Formula: bioc_net ~ edges + degree(c(1, 2))
The Network structure of R packages on CRAN & BioConductor

The Network structure of R packages on CRAN & BioConductor

Editor's Notes

  • #9 MASS Matrix lattice mgcv Hmisc cluster car xtable fields lme4 abind e1071 gplots robustbase quadprog nnet plotrix randomForest rpart quantreg mvtnorm boot numDeriv corpcor multcomp VGAM optimx Rsolnp BB expm SpatialVx sm truncnorm Crossover tmvtnorm drsmooth bbmle list BANFF QRM survival rms NSM3 coin prodlim survMisc plsRcox Biograph date pec mets riskRegression rsig lava sprinter missDeaths flexsurv etm LogicReg timereg
  • #10 ggplot2 plyr stringr reshape2 RColorBrewer shiny data.table dplyr digest scales reshape DBI lubridate gridExtra scatterplot3d vmsbase qdap png RSQLite FactoMineR
  • #11 XML RCurl RJSONIO rjson RefManageR rNOMADS rdryad VideoComparison rbefdata rAltmetric pxR HierO rClinicalCodes rtematres psidR treebase rebird switchrGist rPlant pubmed.mineR httr jsonlite magrittr assertthat taxize spocc R6 V8 httpuv lazyeval yaml rbison gistr rgbif ecoengine curl rerddap bold ggvis RNeXML
  • #12 sp raster maptools rgdal foreign rgeos spdep maps PopGenReport plotKML gstat ecospat geosphere deldir biomod2 pedometrics spatsurv wux dynatopmodel marmap