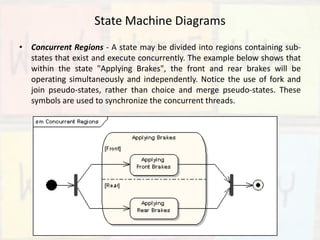
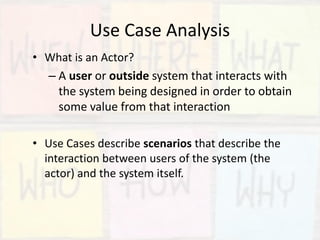
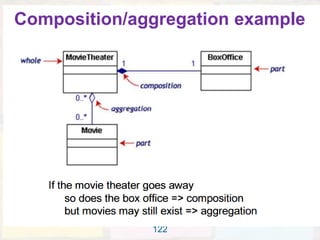
Receptionist
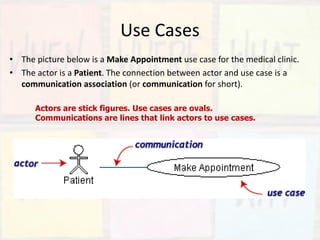
Patient: Patient
Doctor: Doctor
- The vertical solid line represents the life of an
object.
- It runs from top to bottom.
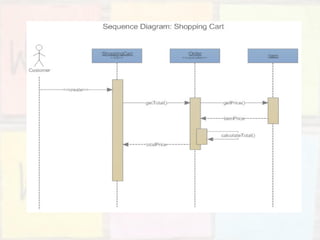
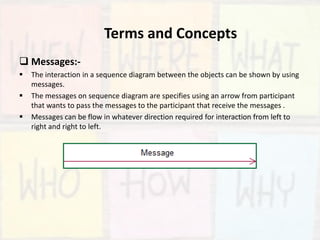
Messages:-
- The arrow represents the message passing
between objects.
- The arrow head points to the receiver.
- The message name is written near arrow.
- Synchronous and asynchronous message
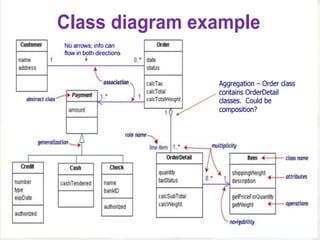
Receptionist
Patient
Doctor
makeAppointment()
checkAvailability()
scheduleAppointment()
confirmAppointment()
treatPatient()
billPatient()
- Sequence diagram shows the time sequence of
messages between objects.
- It emphasizes on


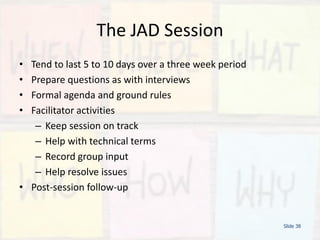


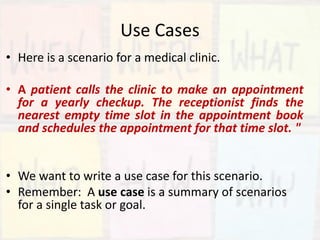


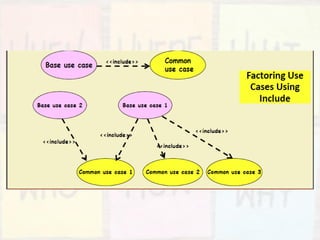


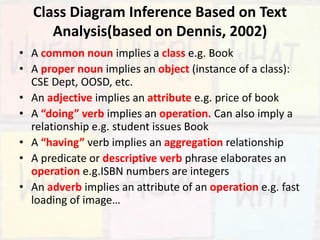


![Indicating selection and loops
• frame: box around part of a sequence diagram to indicate selection or loop
– if -> (opt) [condition]
– if/else -> (alt) [condition], separated by horizontal dashed line
– loop -> (loop) [condition or items to loop over]](https://image.slidesharecdn.com/requirmentanalysisandumlmodelling-190302095055/85/Requirement-analysis-and-UML-modelling-in-Software-engineering-128-320.jpg)