Downloaded 767 times

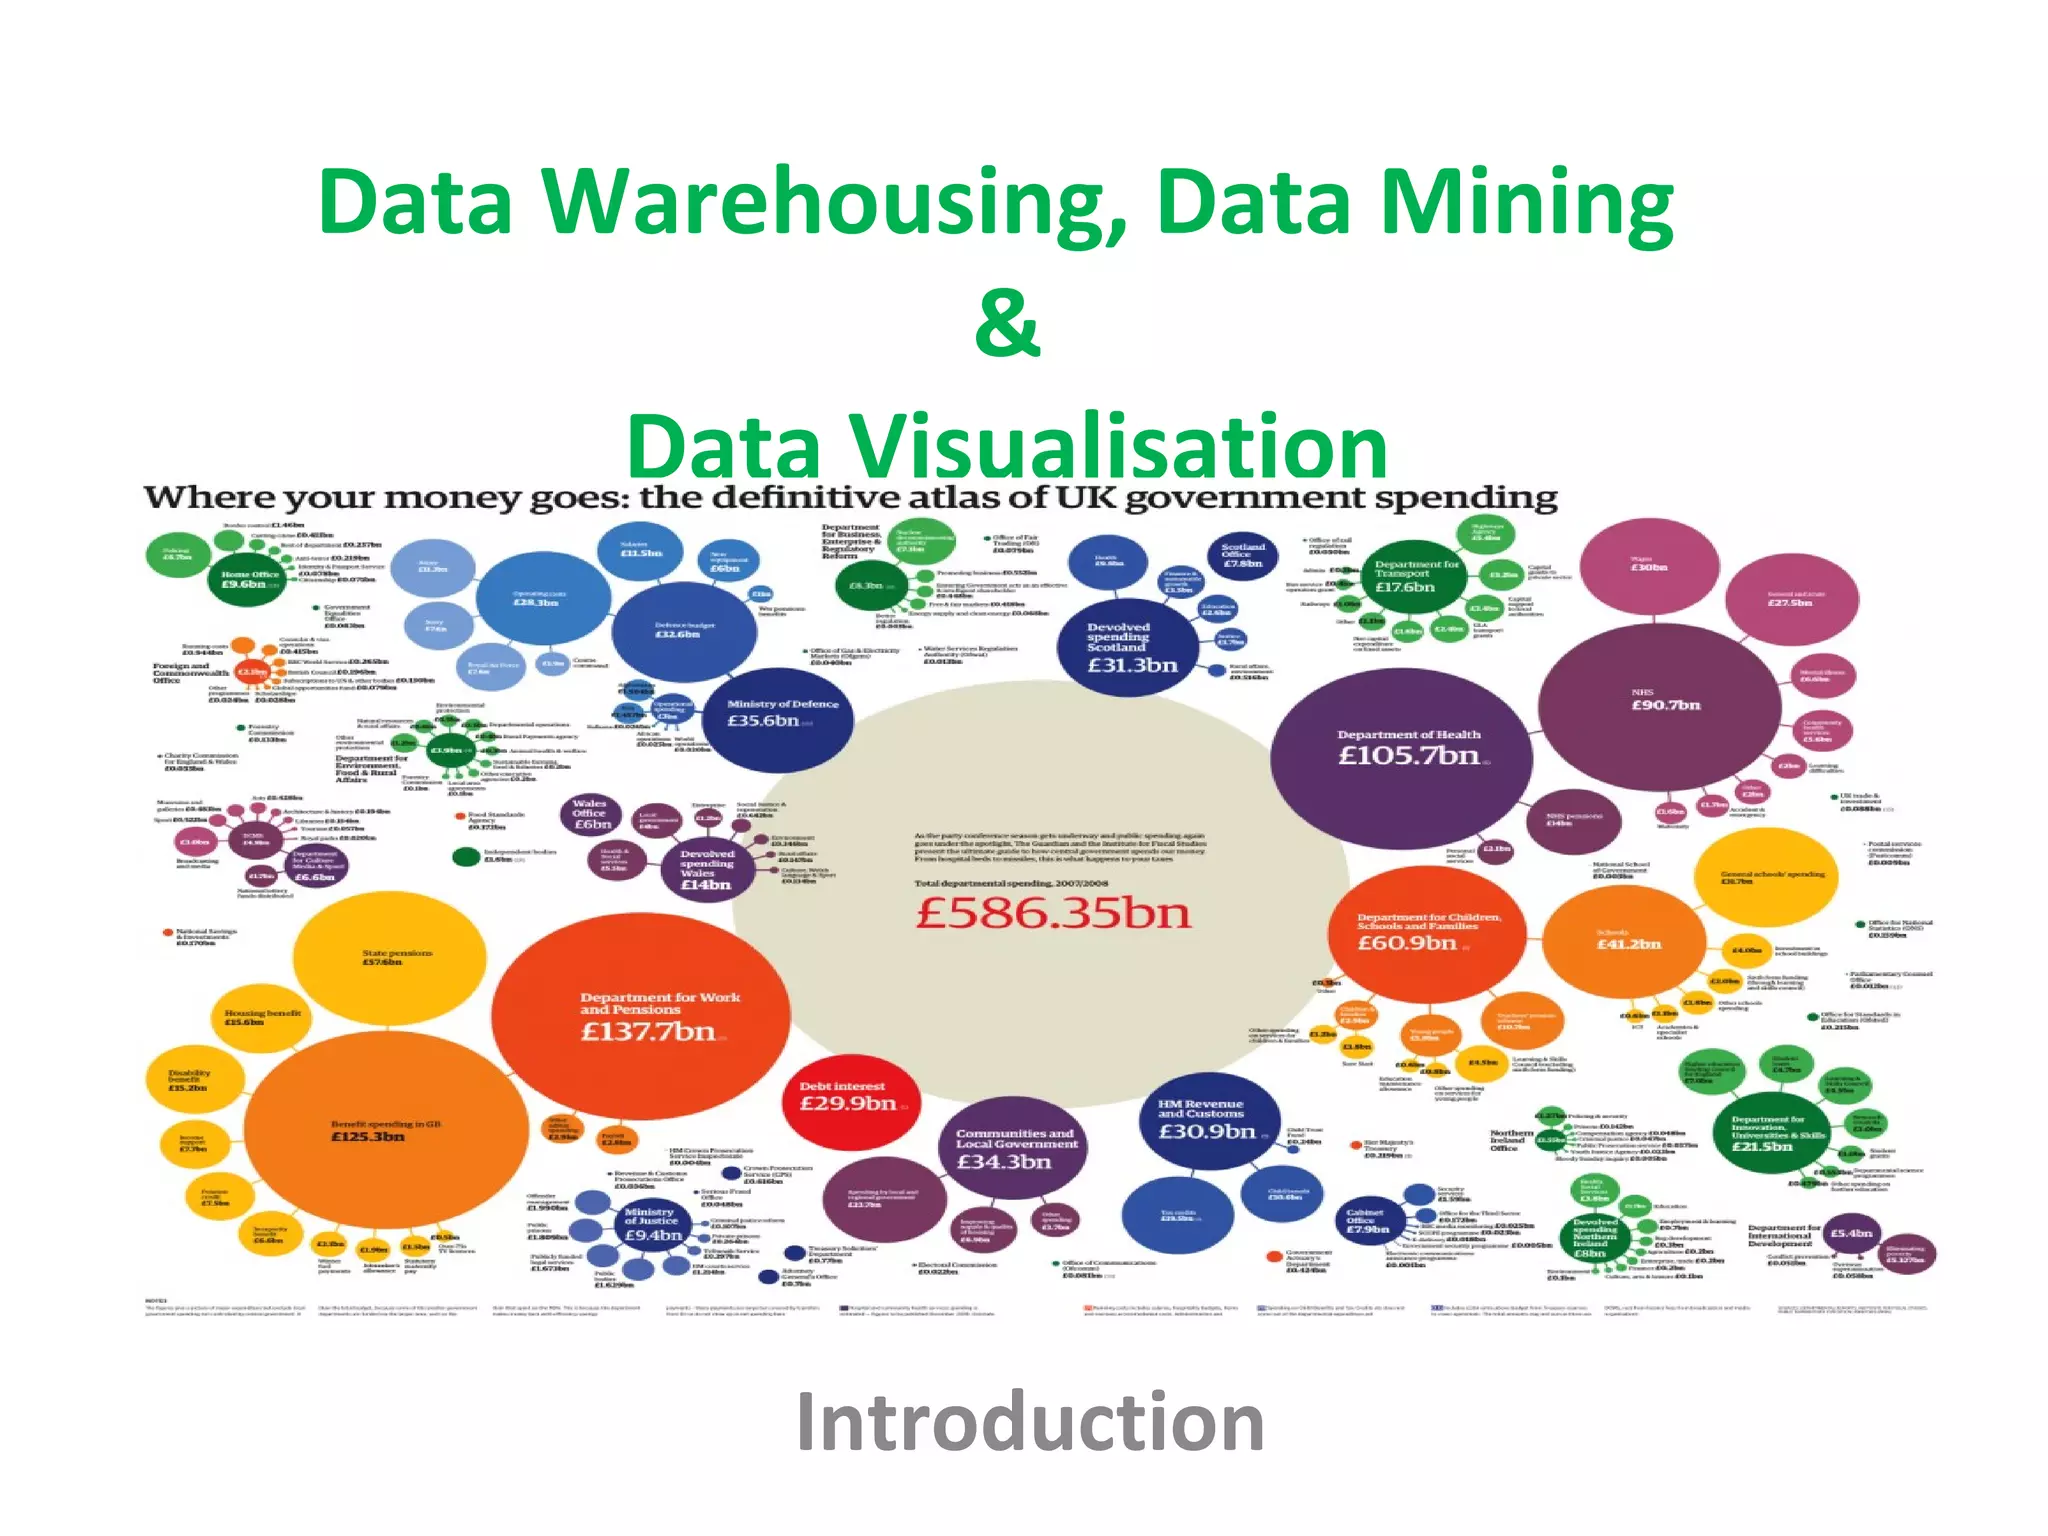

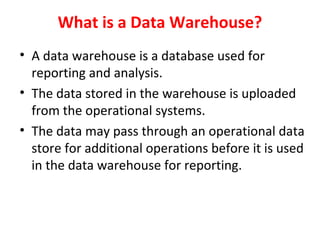
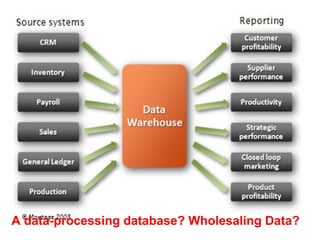
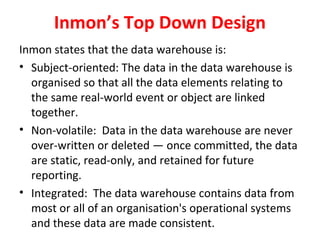
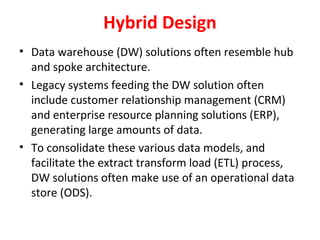

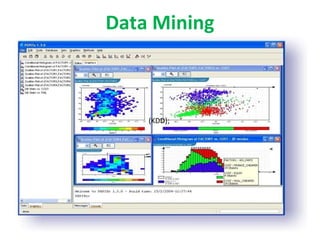


The document provides an introduction to data warehousing, data mining, and data visualization, detailing the purpose and benefits of data warehouses, historical developments, and contrasting modeling approaches by Ralph Kimball and Bill Inmon. It outlines the knowledge discovery in databases (KDD) process and its phases, as well as spatial data mining, emphasizing the importance of pattern discovery in large datasets. Additionally, it highlights the principles of effective data visualization and introduces tools like Gapminder for visual data analysis.