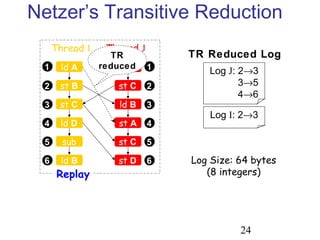
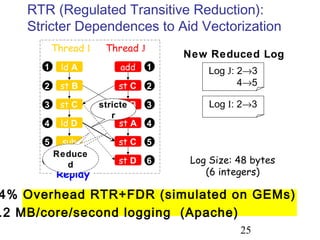
This document discusses techniques for deterministic replay of multithreaded programs. It describes how recording shared memory ordering information can enable replay that reproduces data races and concurrency bugs. Specifically, it outlines using a directory-based approach to track read-write dependencies between threads and reduce the log size through transitive reduction of dependencies.
![4
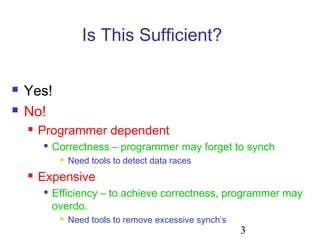
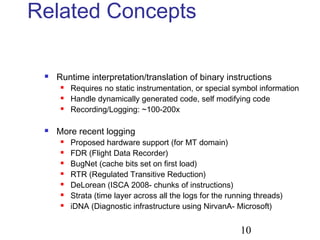
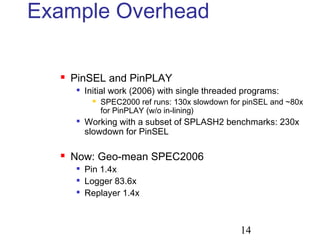
#define N 100
Type g_stack = new Type[N];
int g_counter = 0;
Lock g_lock;
void push( Type& obj ){lock(g_lock);...unlock(g_lock);}
void pop( Type& obj ) {lock(g_lock);...unlock(g_lock);}
void popAll( ) {
lock(g_lock);
delete[] g_stack;
g_stack = new Type[N];
g_counter = 0;
unlock(g_lock);
}
int find( Type& obj, int number ) {
lock(g_lock);
for (int i = 0; i < number; i++)
if (obj == g_stack[i]) break; // Found!!!
if (i == number) i = -1; // Not found… Return -1 to caller
unlock(g_lock);
return i;
}
int find( Type& obj ) {
return find( obj, g_counter );
}
Where is Waldo?](https://image.slidesharecdn.com/udx9cet5smqbpilfyyrp-signature-bdf22f977d1922516173cbf11ddb26b335c64cf06dea53a1afa3d04fa3890fc3-poli-160512174229/85/Data-race-4-320.jpg)
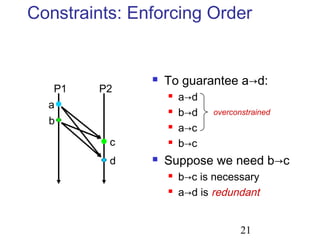
![5
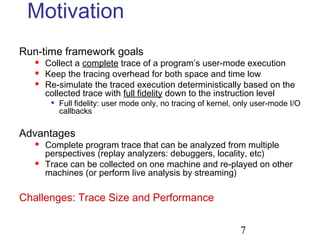
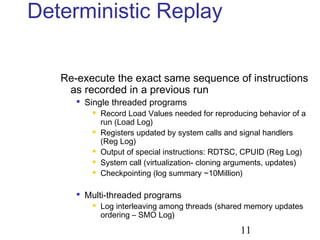
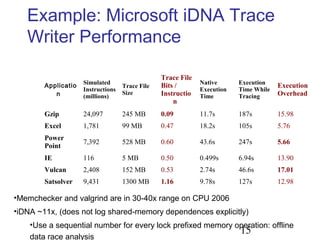
#define N 100
Type g_stack = new Type[N];
int g_counter = 0;
Lock g_lock;
void push( Type& obj ){lock(g_lock);...unlock(g_lock);}
void pop( Type& obj ) {lock(g_lock);...unlock(g_lock);}
void popAll( ) {
lock(g_lock);
delete[] g_stack;
g_stack = new Type[N];
g_counter = 0;
unlock(g_lock);
}
int find( Type& obj, int number ) {
lock(g_lock);
for (int i = 0; i < number; i++)
if (obj == g_stack[i]) break; // Found!!!
if (i == number) i = -1; // Not found… Return -1 to caller
unlock(g_lock);
return i;
}
int find( Type& obj ) {
return find( obj, g_counter );
}
Can You Find the Race?
Similar problem was found
in java.util.Vector
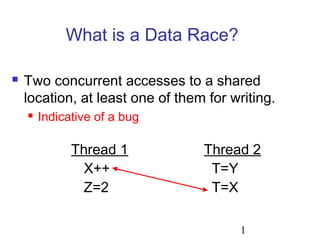
write
read](https://image.slidesharecdn.com/udx9cet5smqbpilfyyrp-signature-bdf22f977d1922516173cbf11ddb26b335c64cf06dea53a1afa3d04fa3890fc3-poli-160512174229/85/Data-race-5-320.jpg)
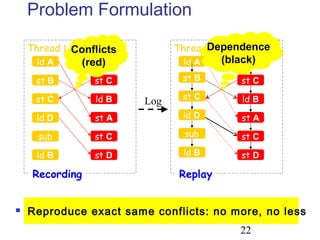
![6
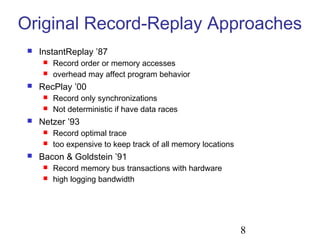
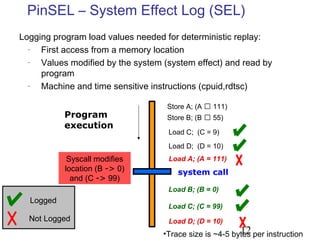
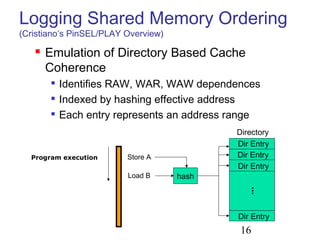
Detecting Data Races?
NP-hard [Netzer&Miller 1990]
Input size = # instructions performed
Even for 3 threads only
Even with no loops/recursion
Execution orders/scheduling (#threads)thread_length
# inputs
Detection-code’s side-effects
Weak memory, instruction reorder, atomicity](https://image.slidesharecdn.com/udx9cet5smqbpilfyyrp-signature-bdf22f977d1922516173cbf11ddb26b335c64cf06dea53a1afa3d04fa3890fc3-poli-160512174229/85/Data-race-6-320.jpg)
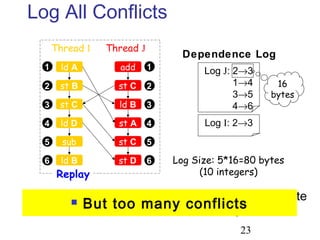
![17
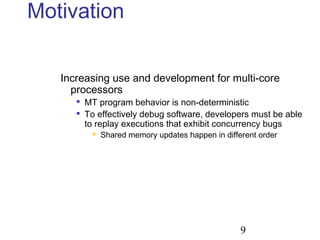
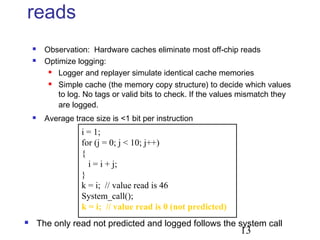
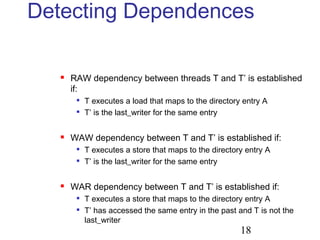
Directory Entries
Every DirEntry maintains:
Thread id of the last_writer
A timestamp is the # of memory ref. the thread has executed
Vector of timestamps of last access for each thread to that
entry
On Loads: update the timestamp for the thread in the entry
On Stores: update the timestamp and the last_writer fields
Programexecution
Thread T1 Thread T2
Last writer id:1: Store A
2: Load A
DirEntry: [A:D]
Last writer id:
DirEntry: [E:H]
Directory
T1: T2:
T1: T2:
1: Load F
2: Store A
3: Load F
3: Store F
T1
1
1
T2
22
3
T1
3
Vector](https://image.slidesharecdn.com/udx9cet5smqbpilfyyrp-signature-bdf22f977d1922516173cbf11ddb26b335c64cf06dea53a1afa3d04fa3890fc3-poli-160512174229/85/Data-race-17-320.jpg)
![19
ExampleProgramexecution
Thread T1 Thread T2
Last writer id:1: Store A
2: Load A
DirEntry: [A:D]
Last writer id:
DirEntry: [E:H]
T1: T2:
T1: T2:
1: Load F
2: Store A
3: Load F
3: Store F
T1
1
1
T2
22
3
T1
3
WAW
RAW
WAR
T1 2 T2 2
T1 3 T2 3
T2 2 T1 1
SMO logs:
Thread T1 cannot execute memory reference 2
until T2 executes its memory reference 2
Thread T2 cannot execute memory
reference 2 until T1 executes its
memory reference 1
Last access to the DirEntry
Last_writer
Last access to
the DirEntry](https://image.slidesharecdn.com/udx9cet5smqbpilfyyrp-signature-bdf22f977d1922516173cbf11ddb26b335c64cf06dea53a1afa3d04fa3890fc3-poli-160512174229/85/Data-race-19-320.jpg)


![[Paper reading] Interleaving with Coroutines: A Practical Approach for Robust...](https://cdn.slidesharecdn.com/ss_thumbnails/paperreadinginterleavingwithcoroutinesapracticalapproachforrobustindexjoin-211011055753-thumbnail.jpg?width=640&height=640&fit=bounds)