Download to read offline
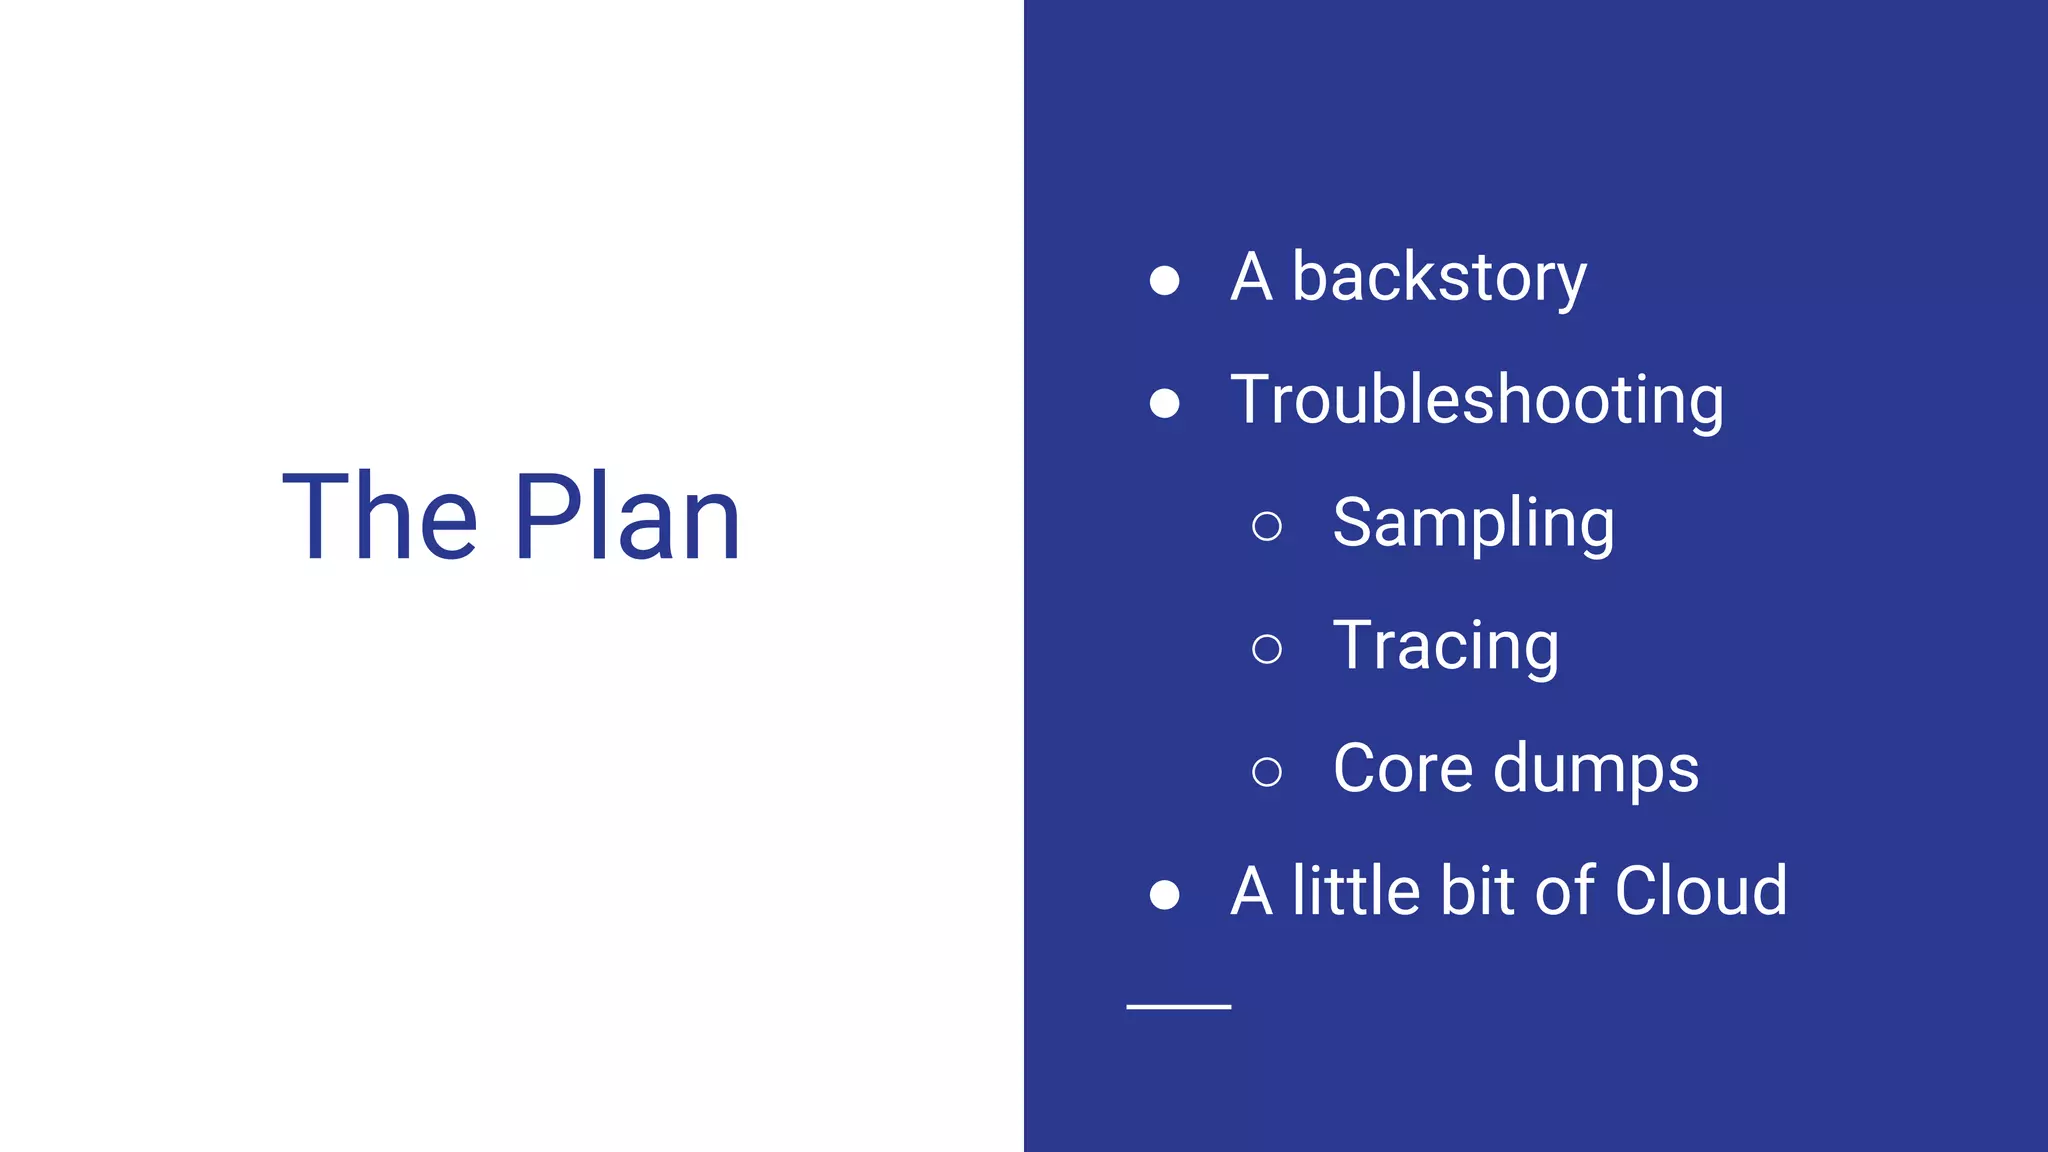
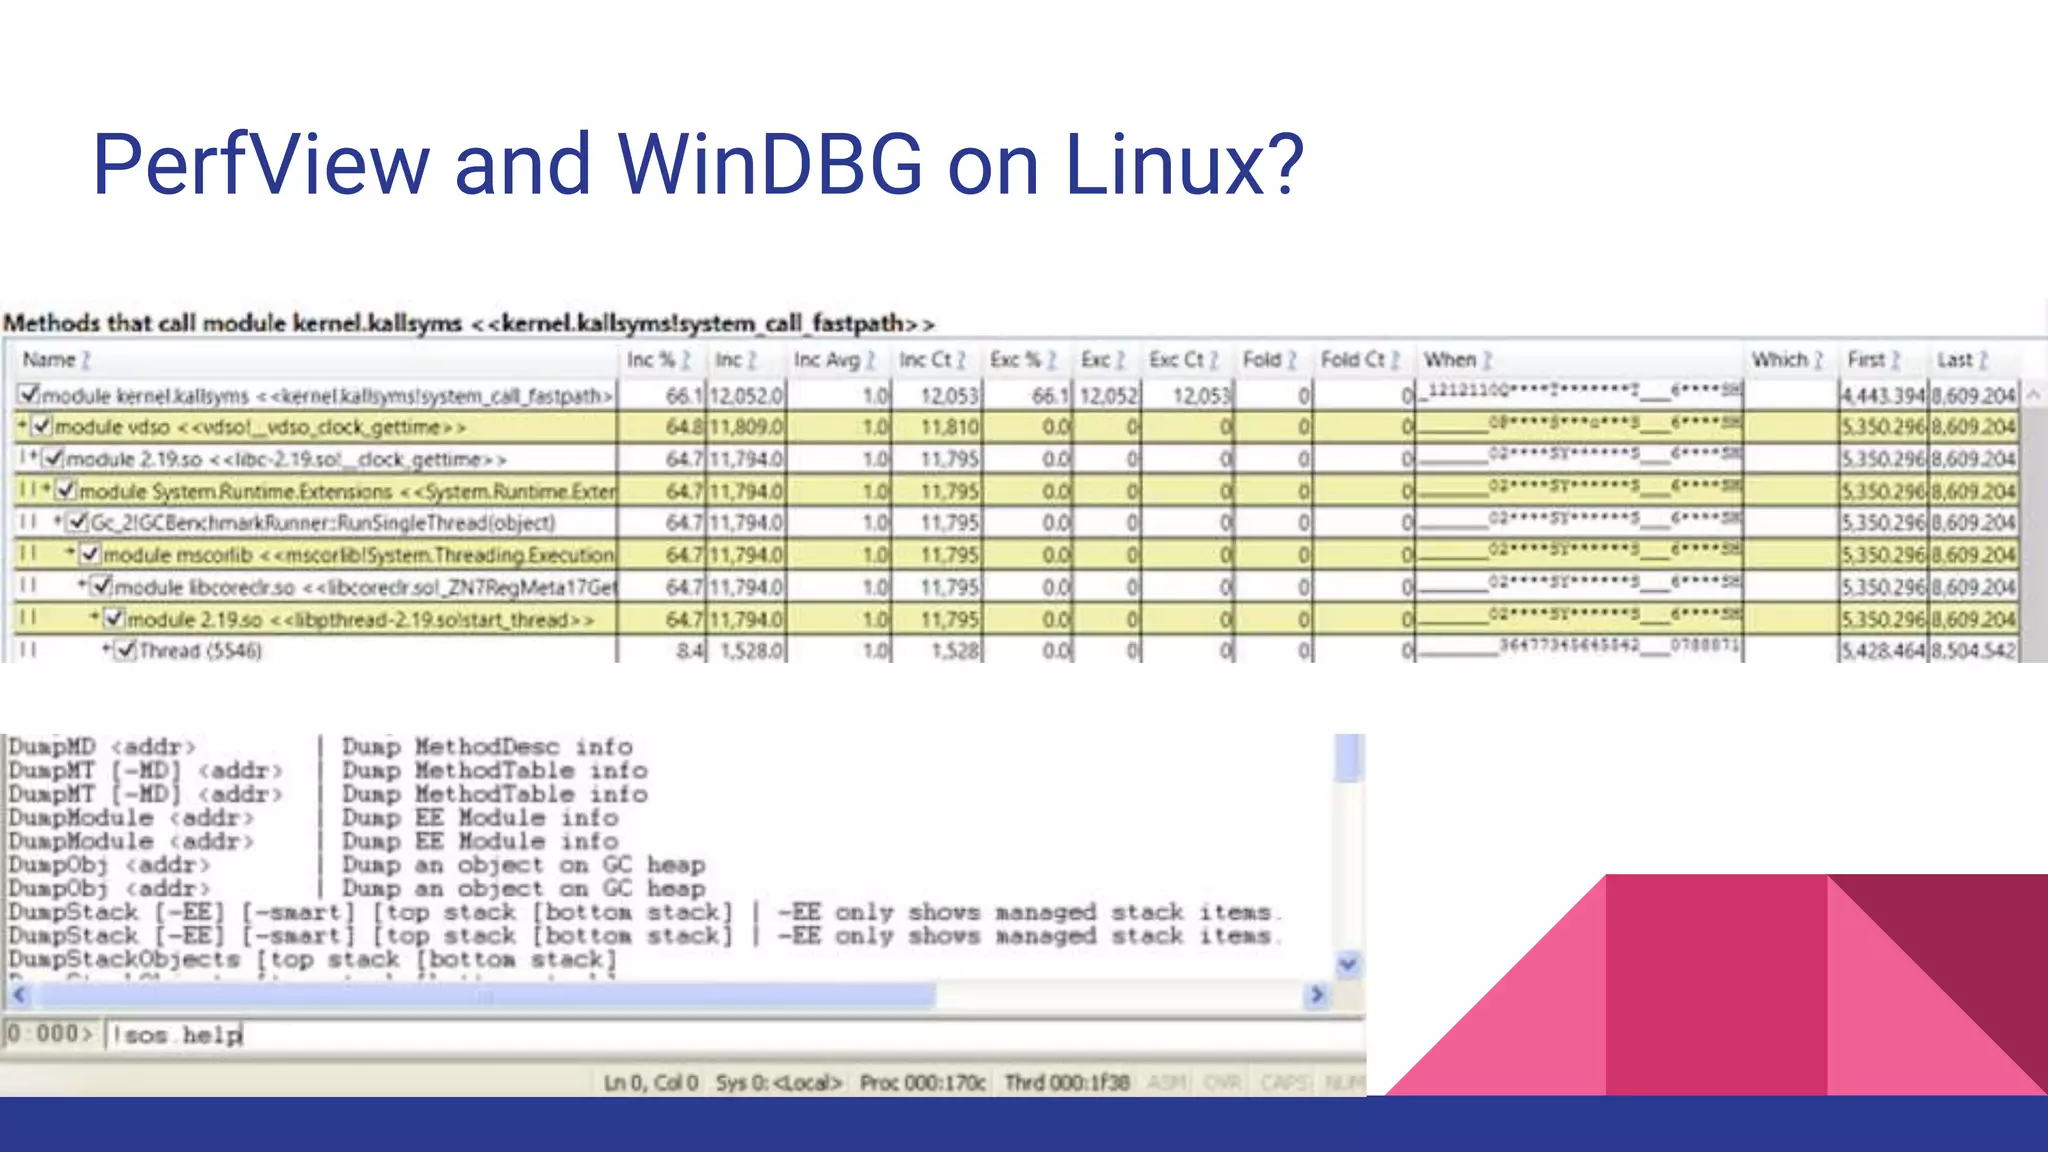
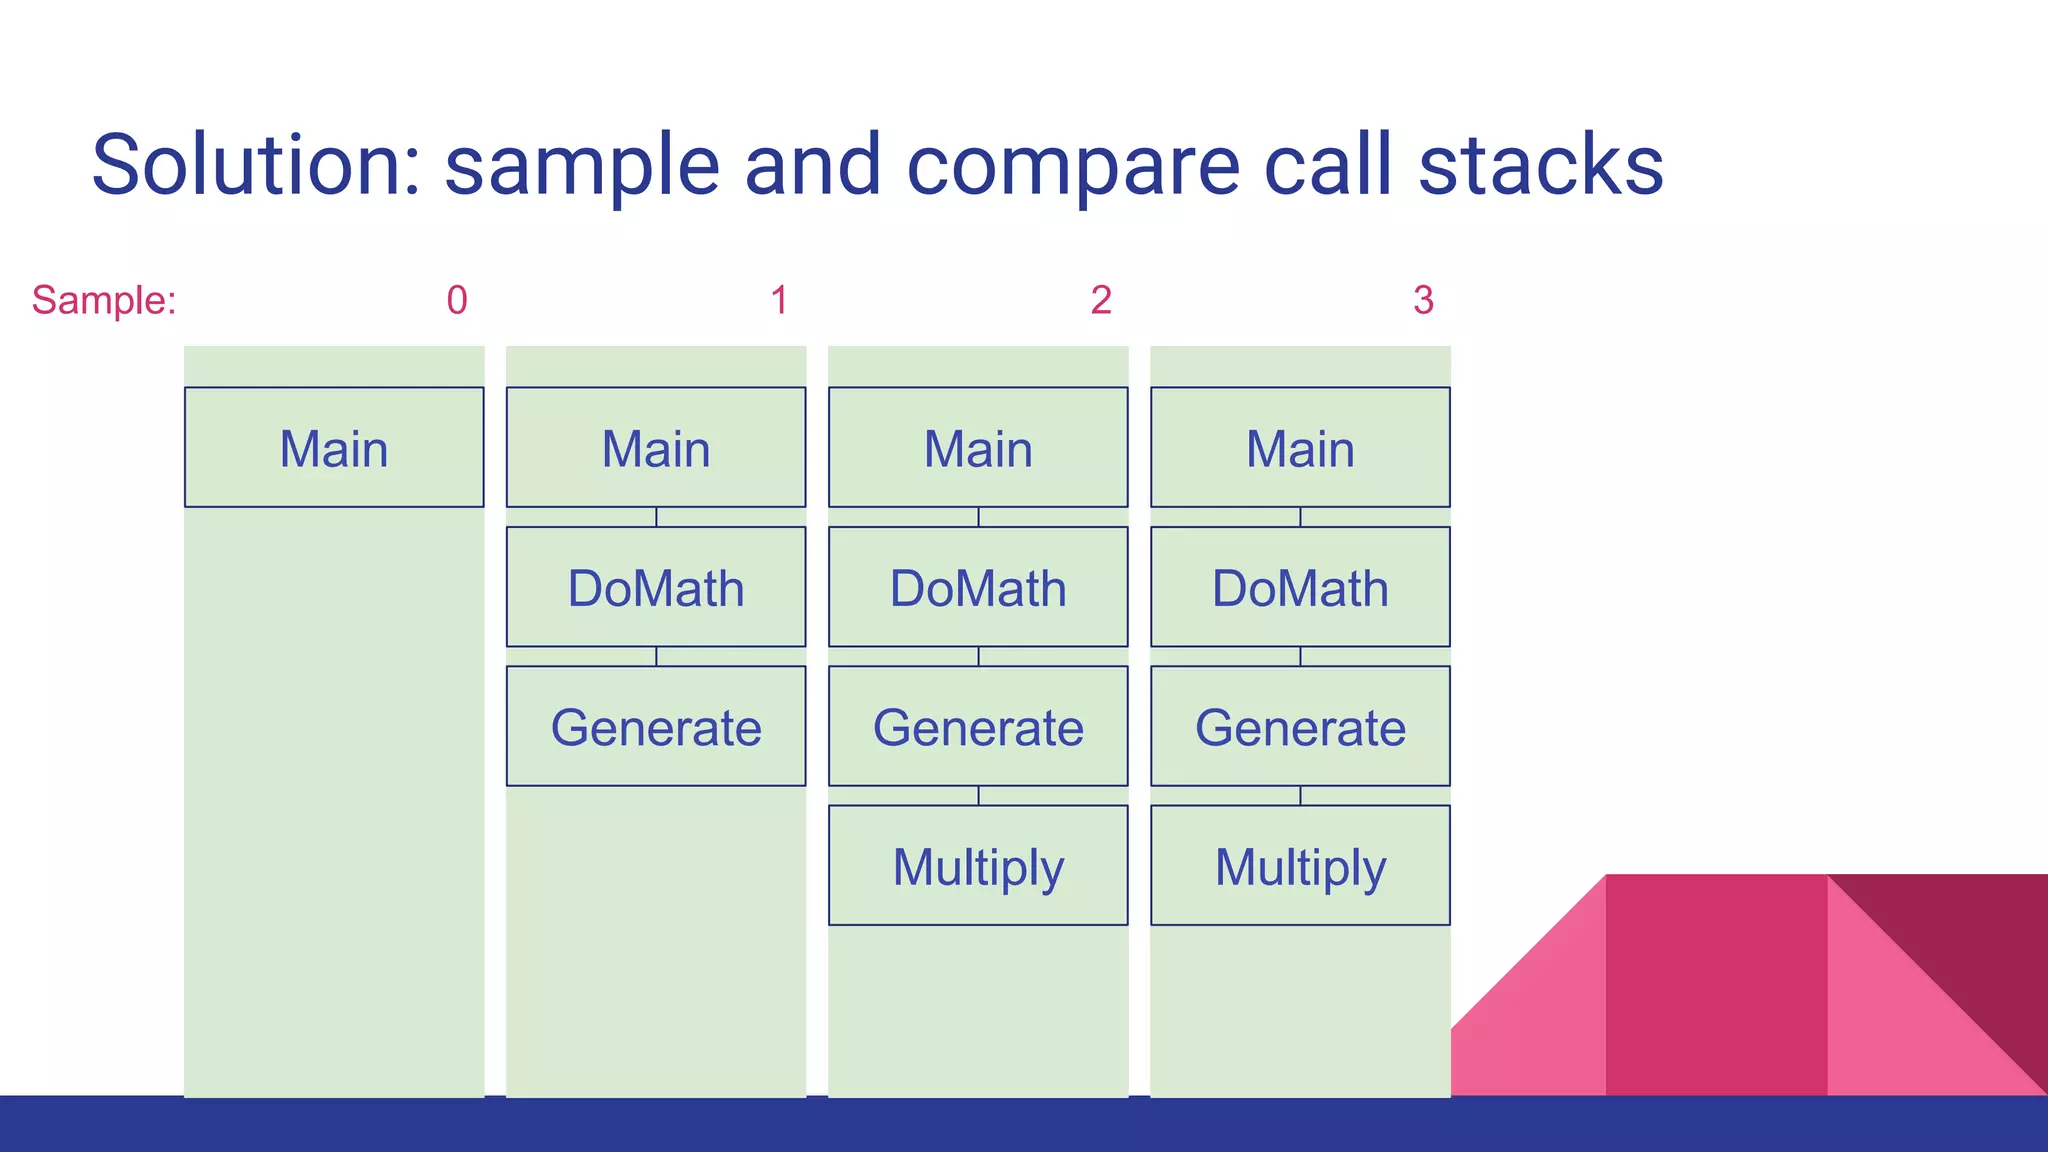
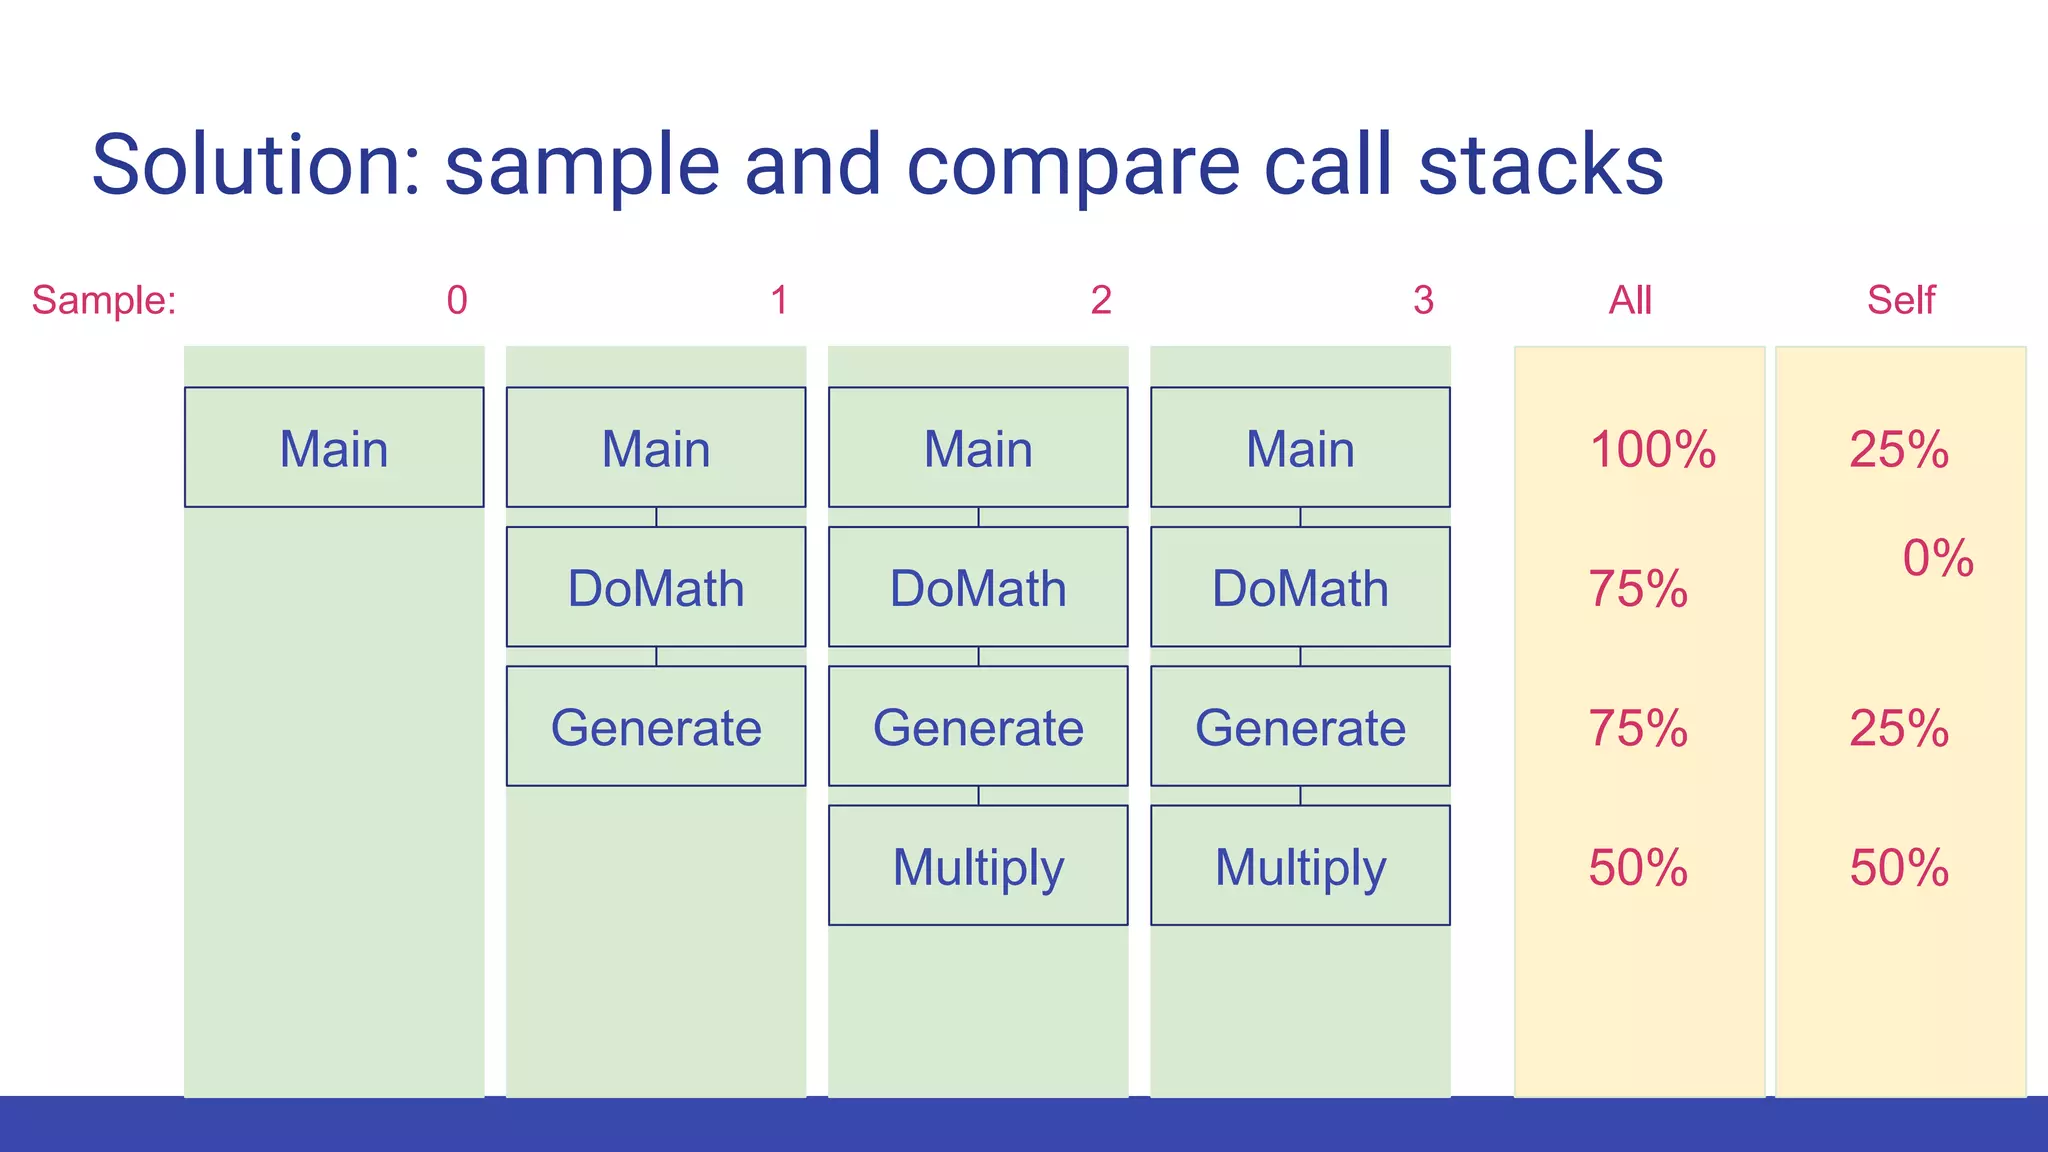
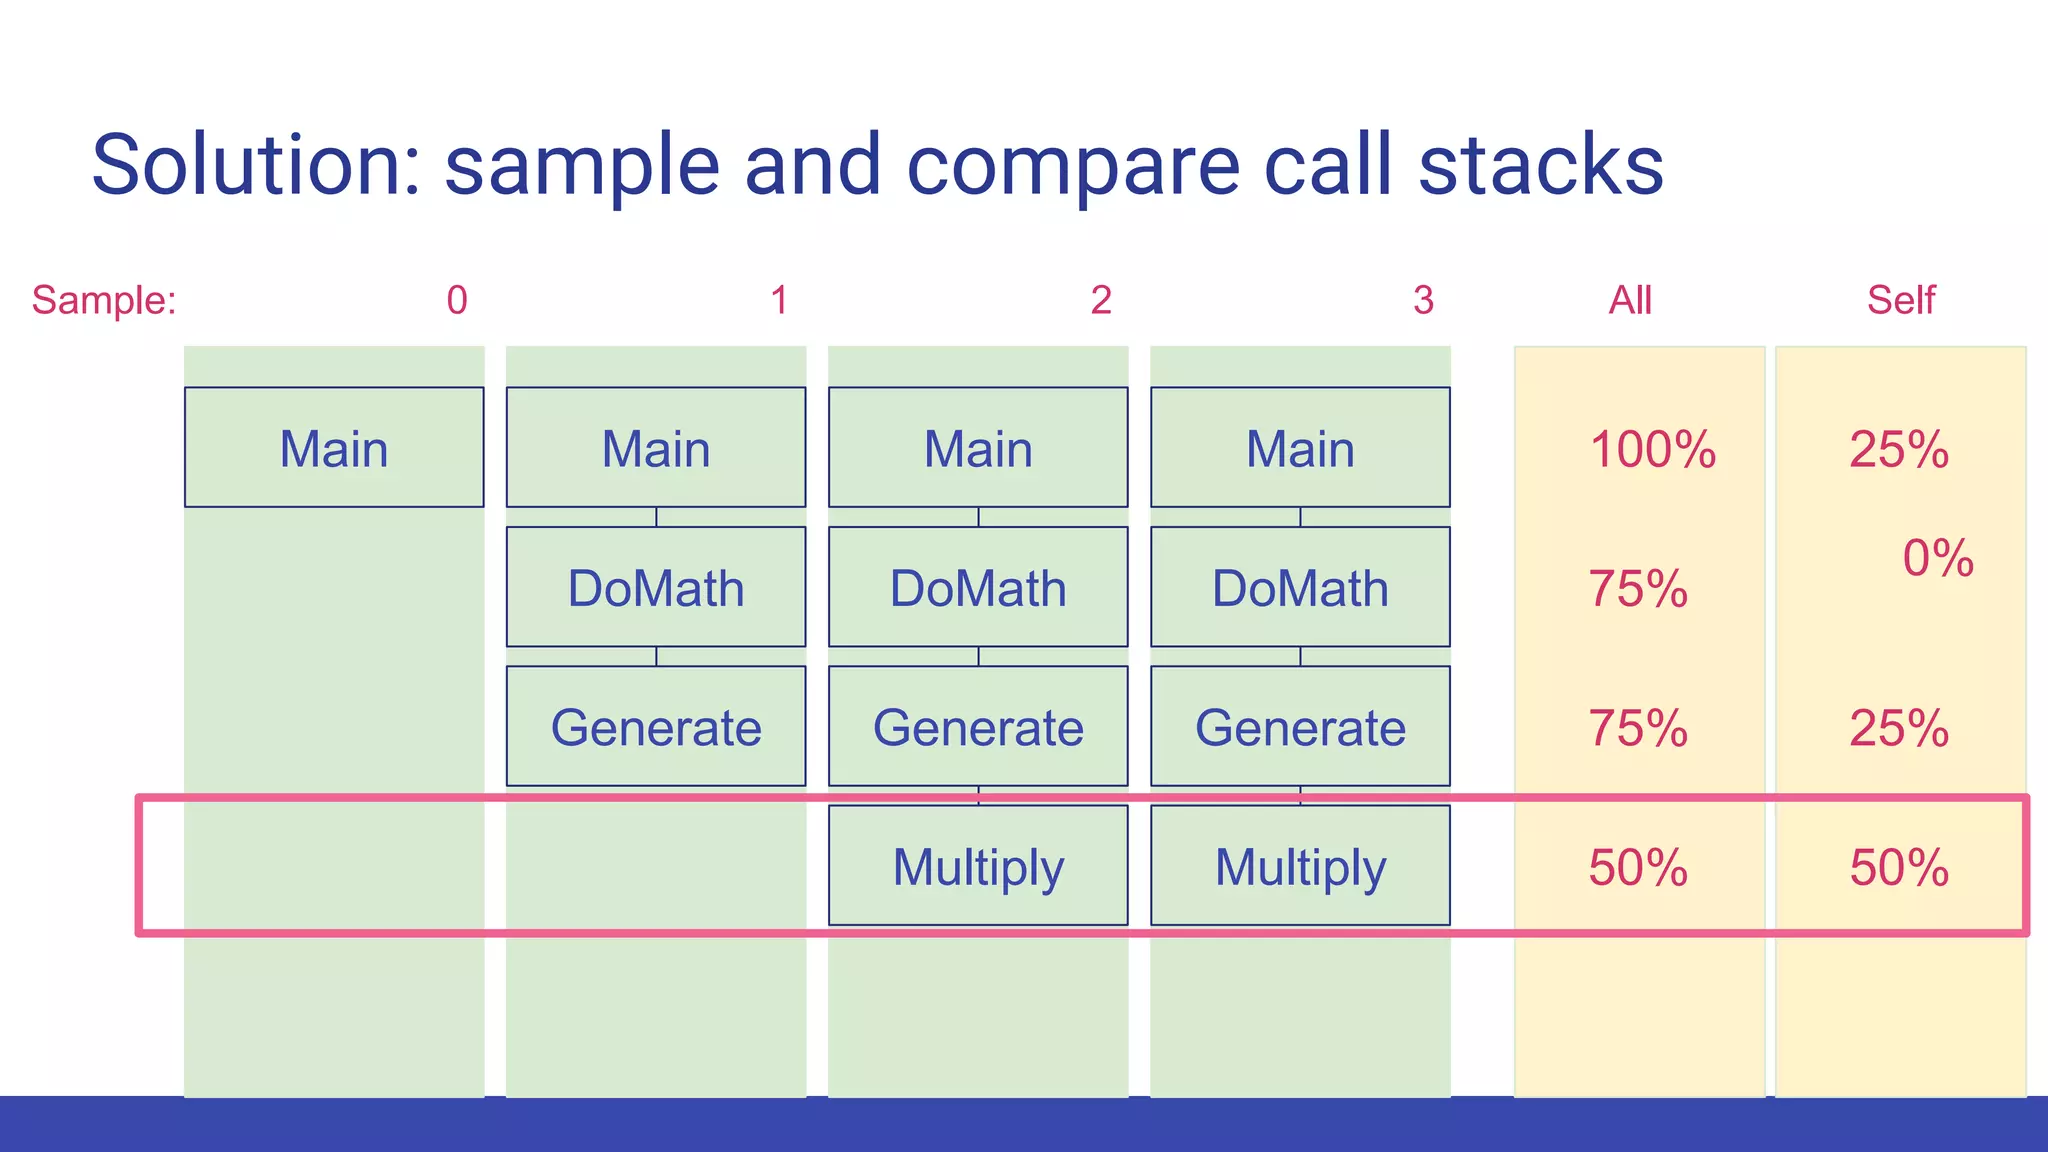
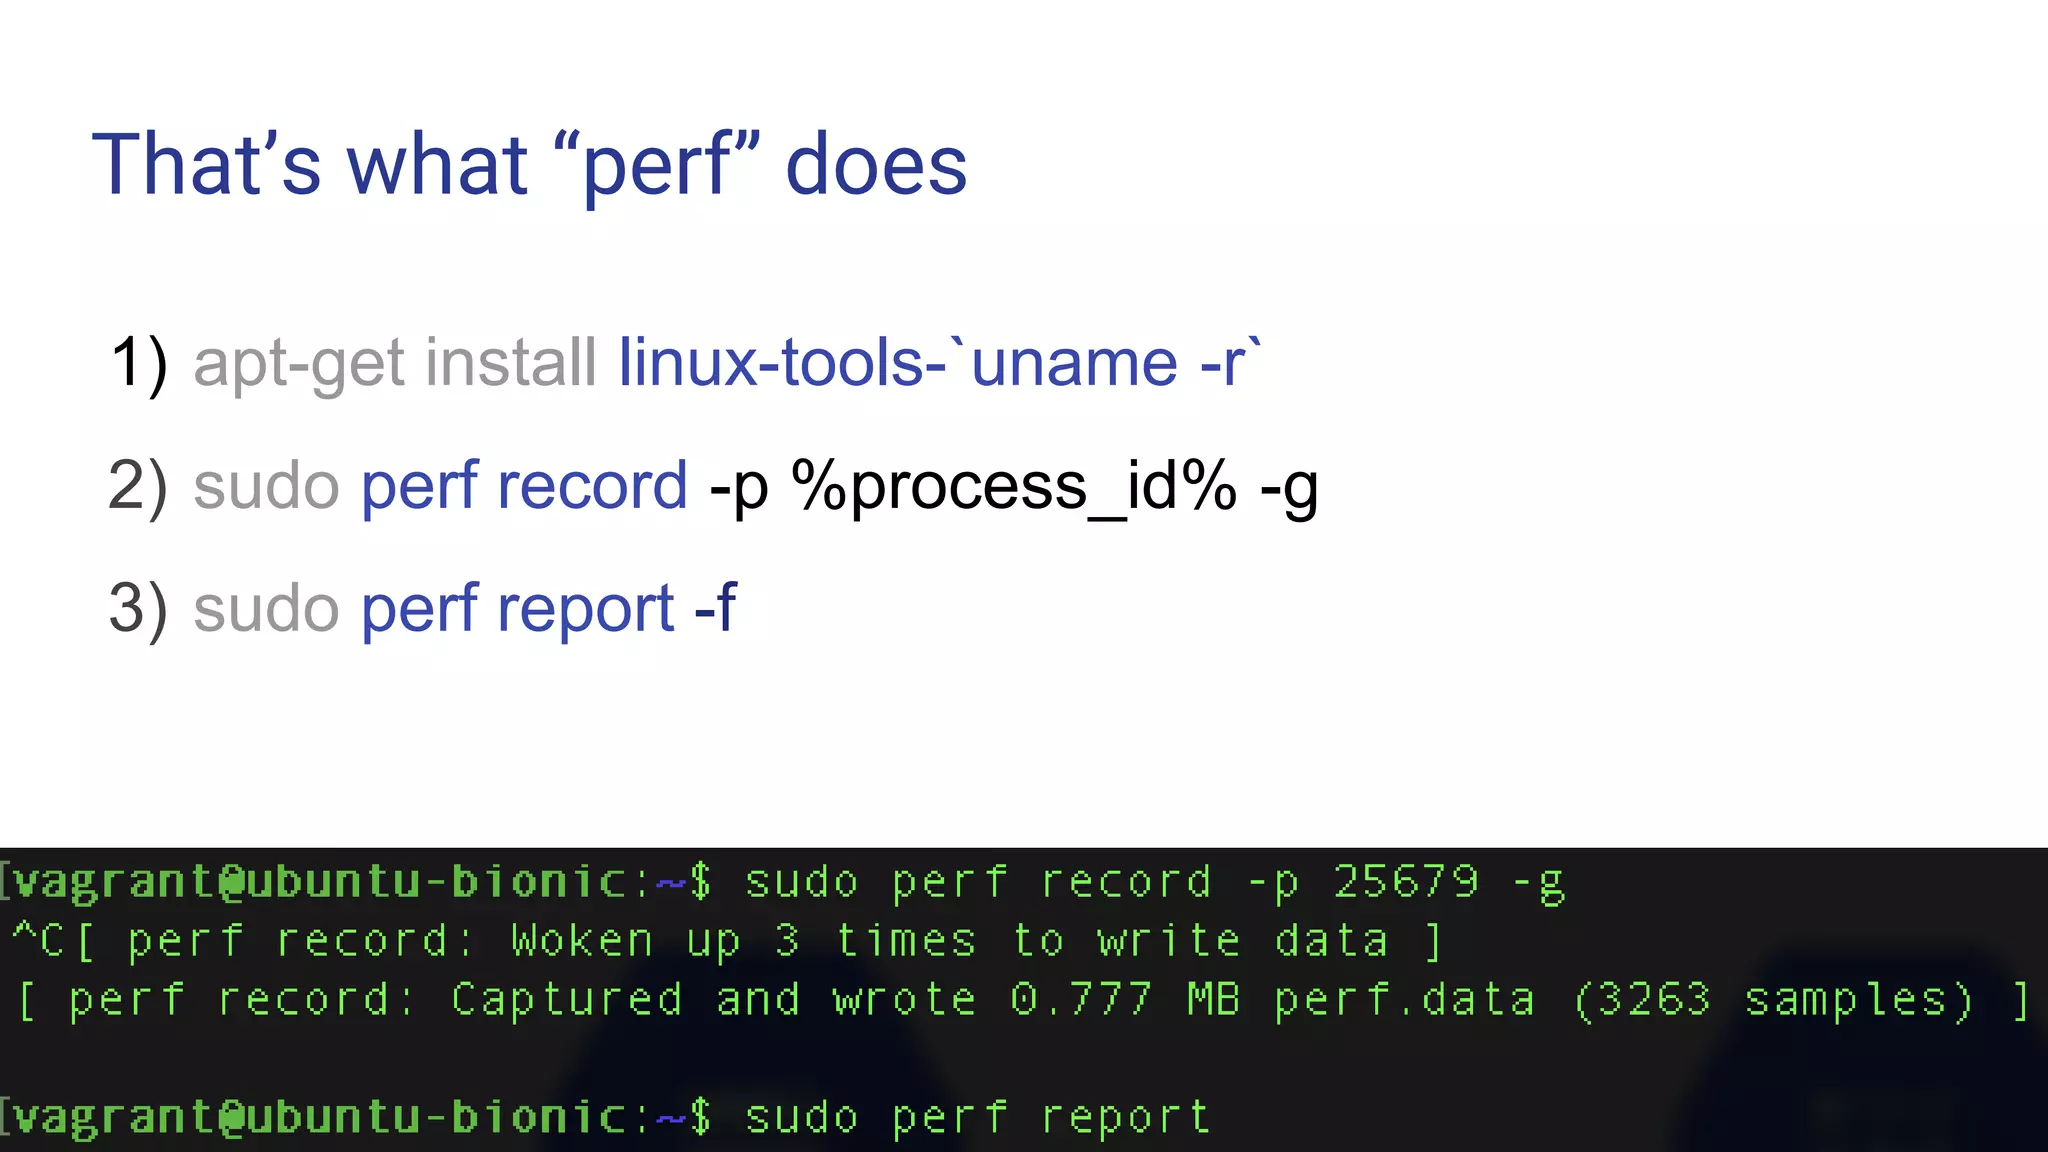
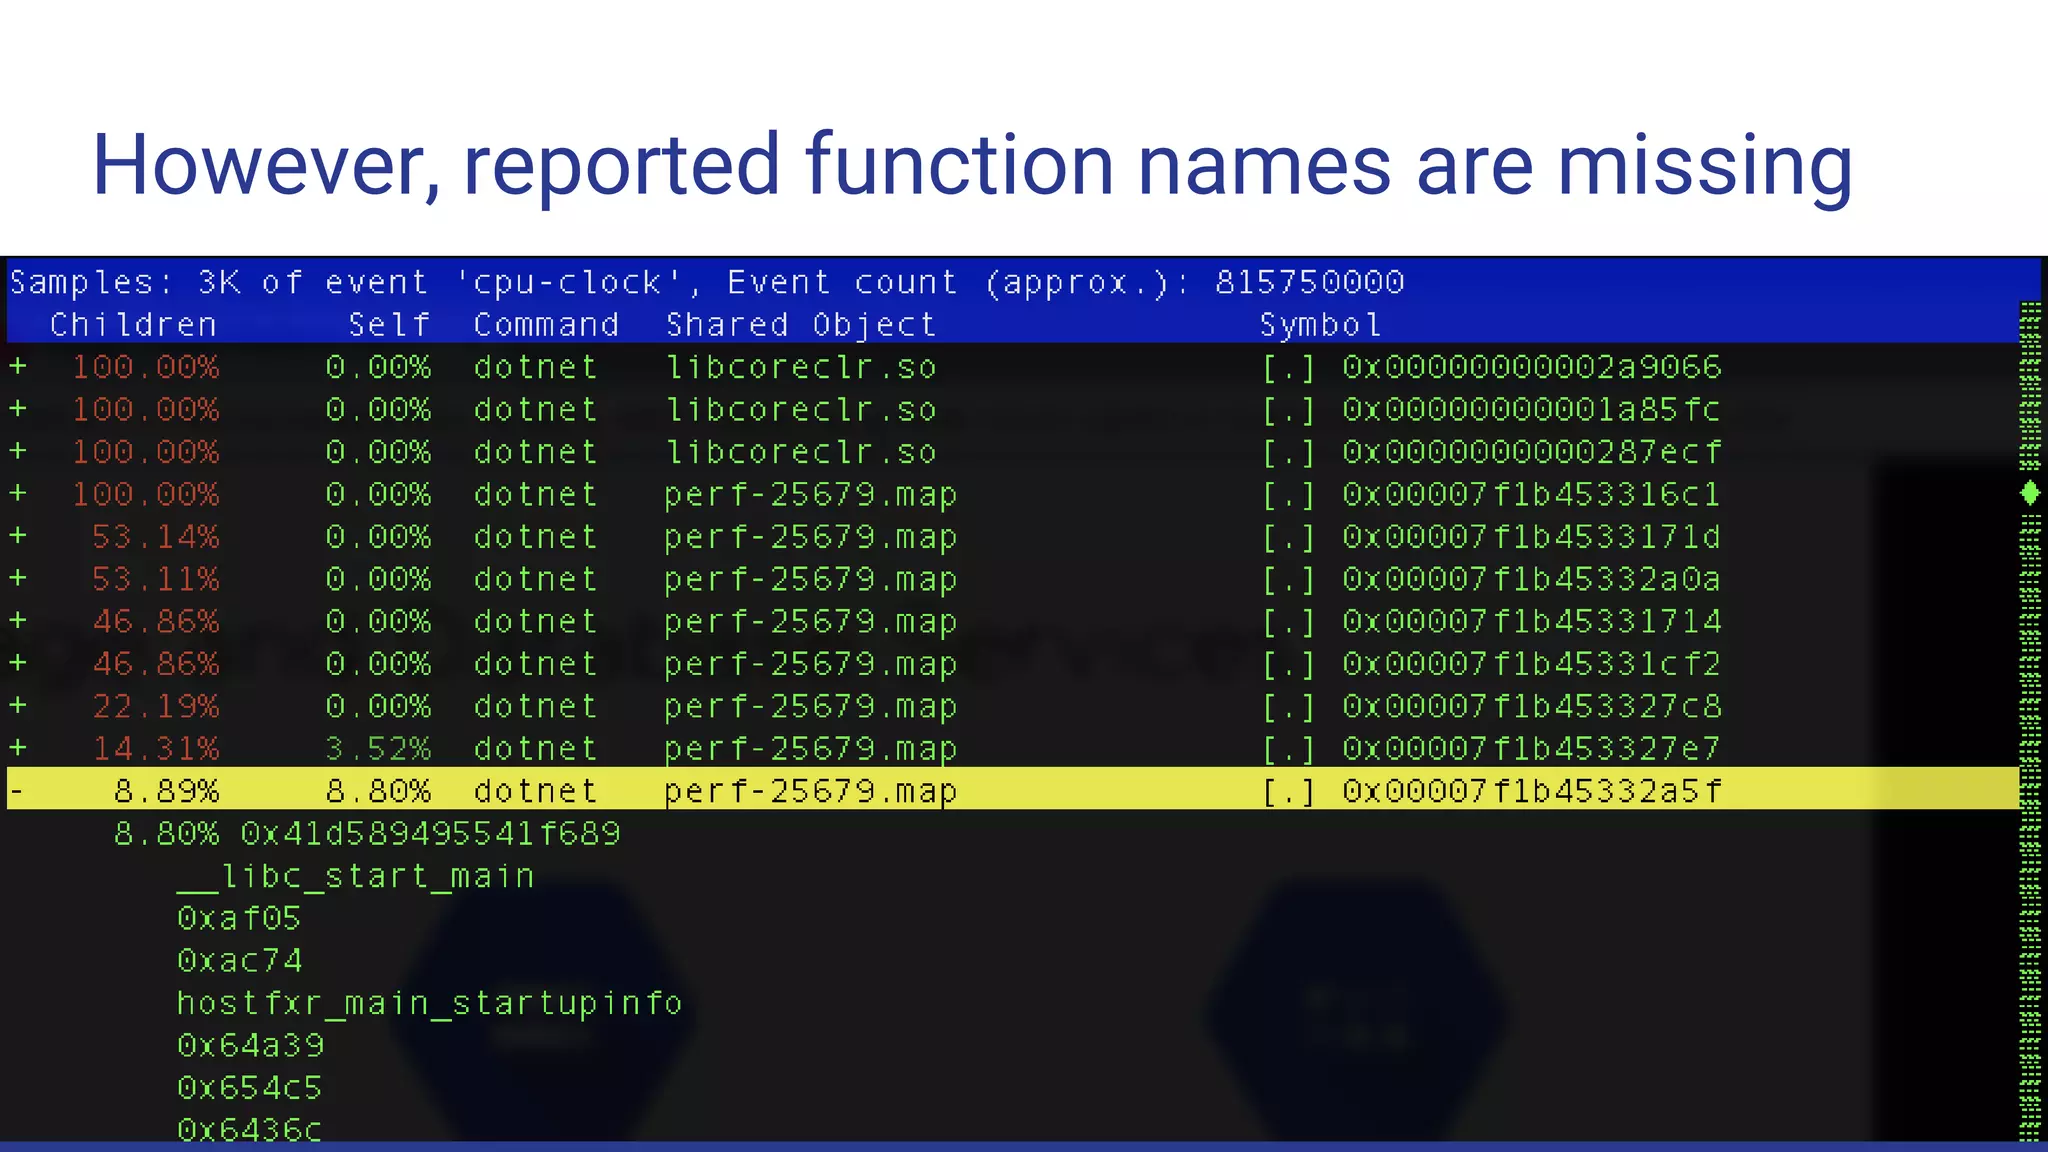
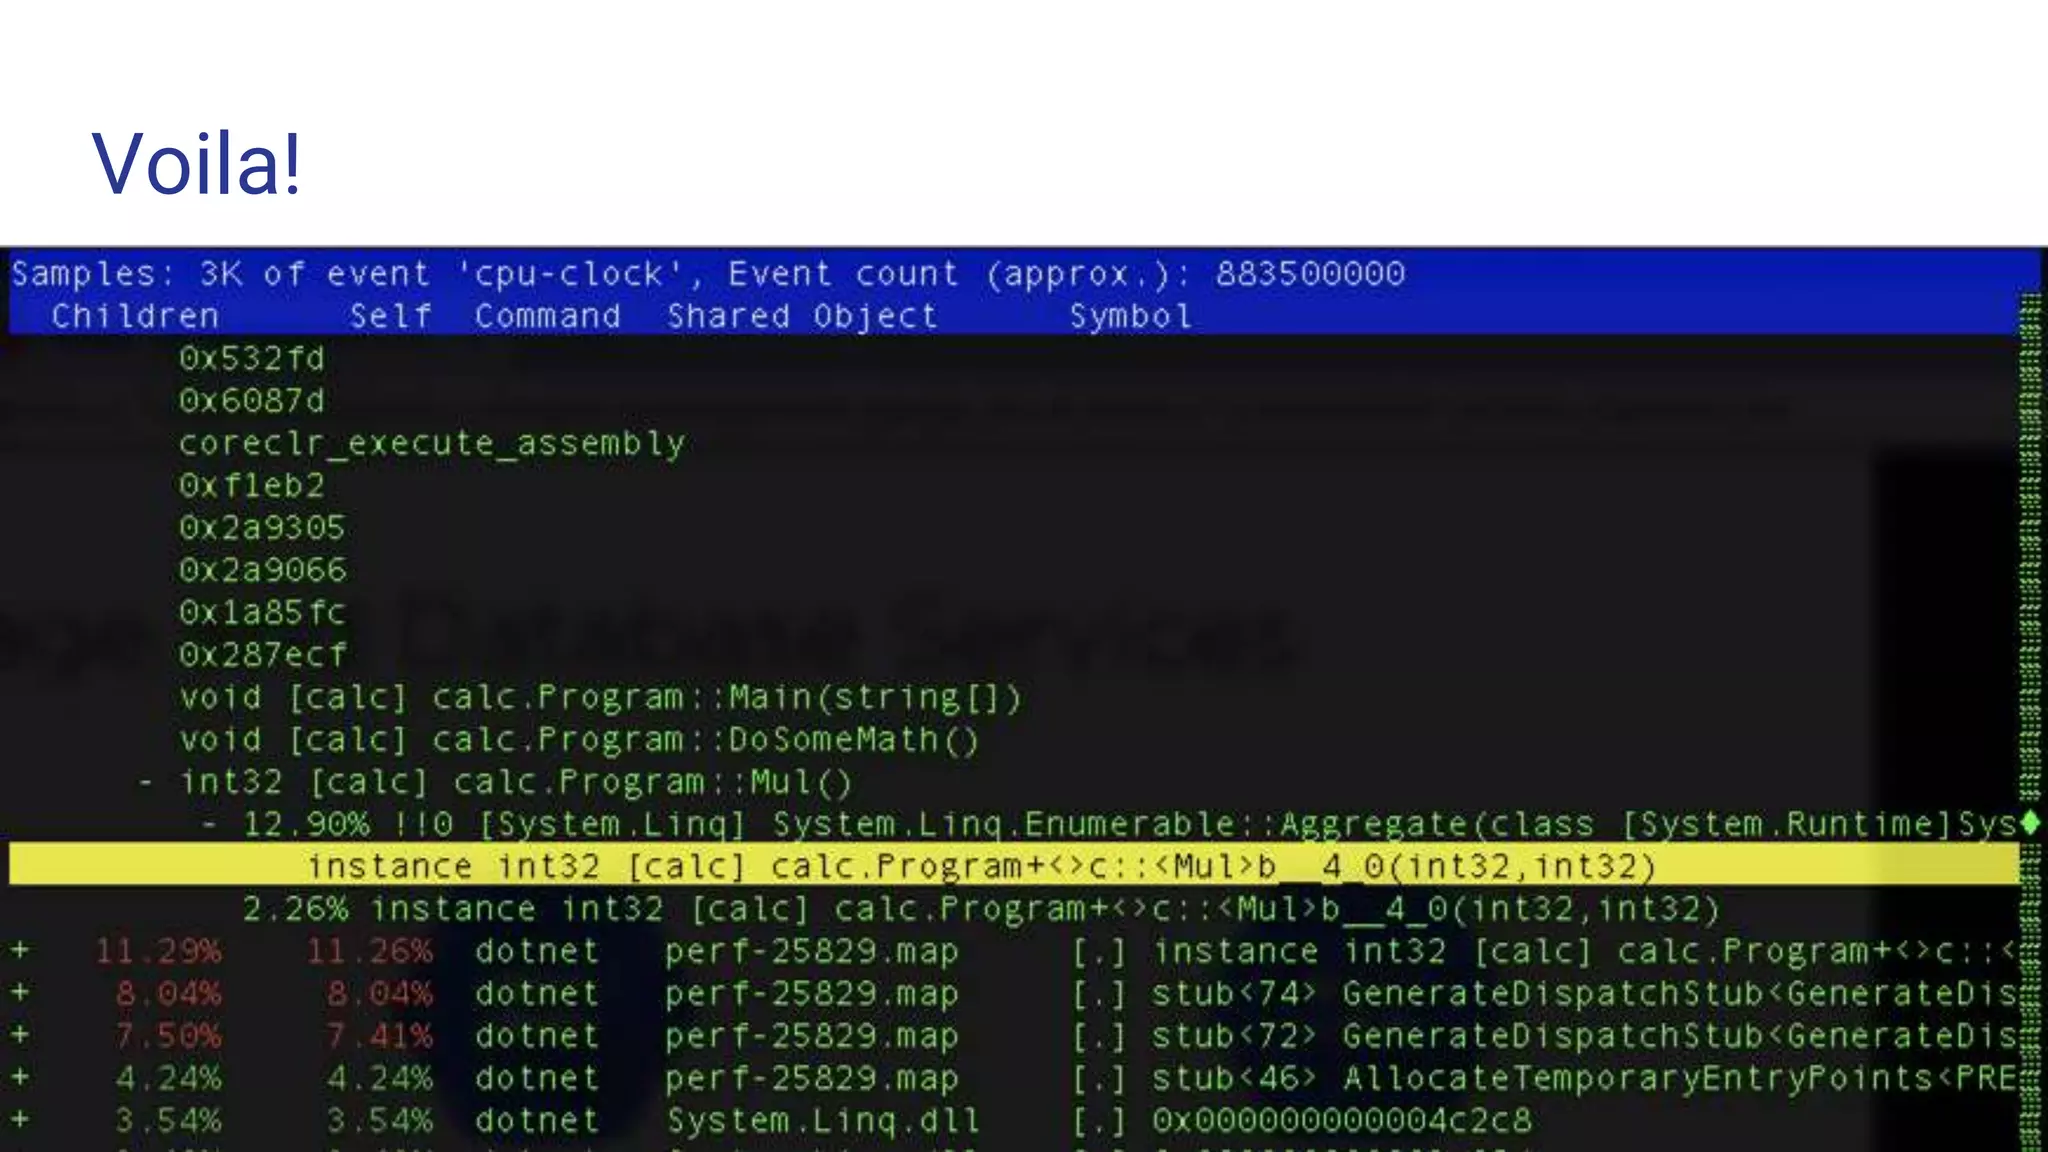
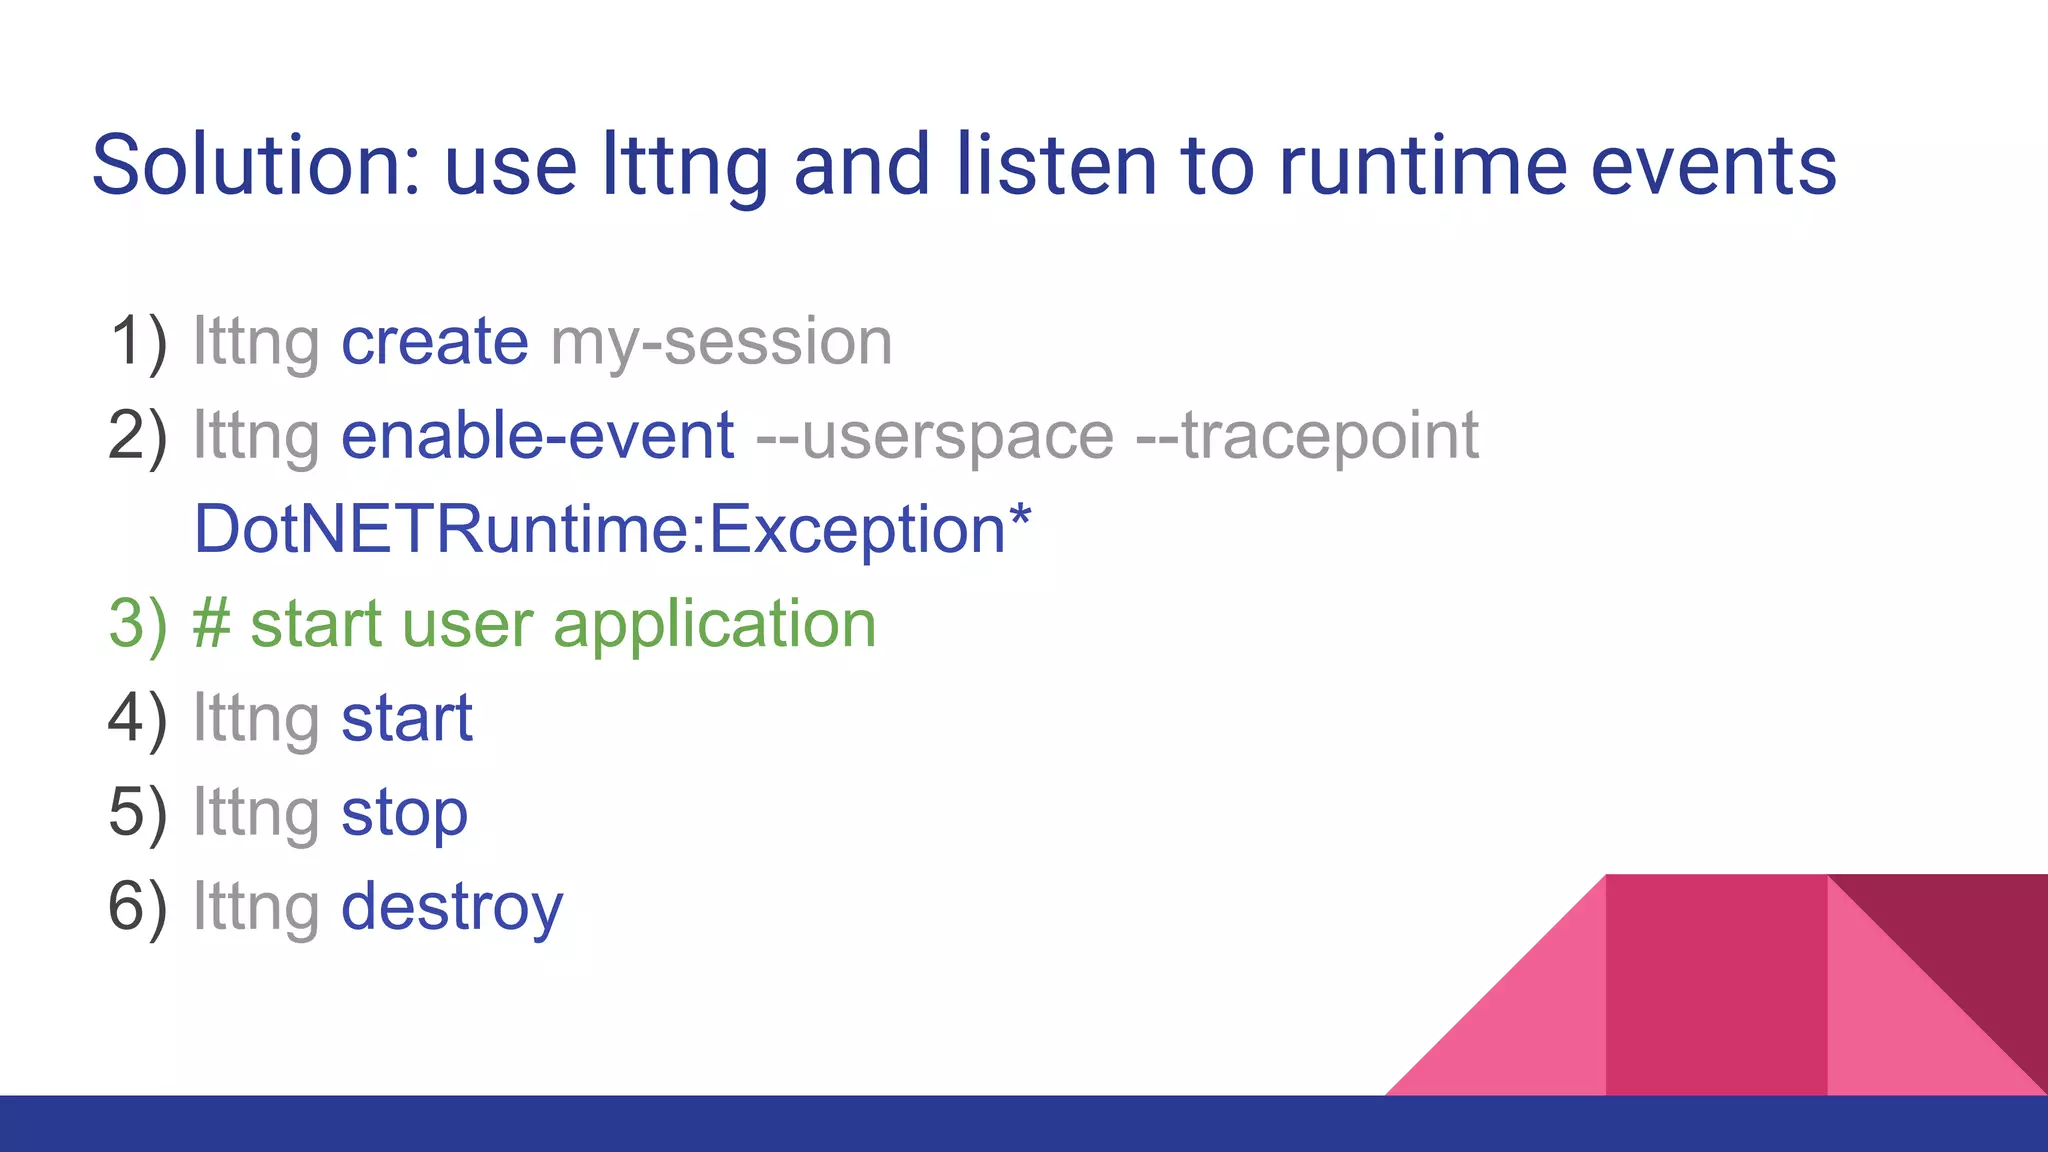
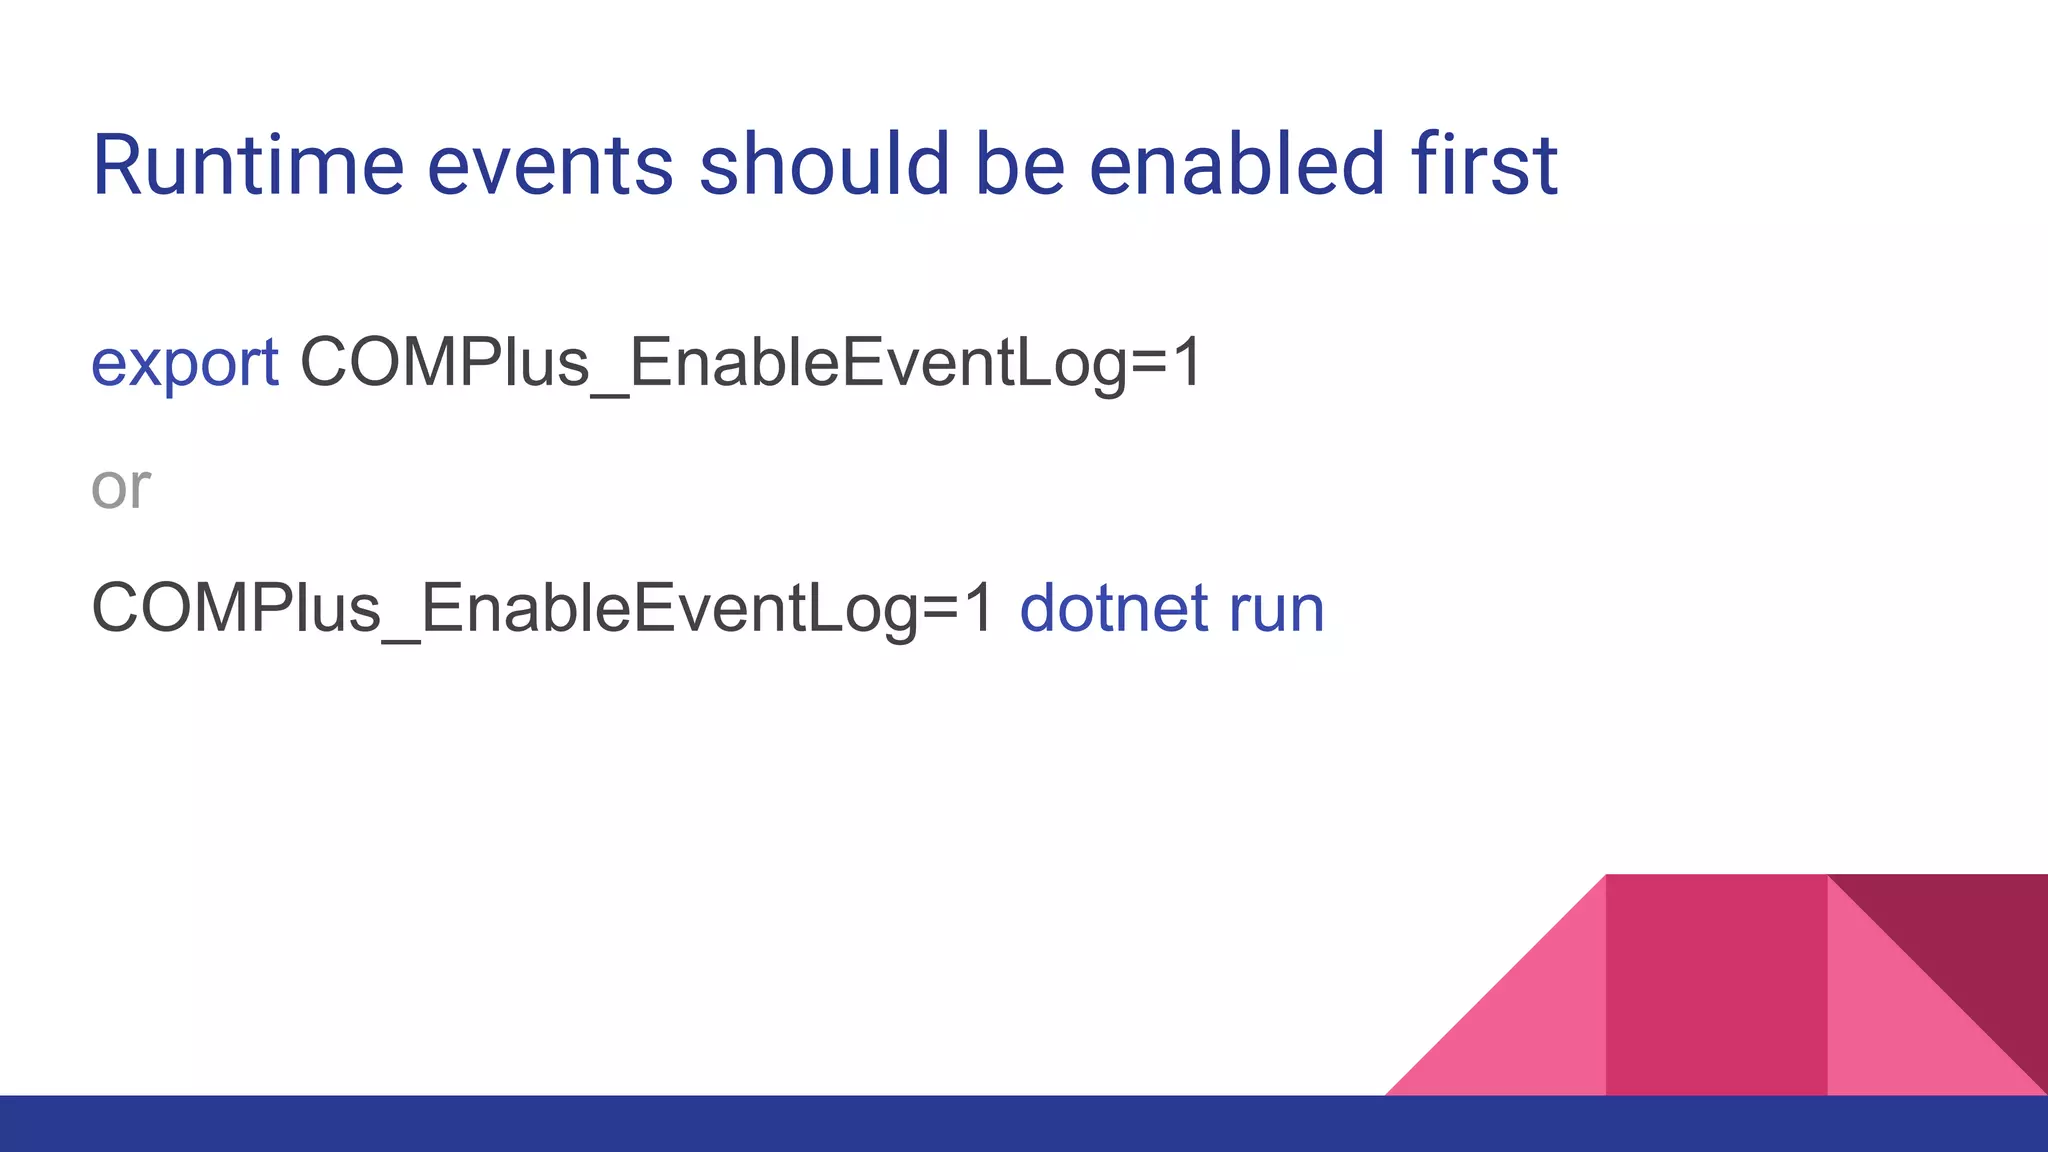
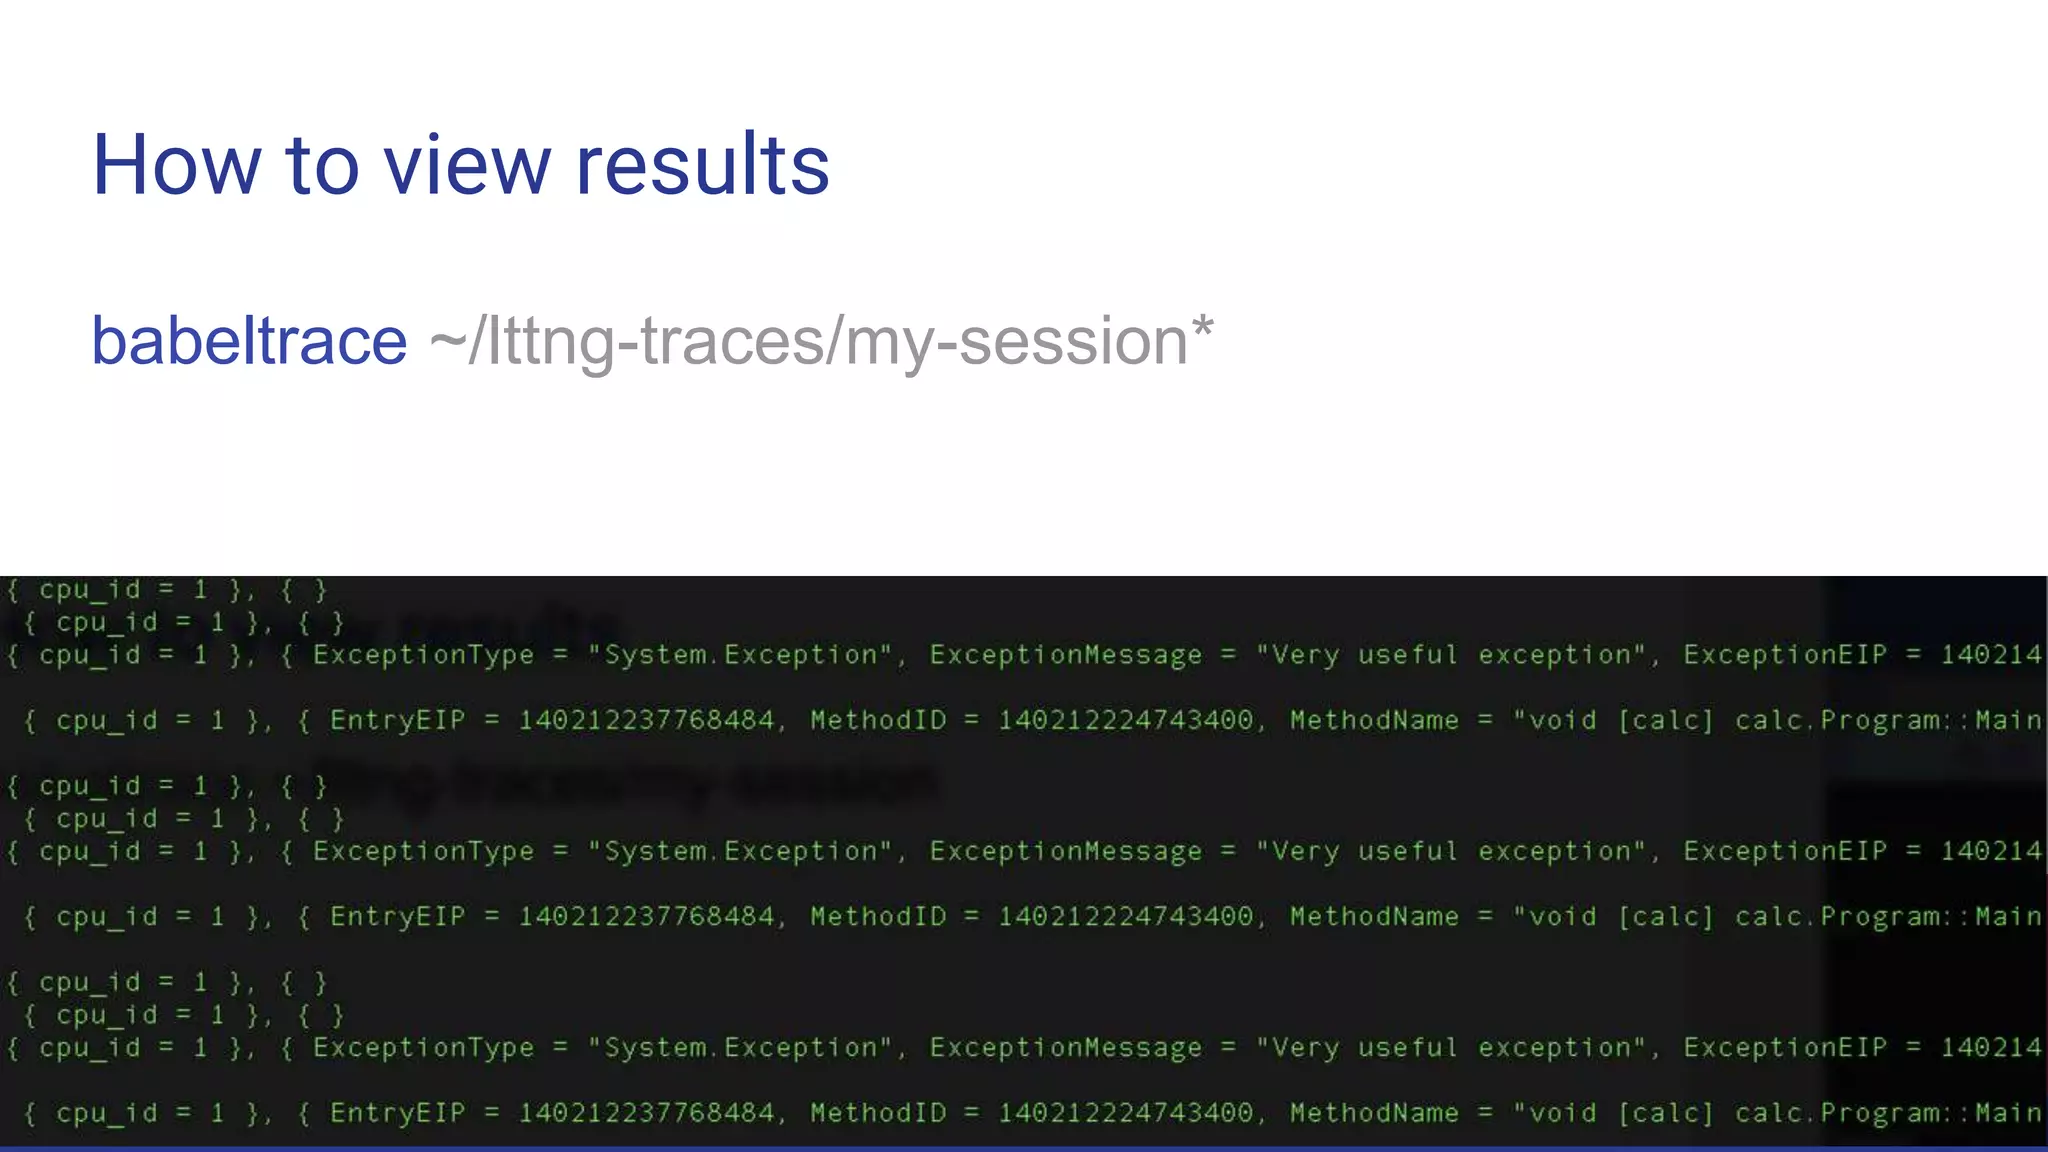
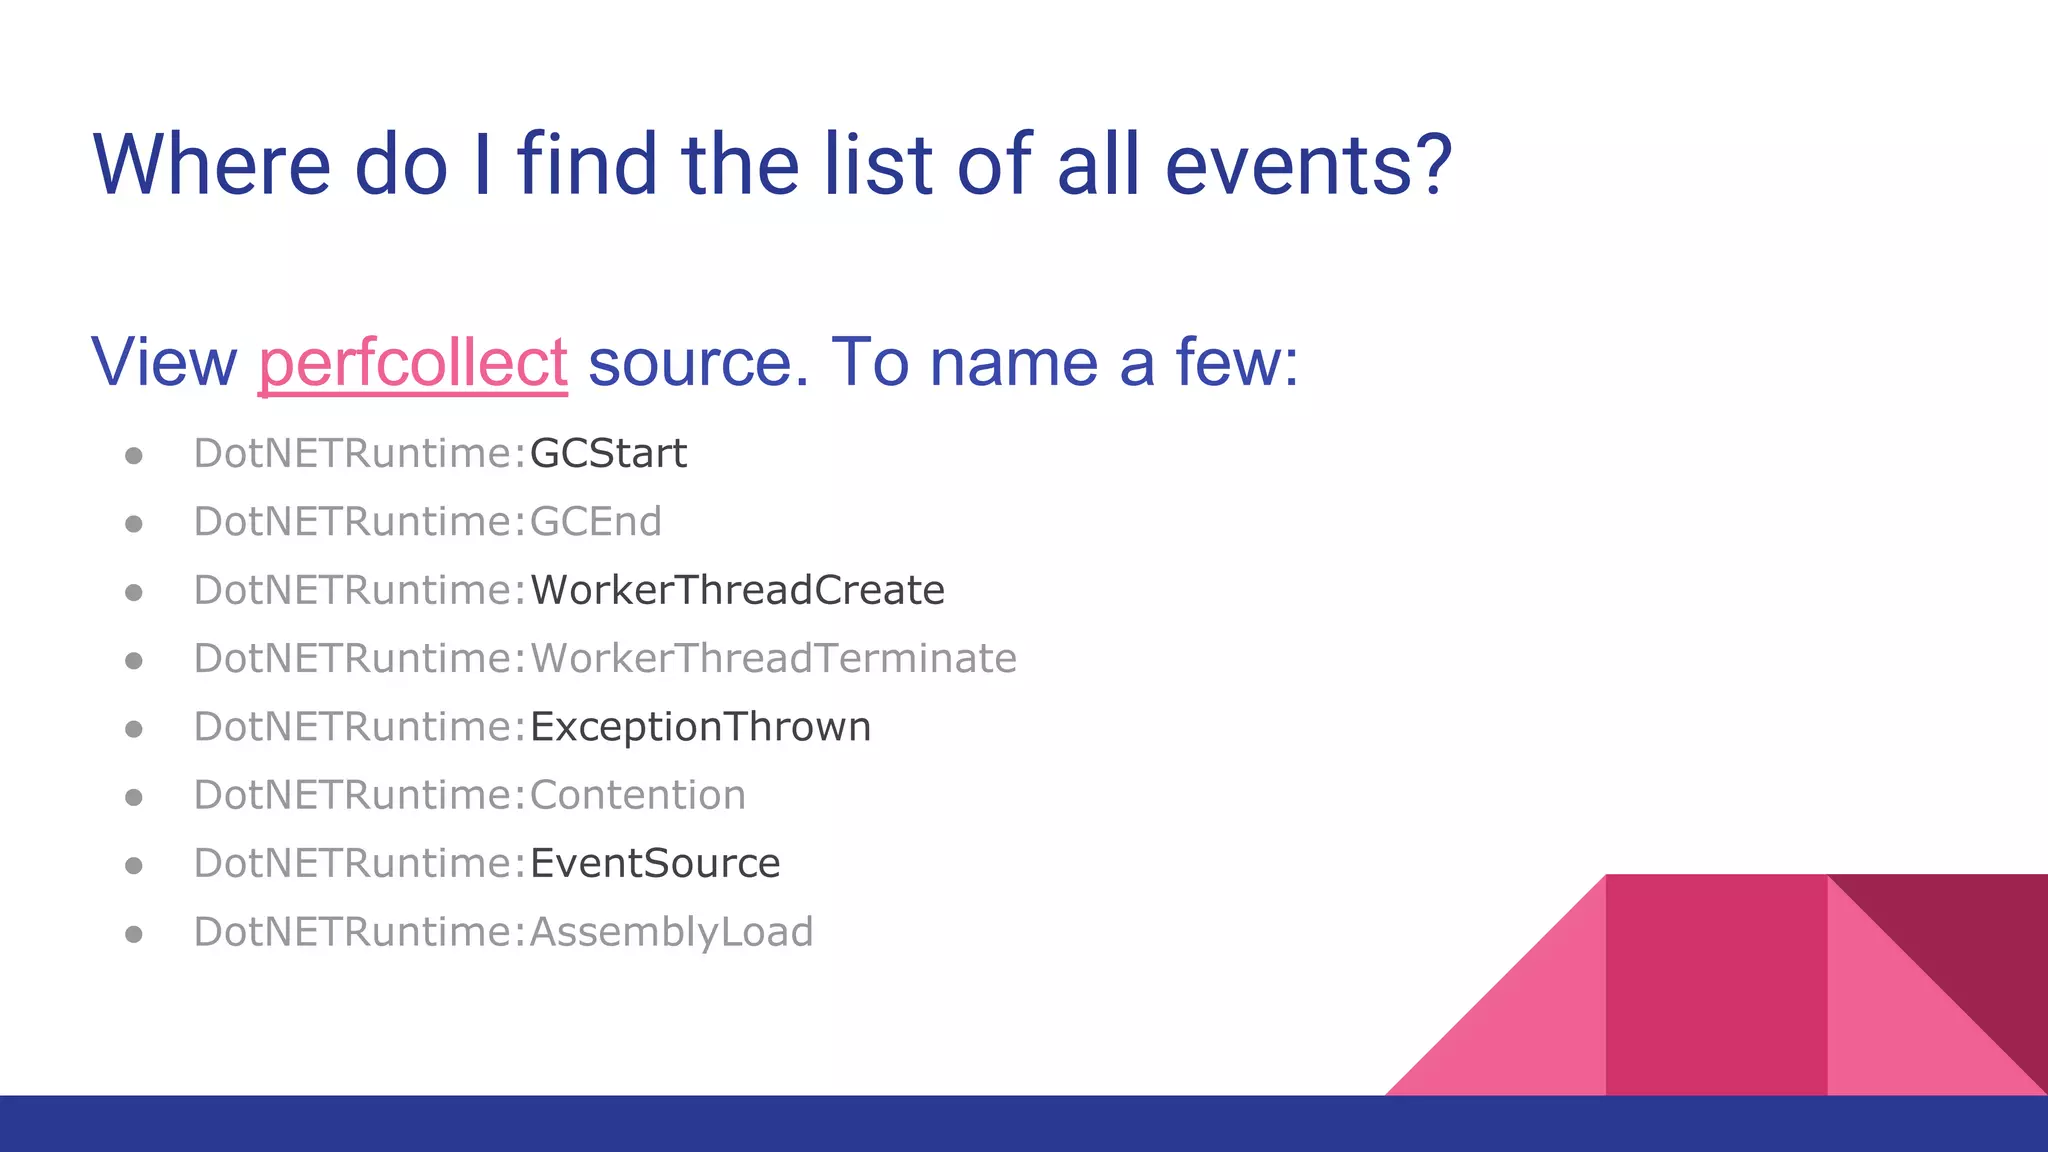
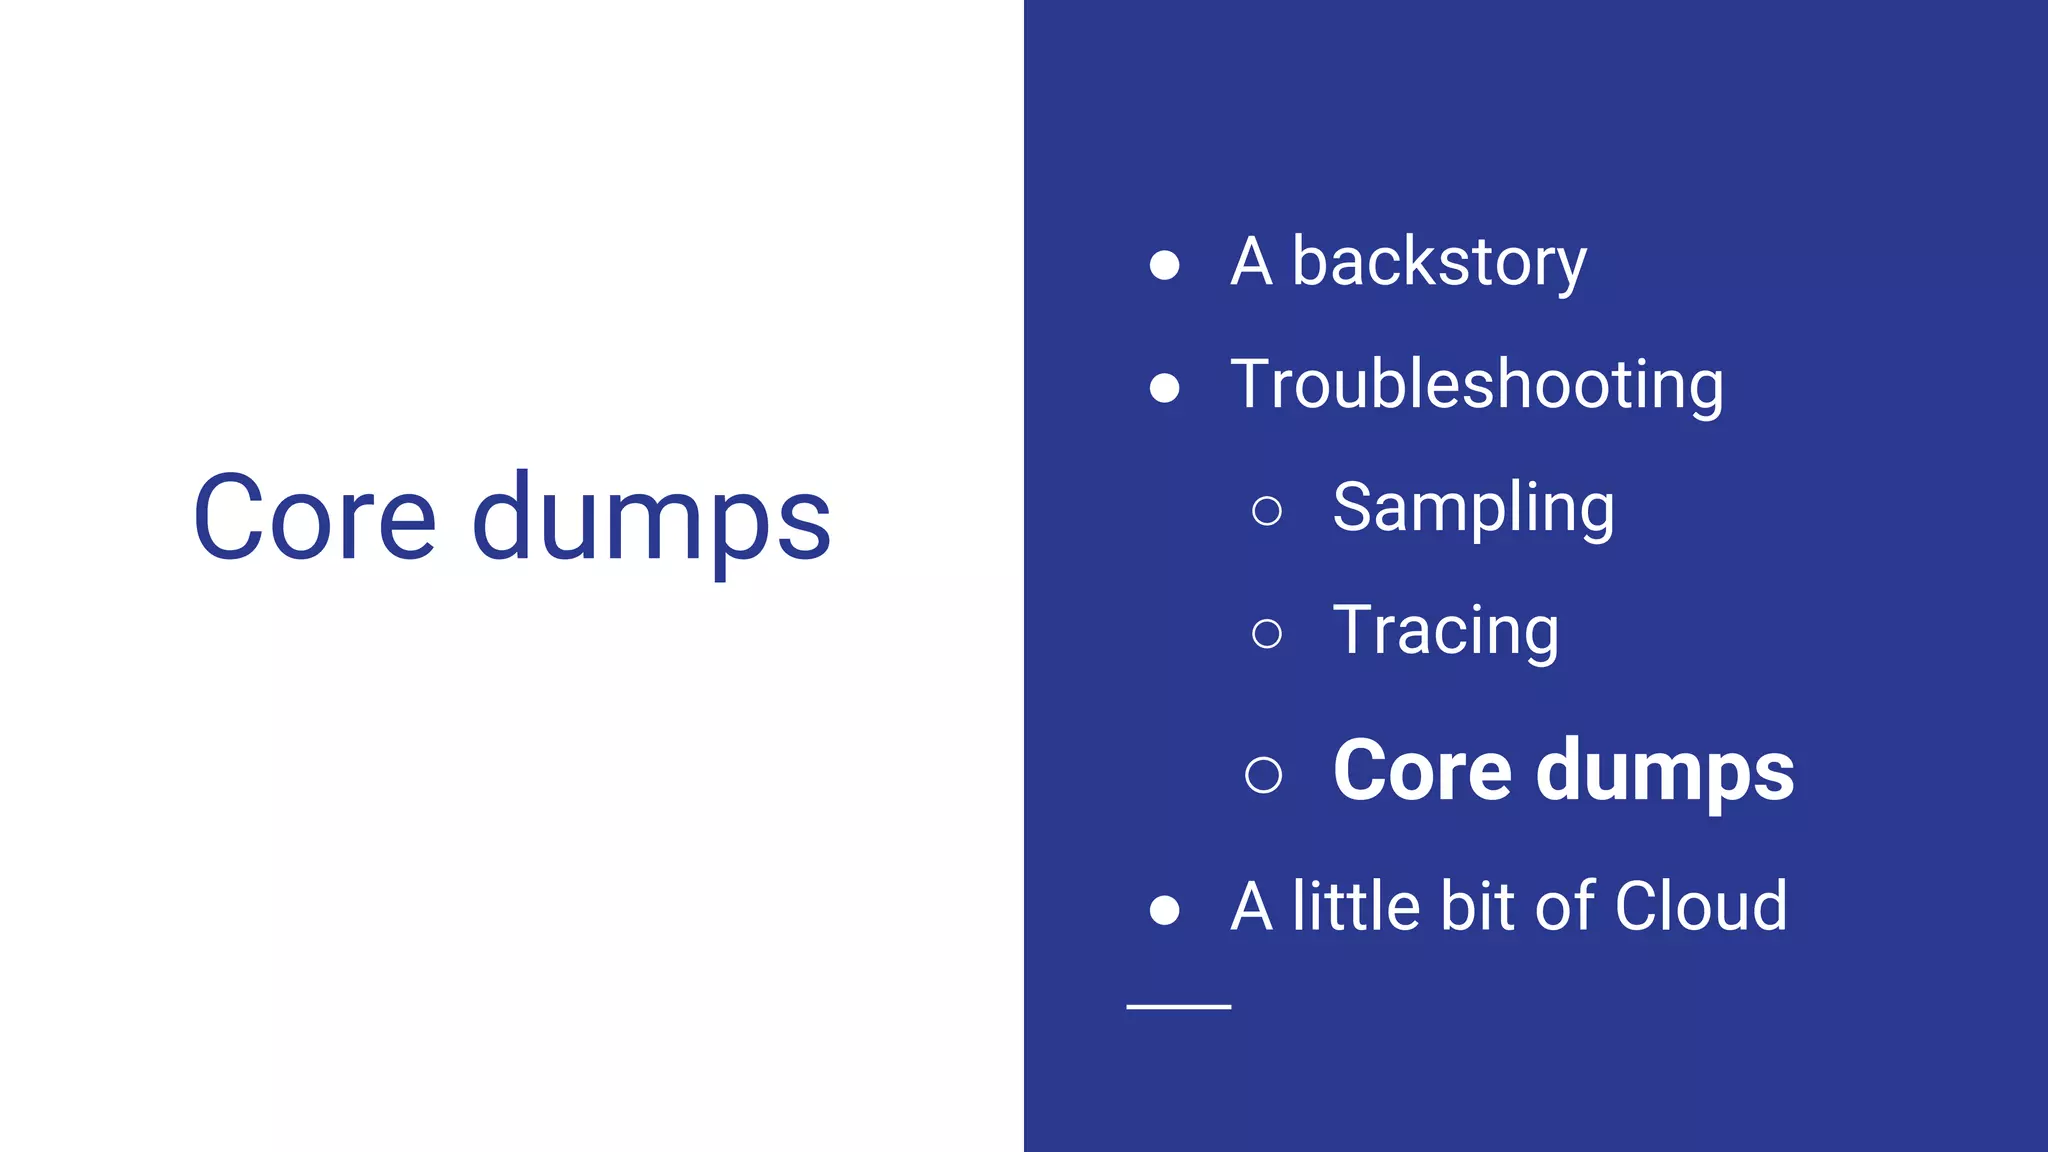
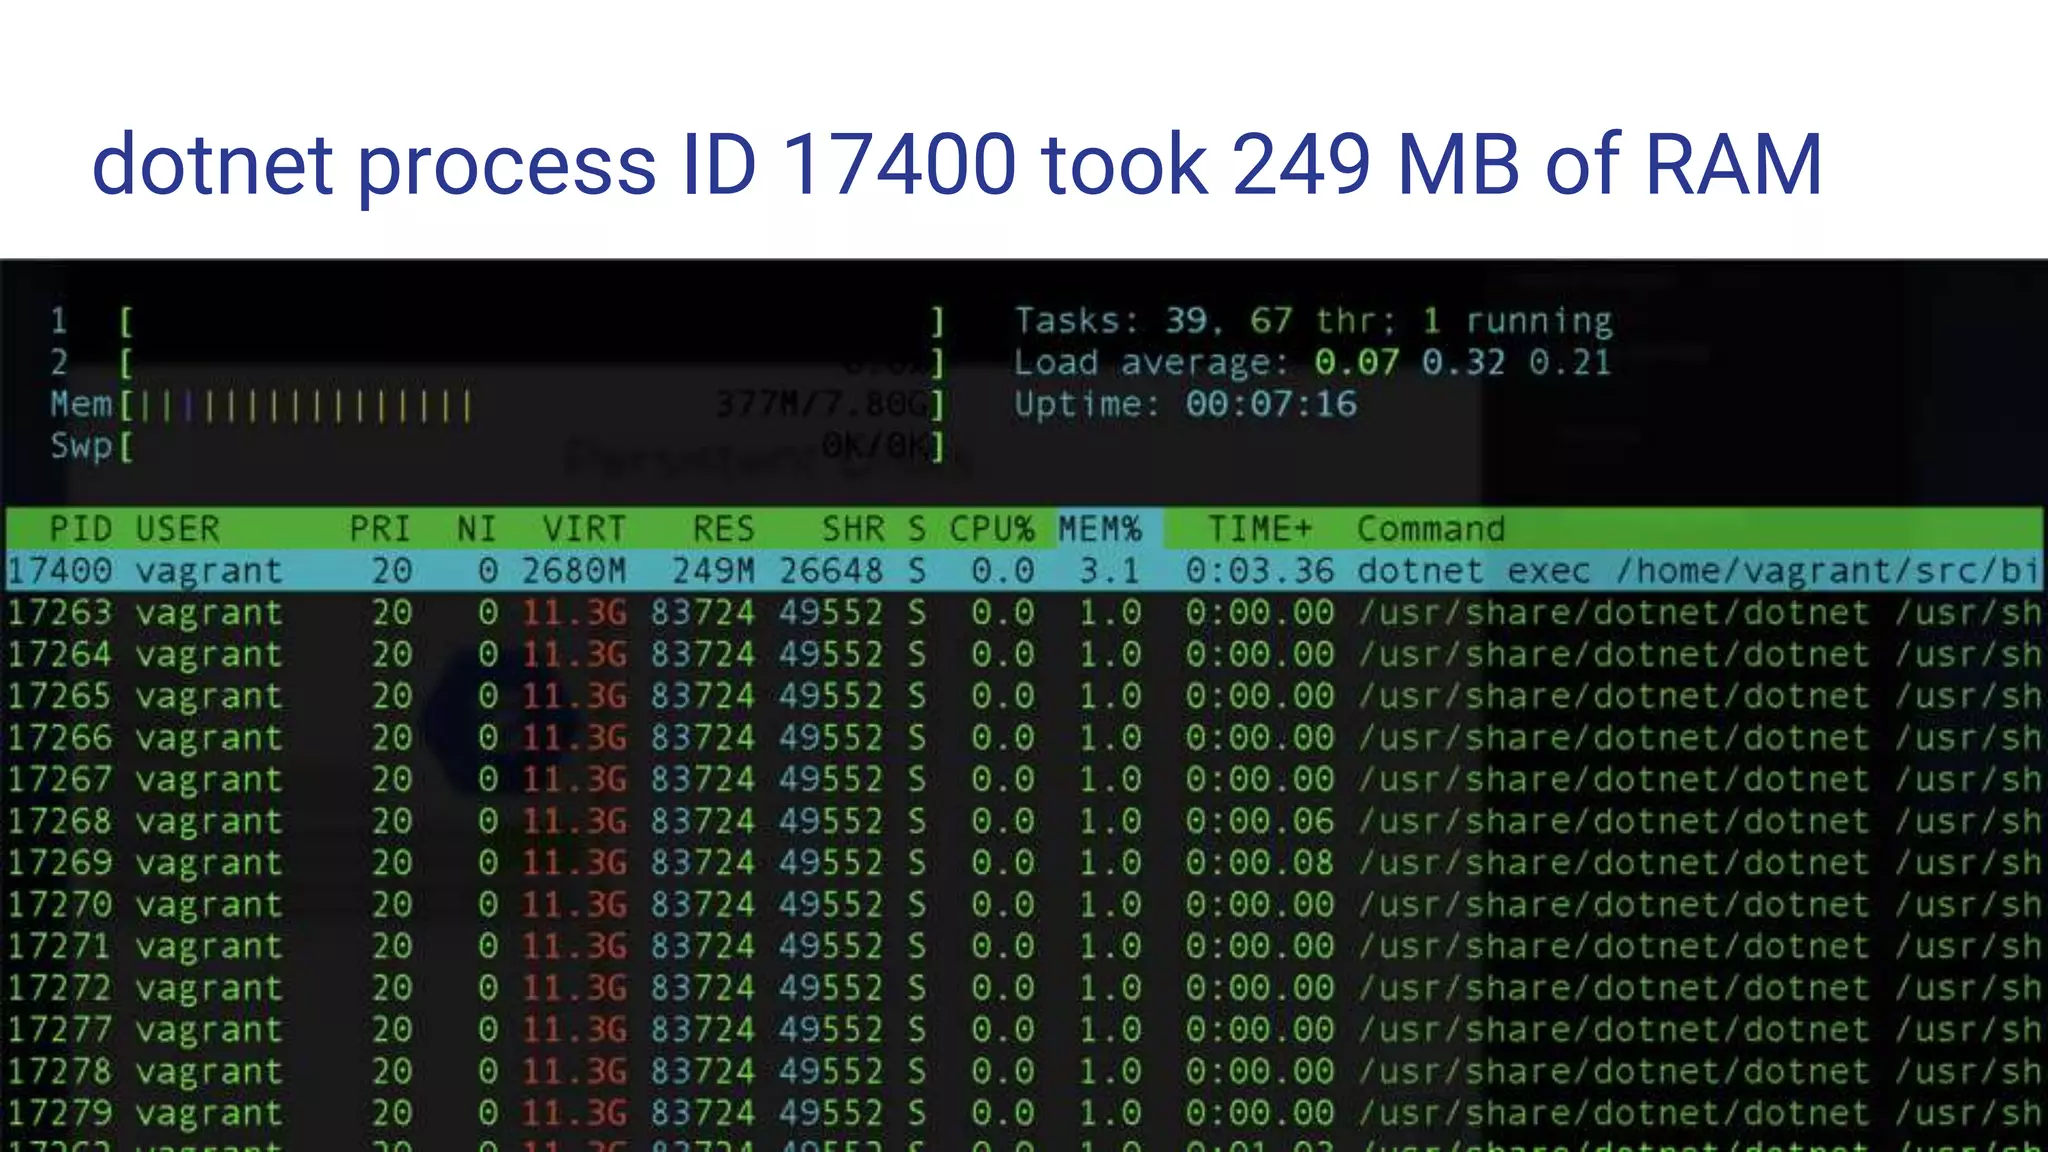
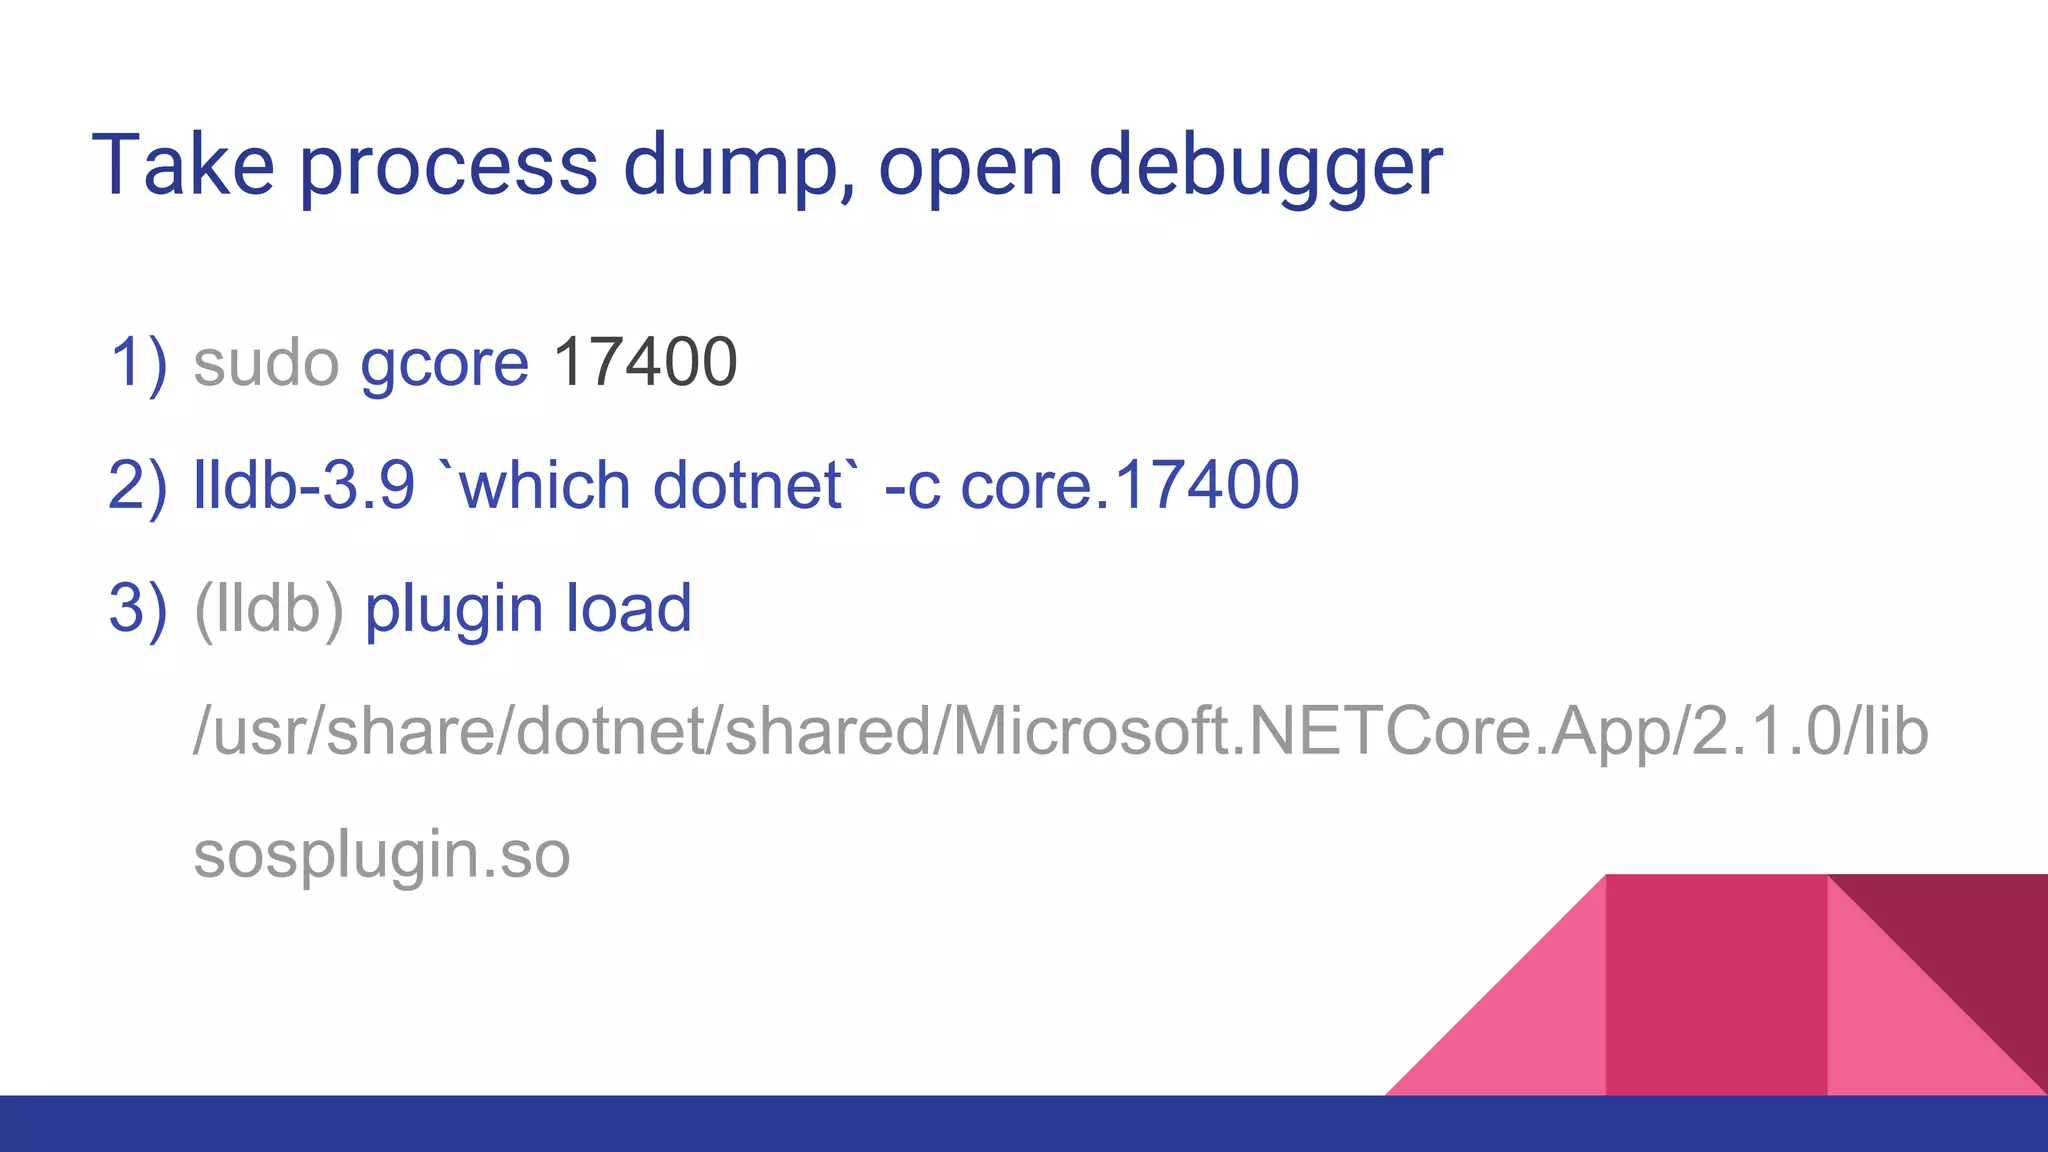
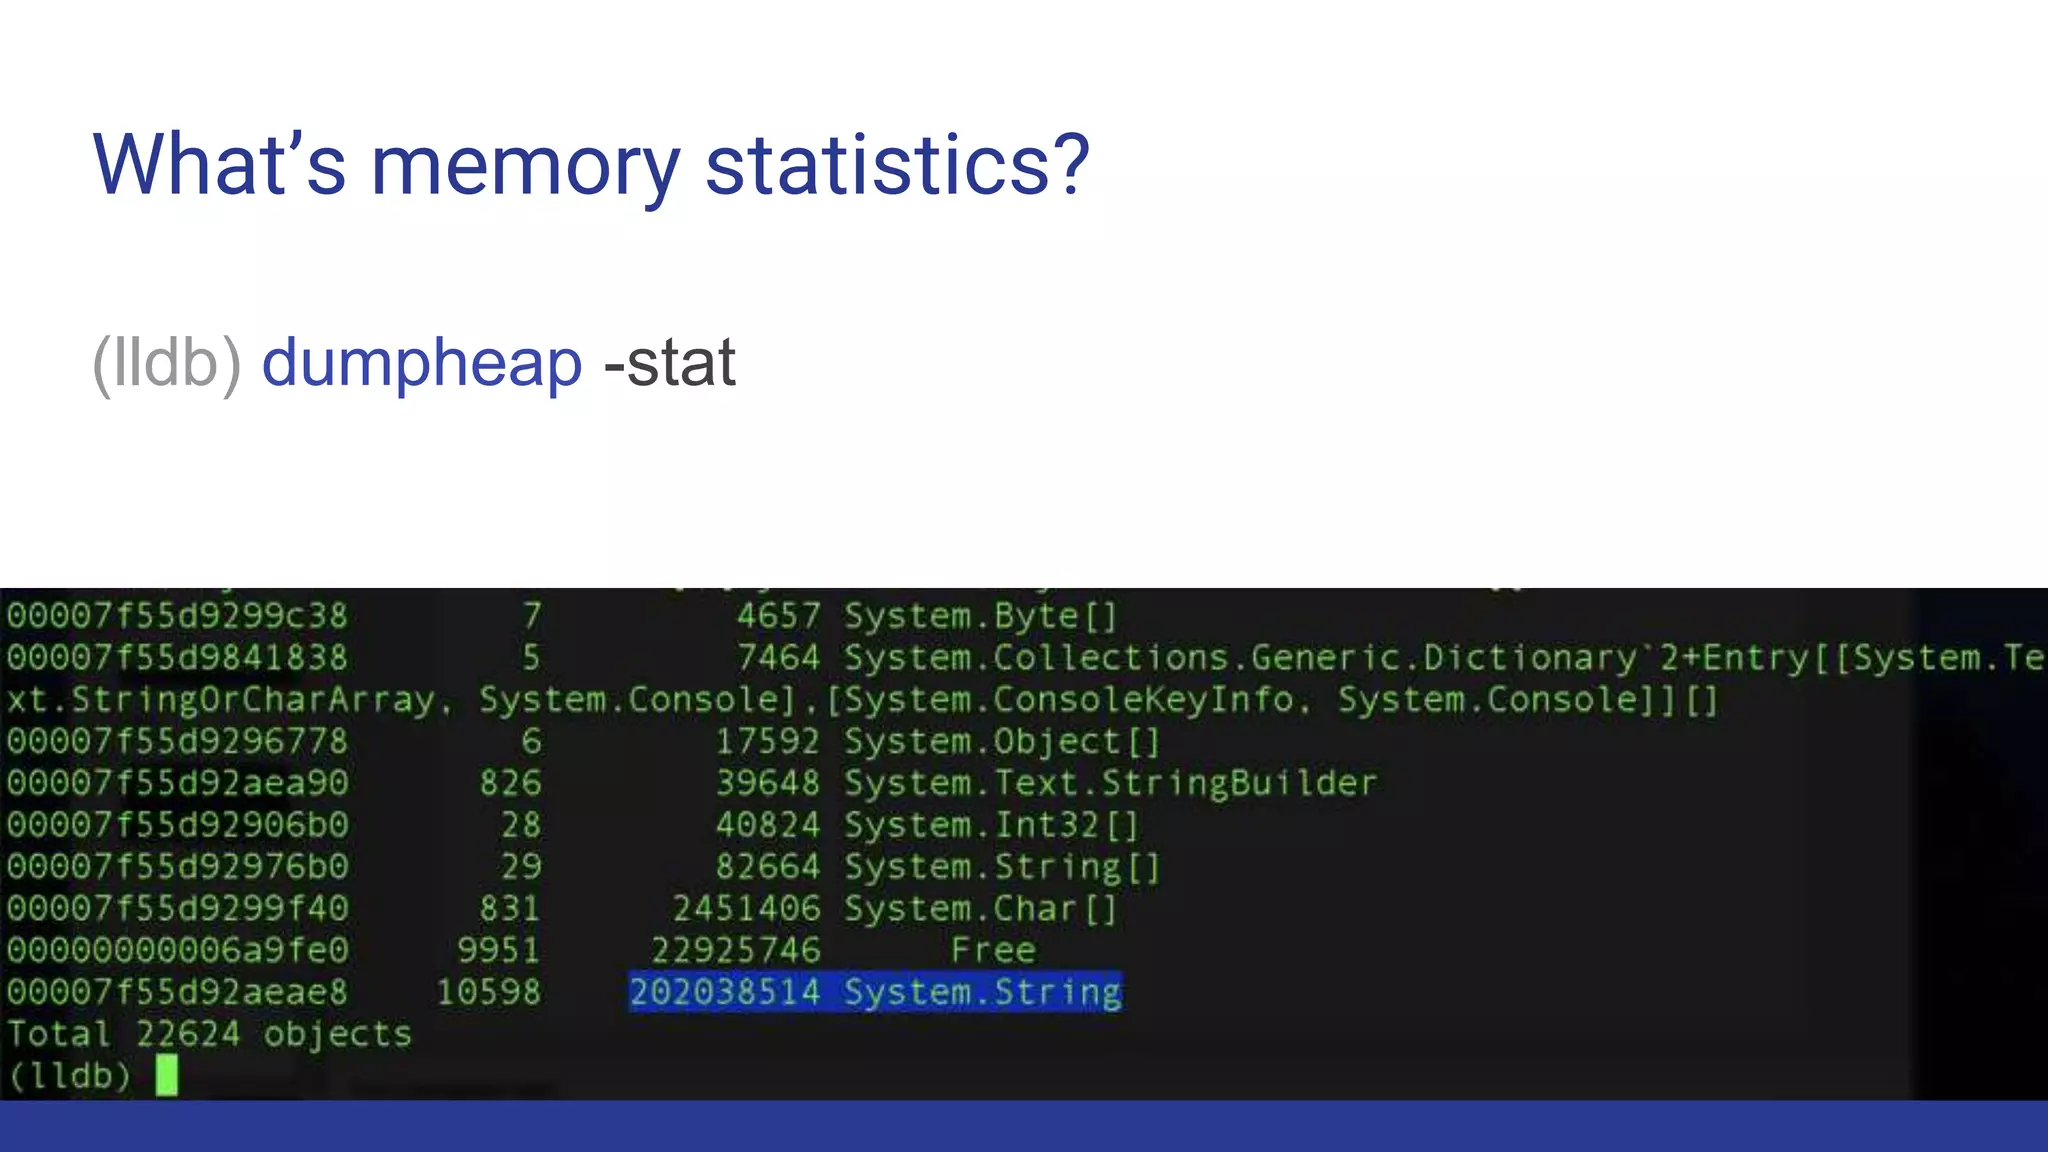
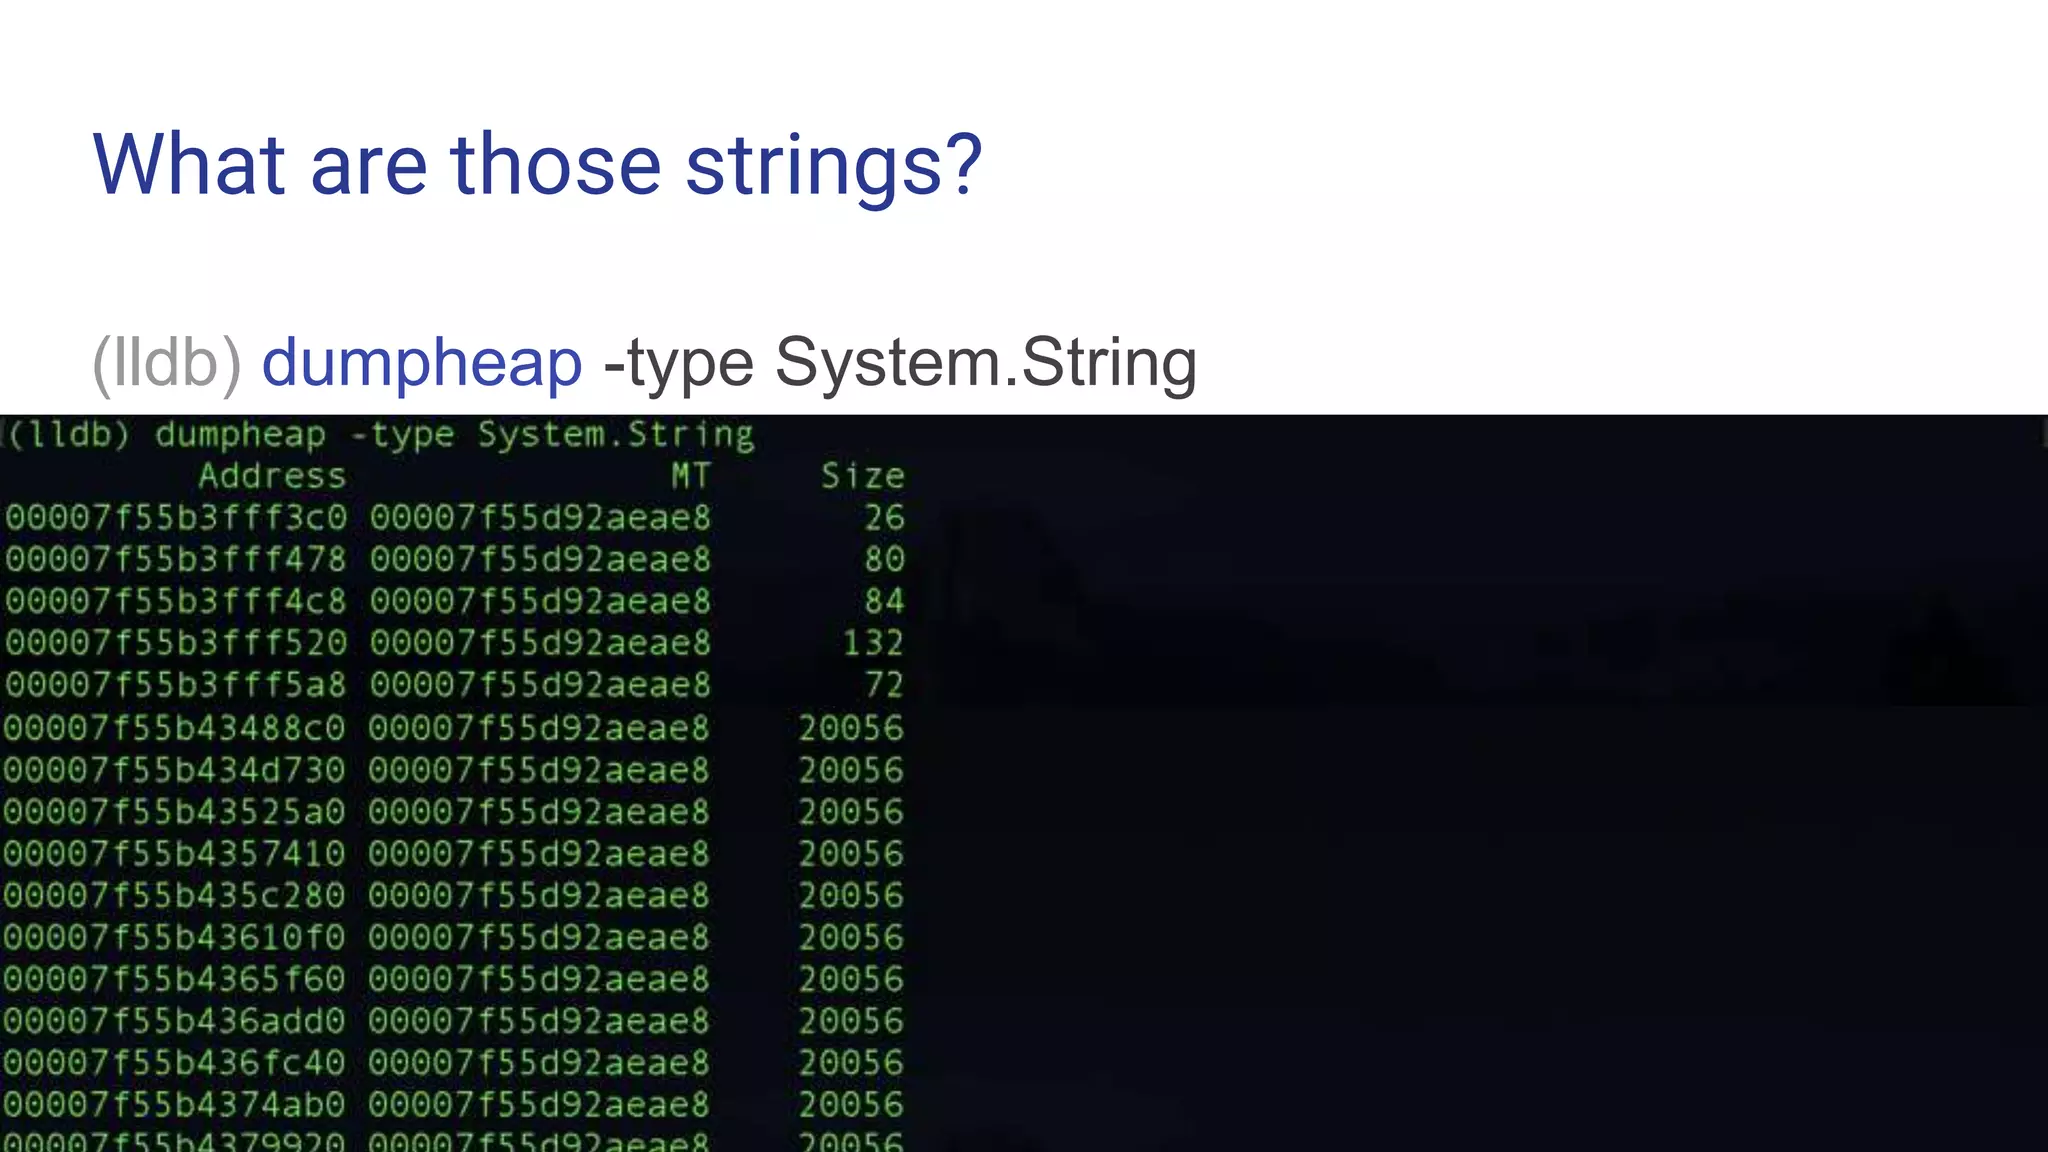
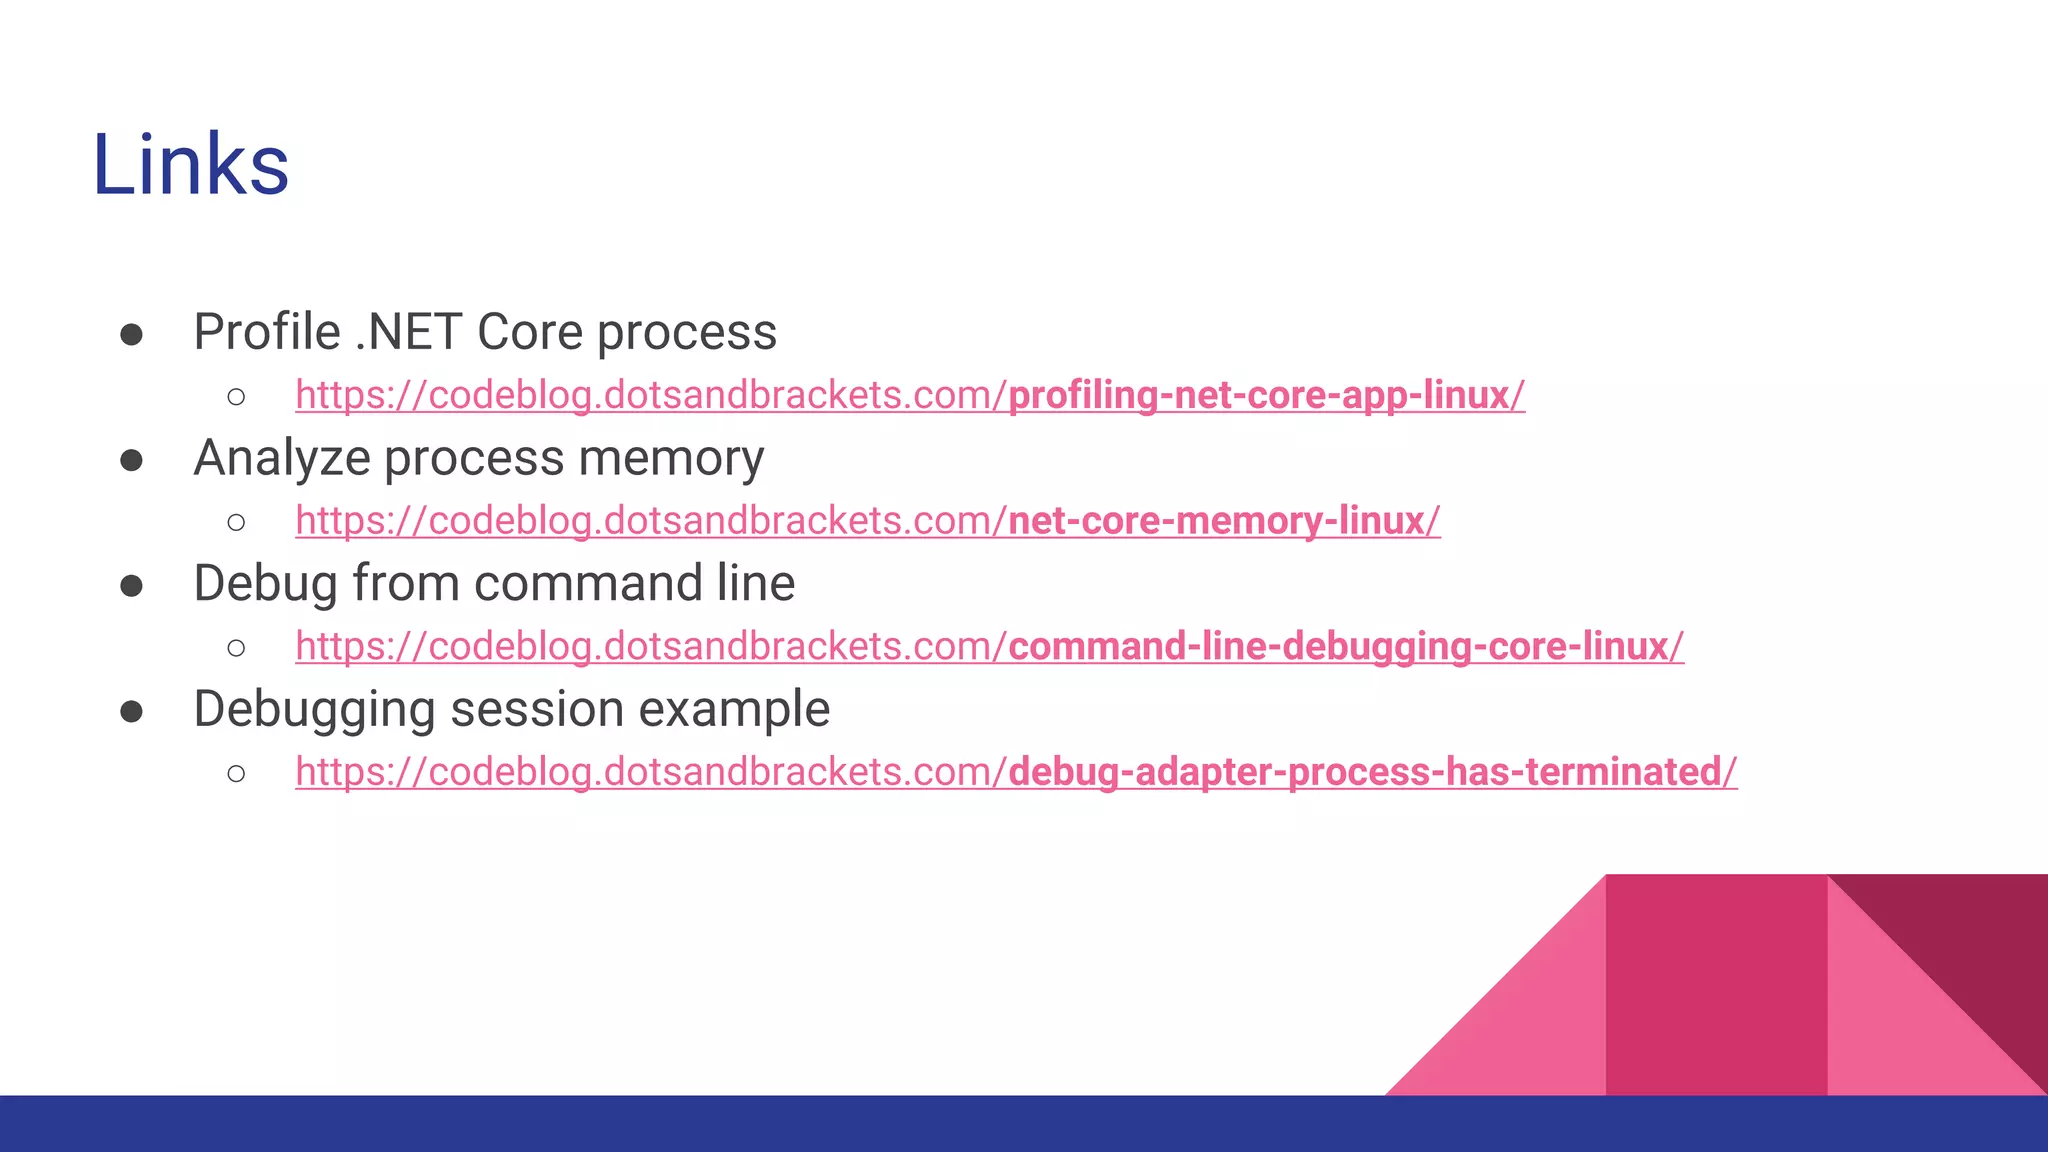

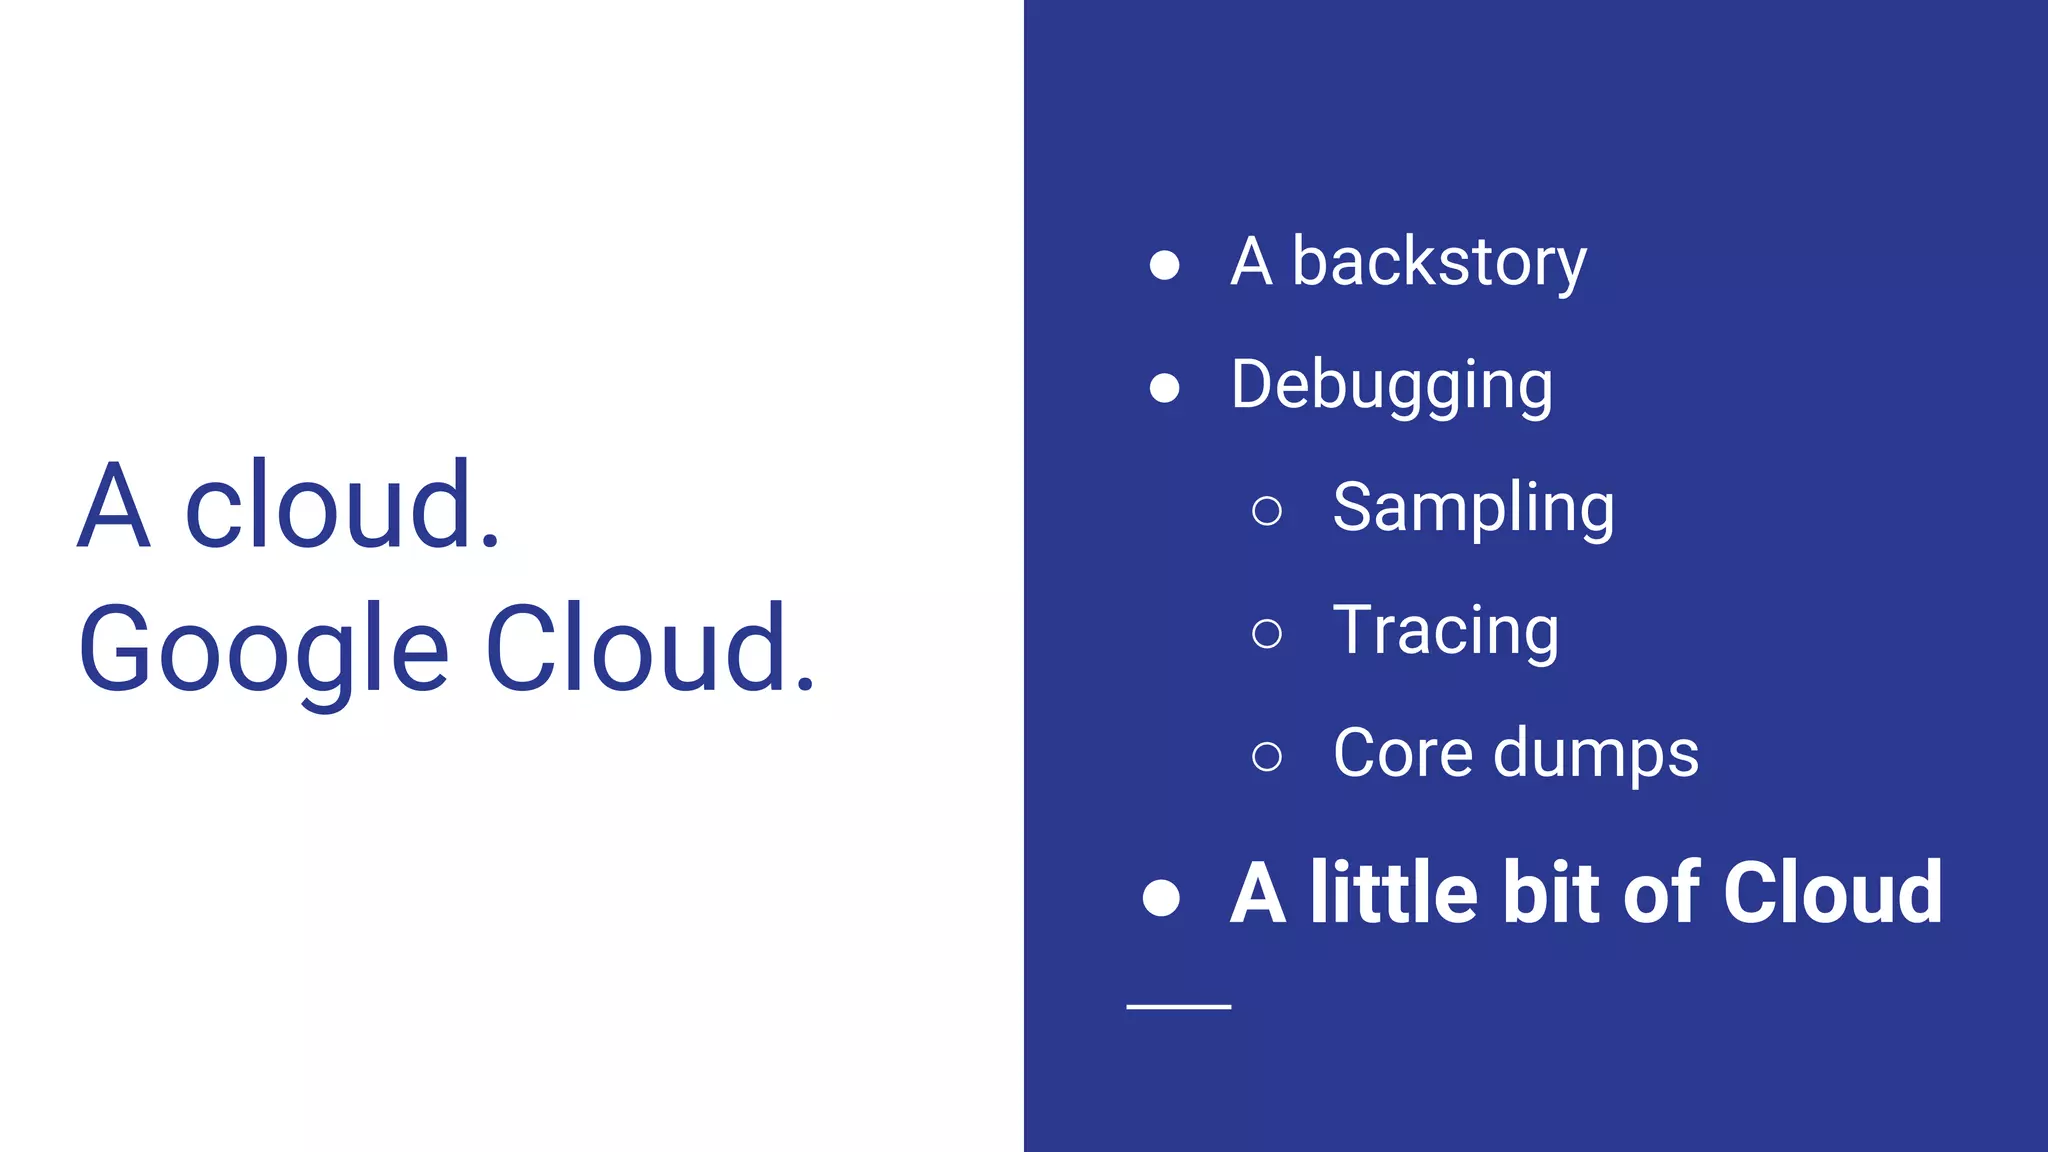
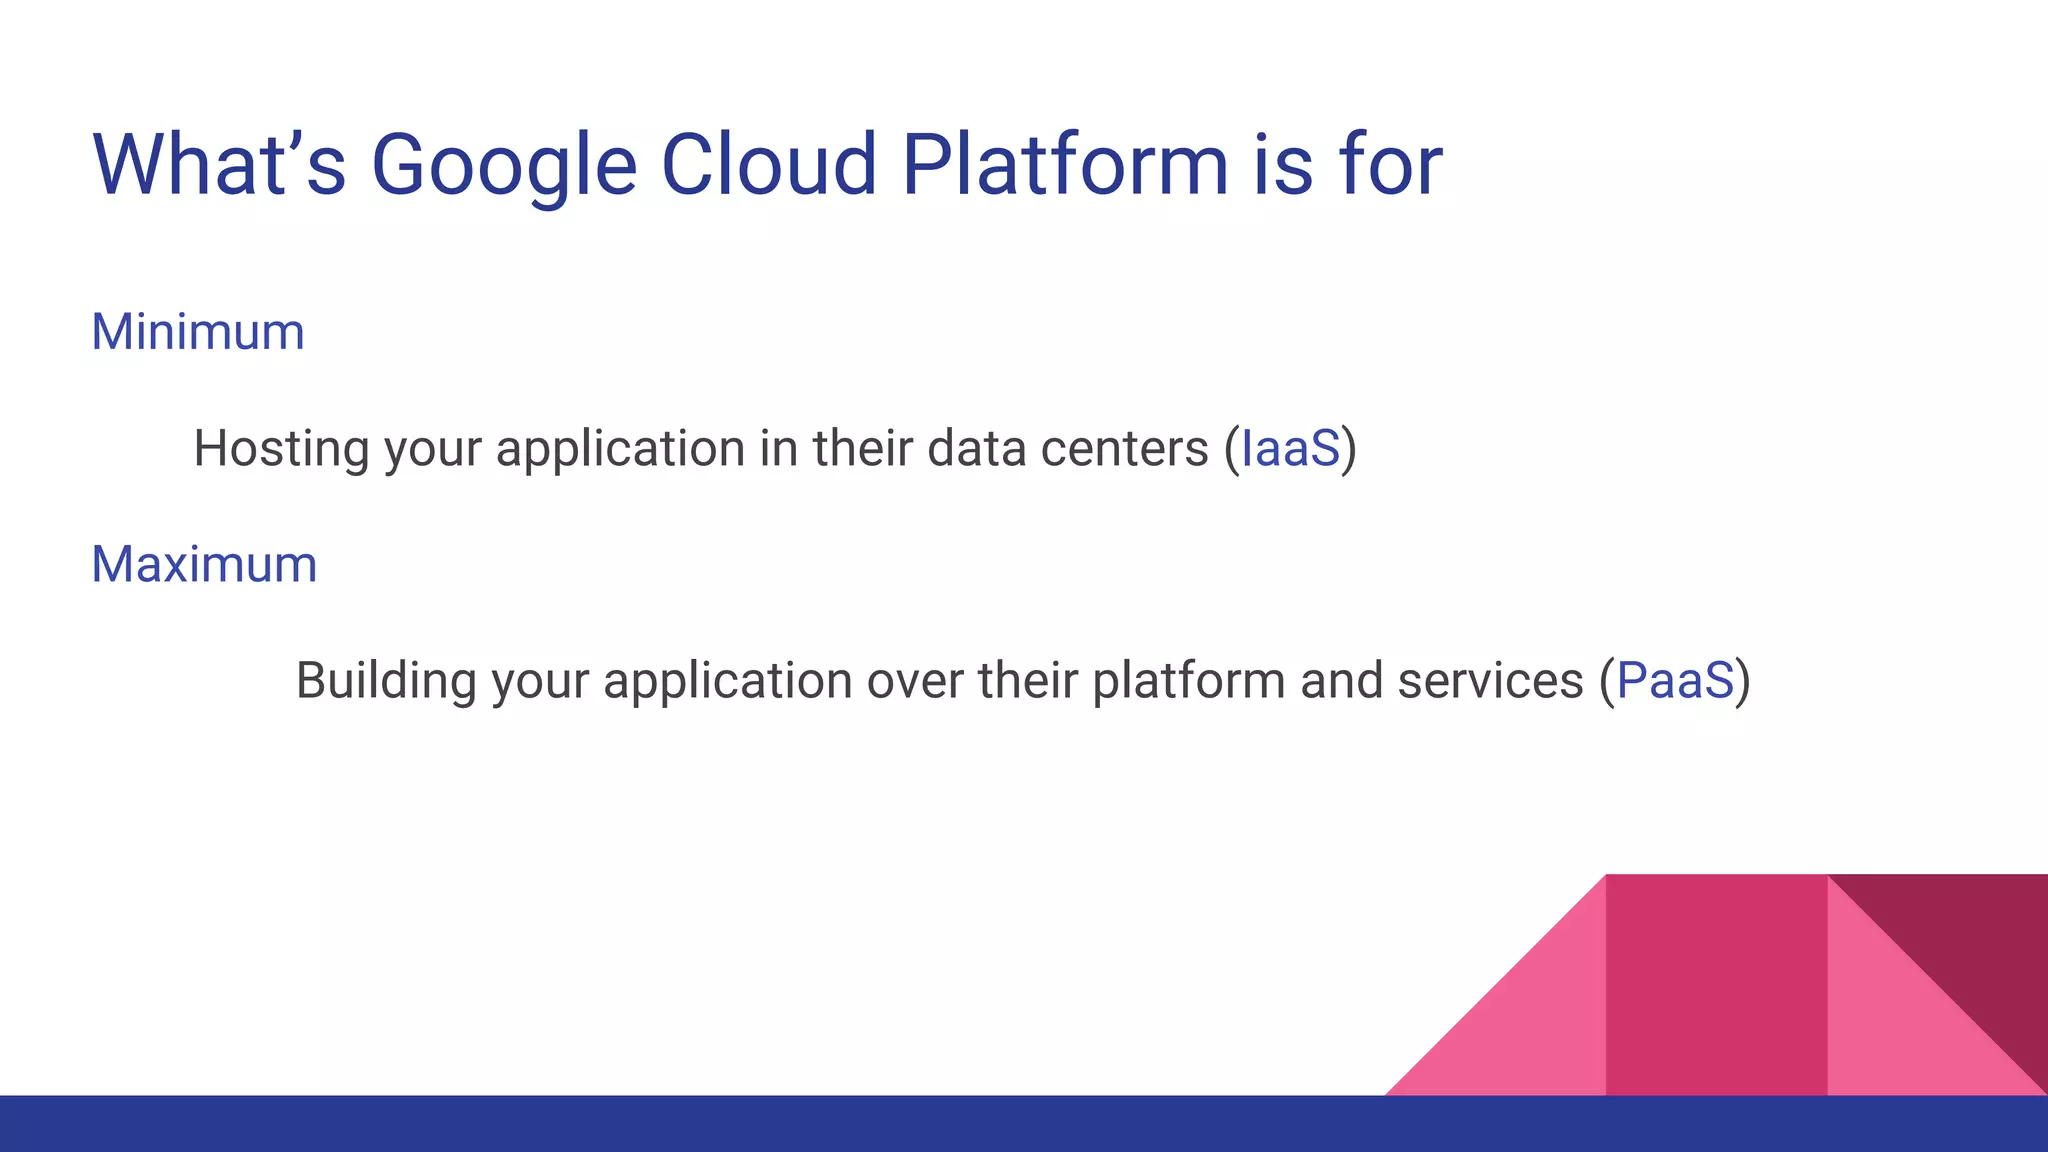
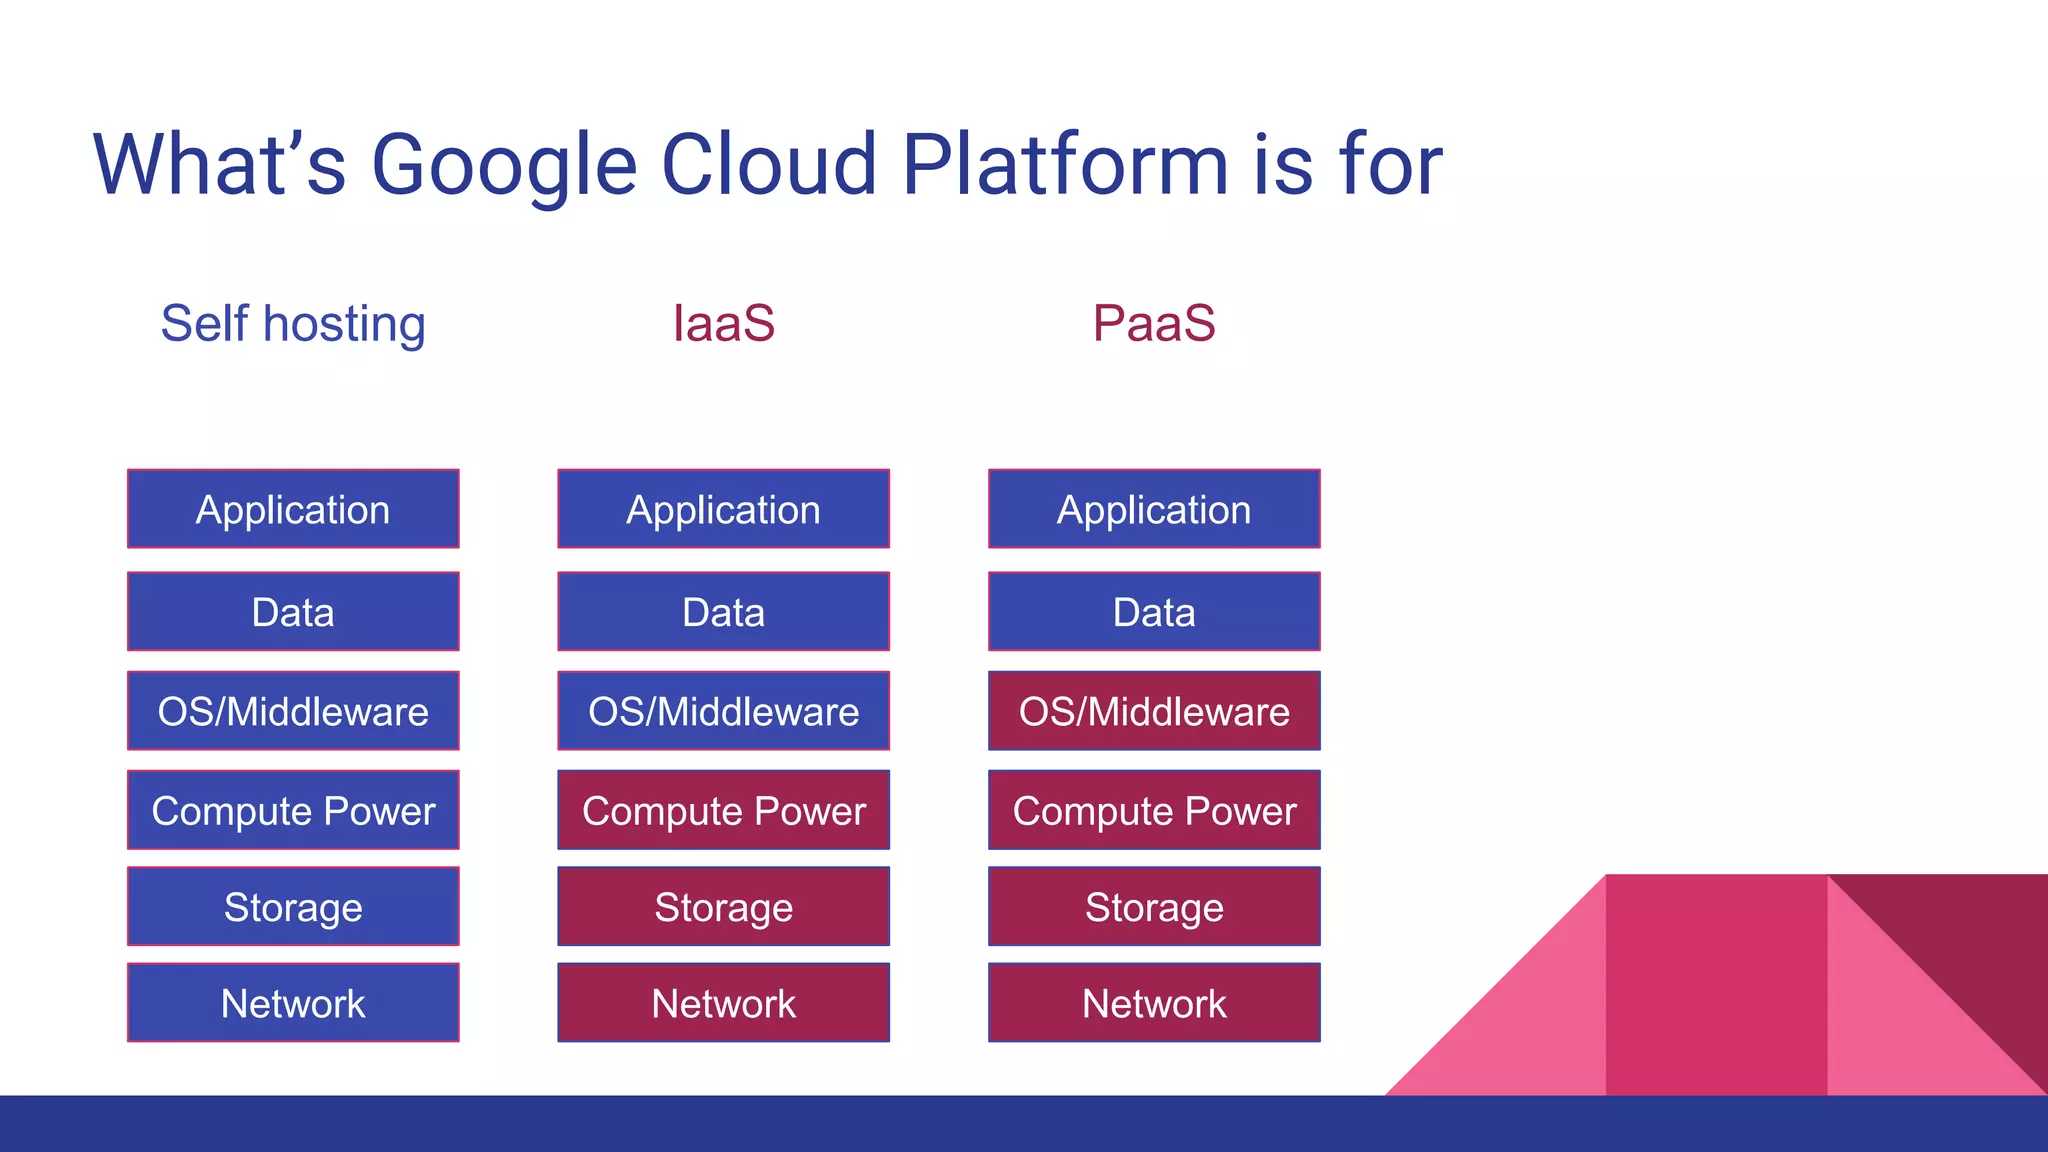


The document provides guidance on troubleshooting .NET Core applications on Linux, covering techniques such as sampling, tracing, and core dumps. It emphasizes tools like Perf and LTTng for performance analysis and debugging, as well as Google Cloud's offerings for hosting applications. Key steps and commands for implementing these debugging strategies are included to assist developers in resolving issues effectively.


![[Sitcon2018] Analysis and Improvement of IOTA PoW Implementation](https://cdn.slidesharecdn.com/ss_thumbnails/sitcon2018analysisandimprovementofiotapowimplementation-180306085230-thumbnail.jpg?width=640&height=640&fit=bounds)