Downloaded 89 times
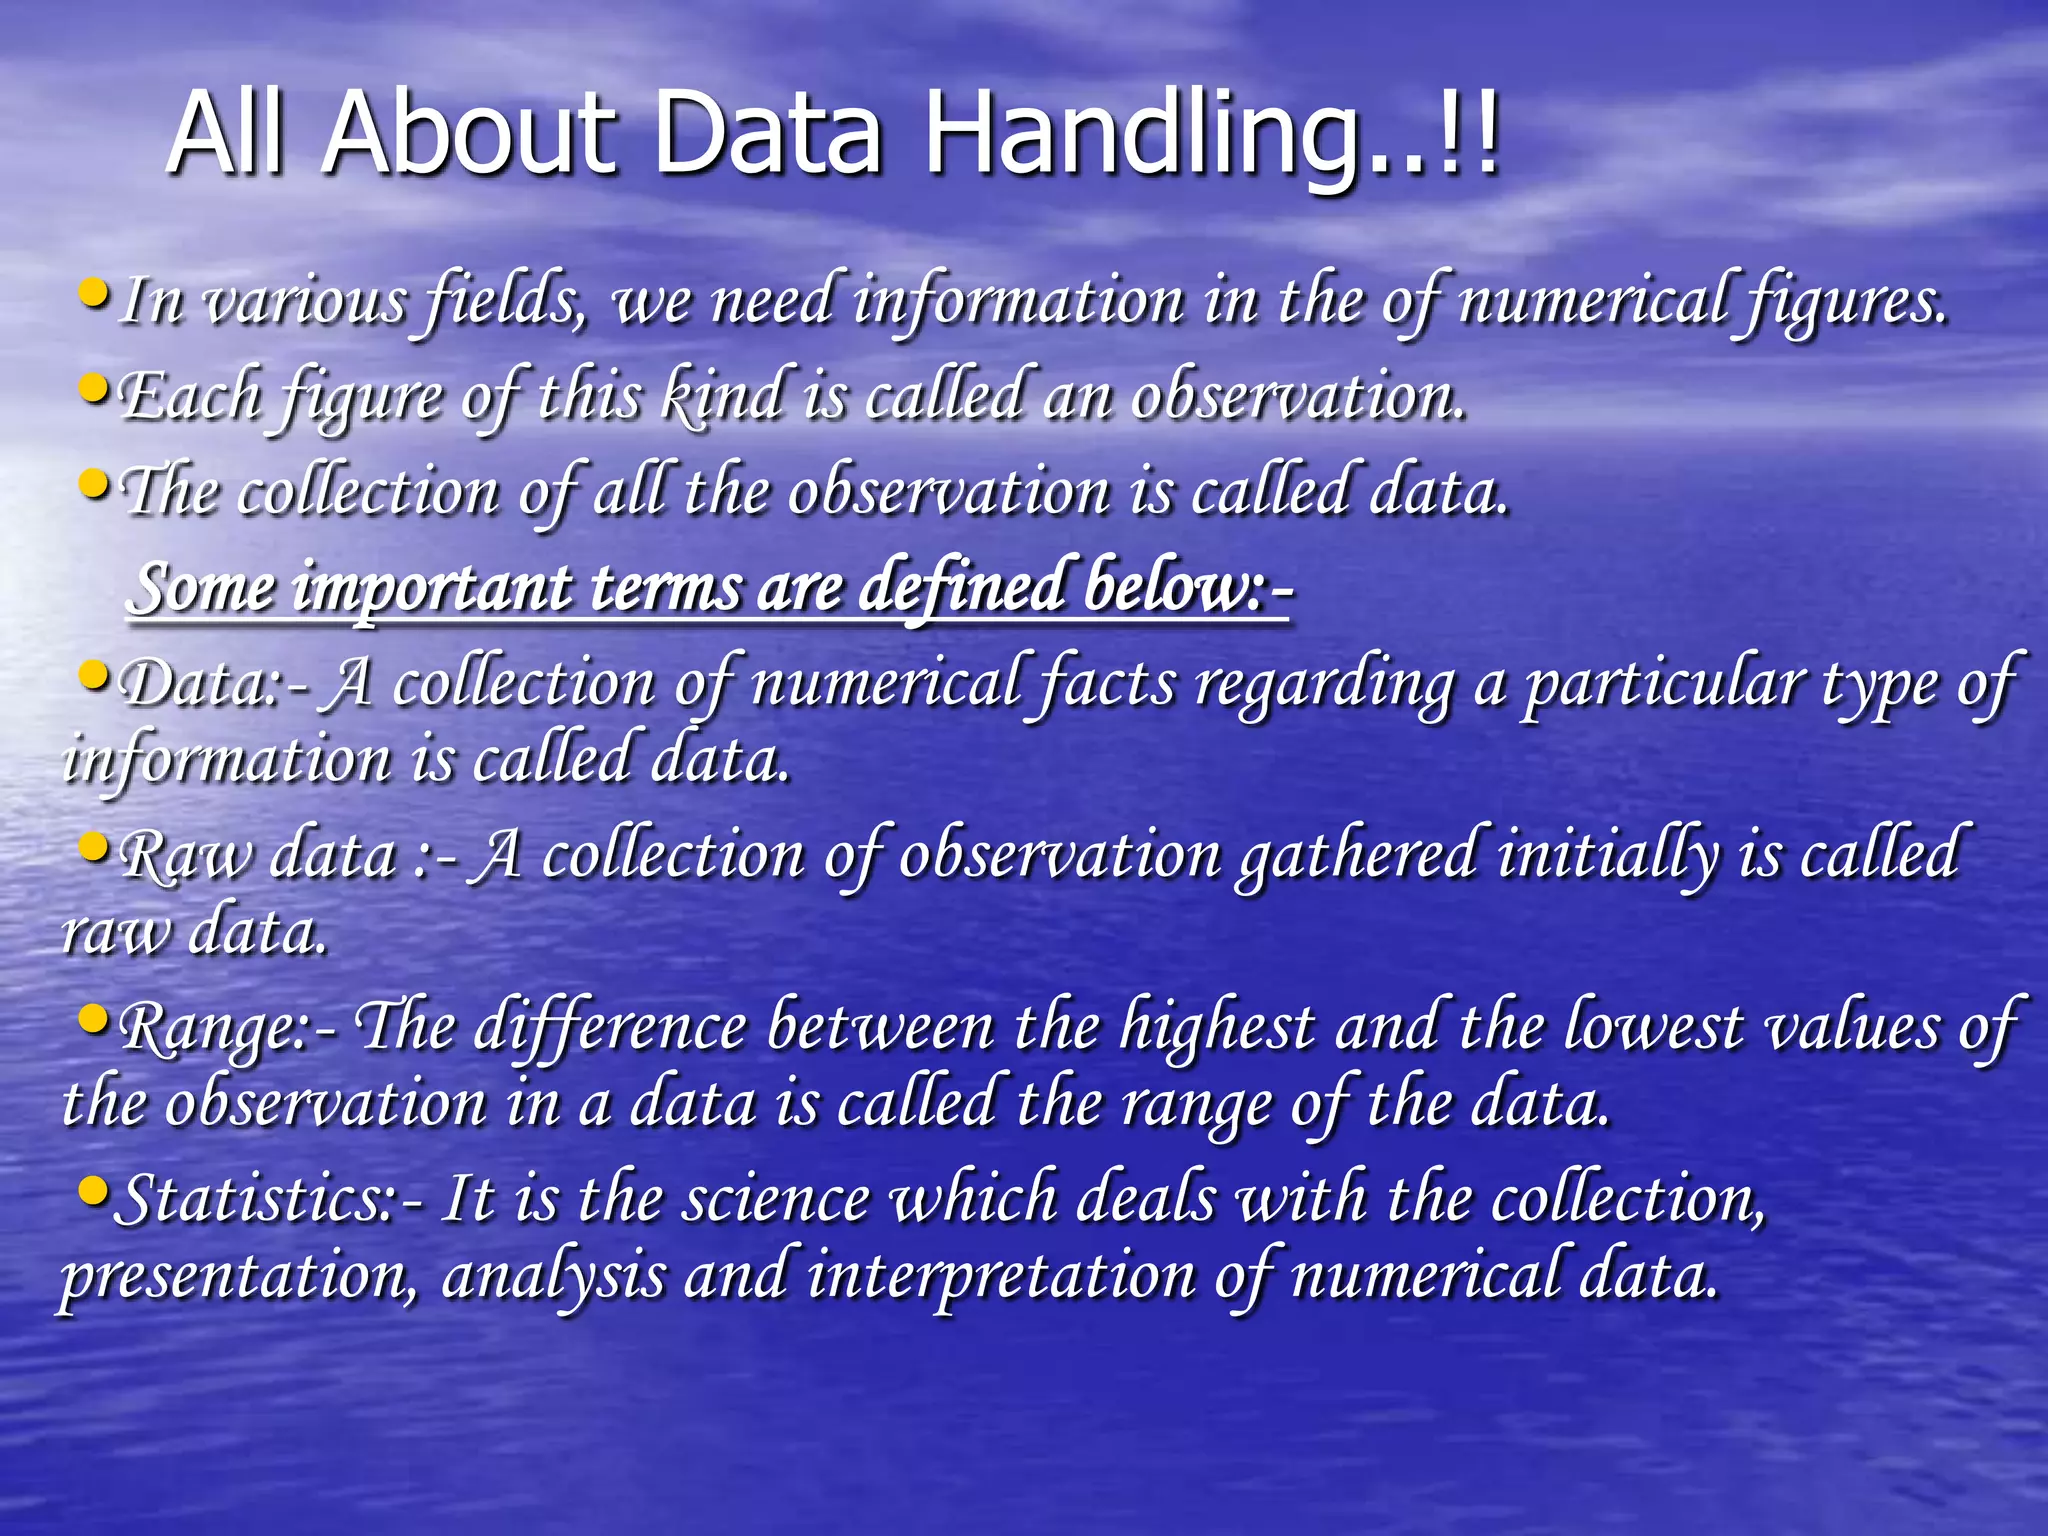
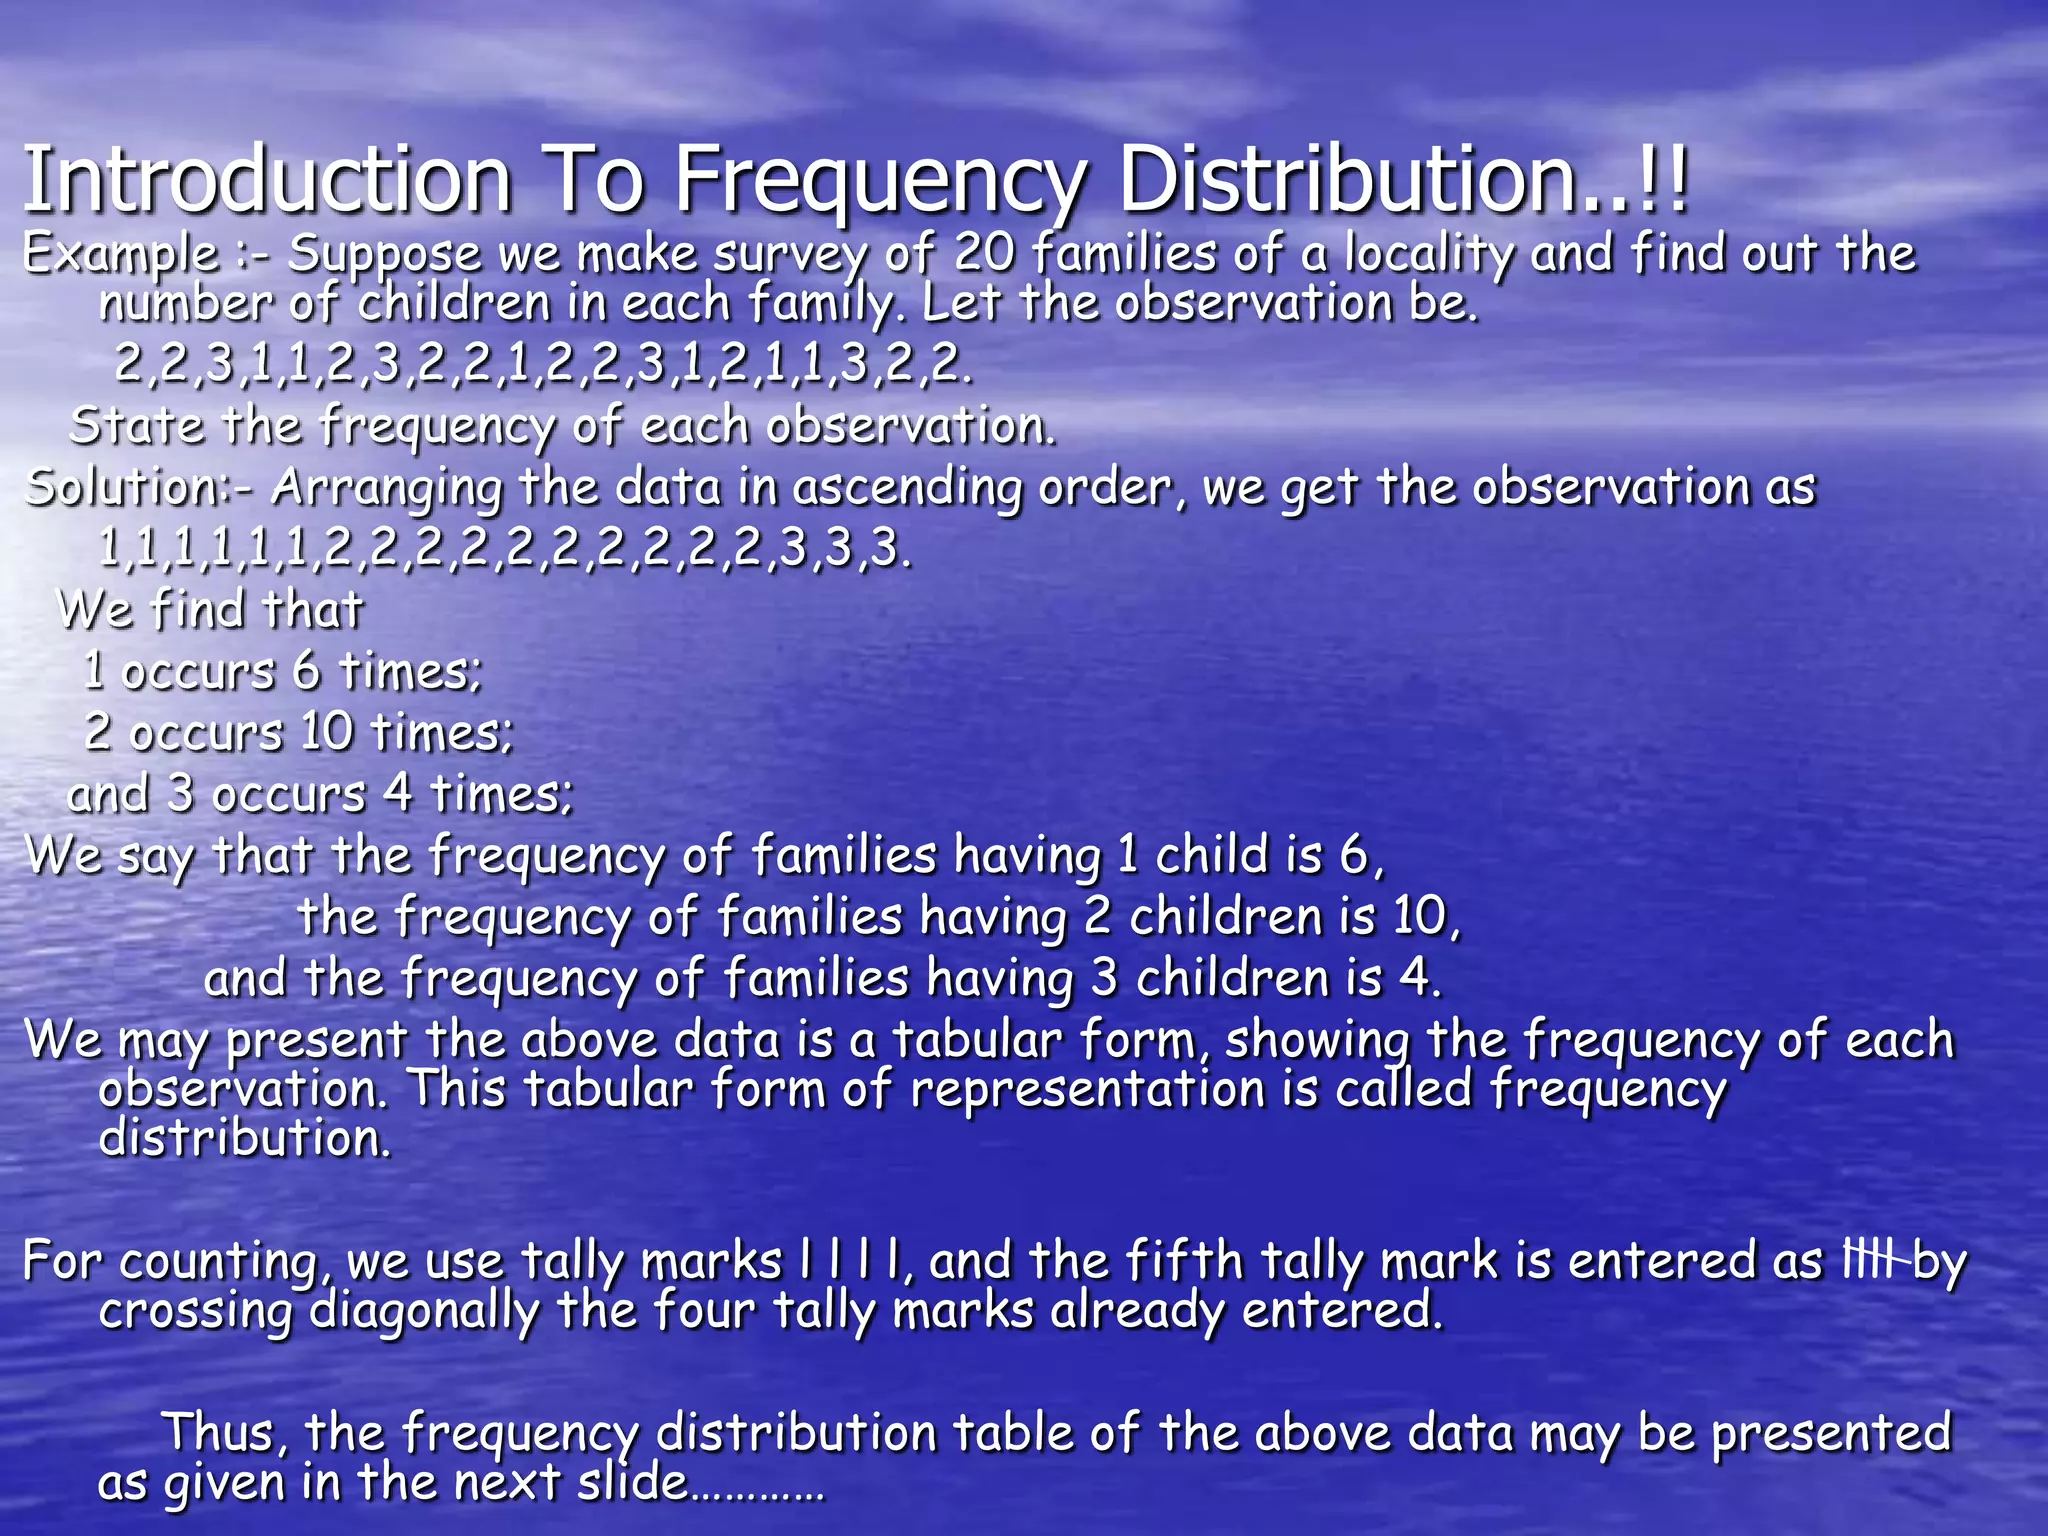
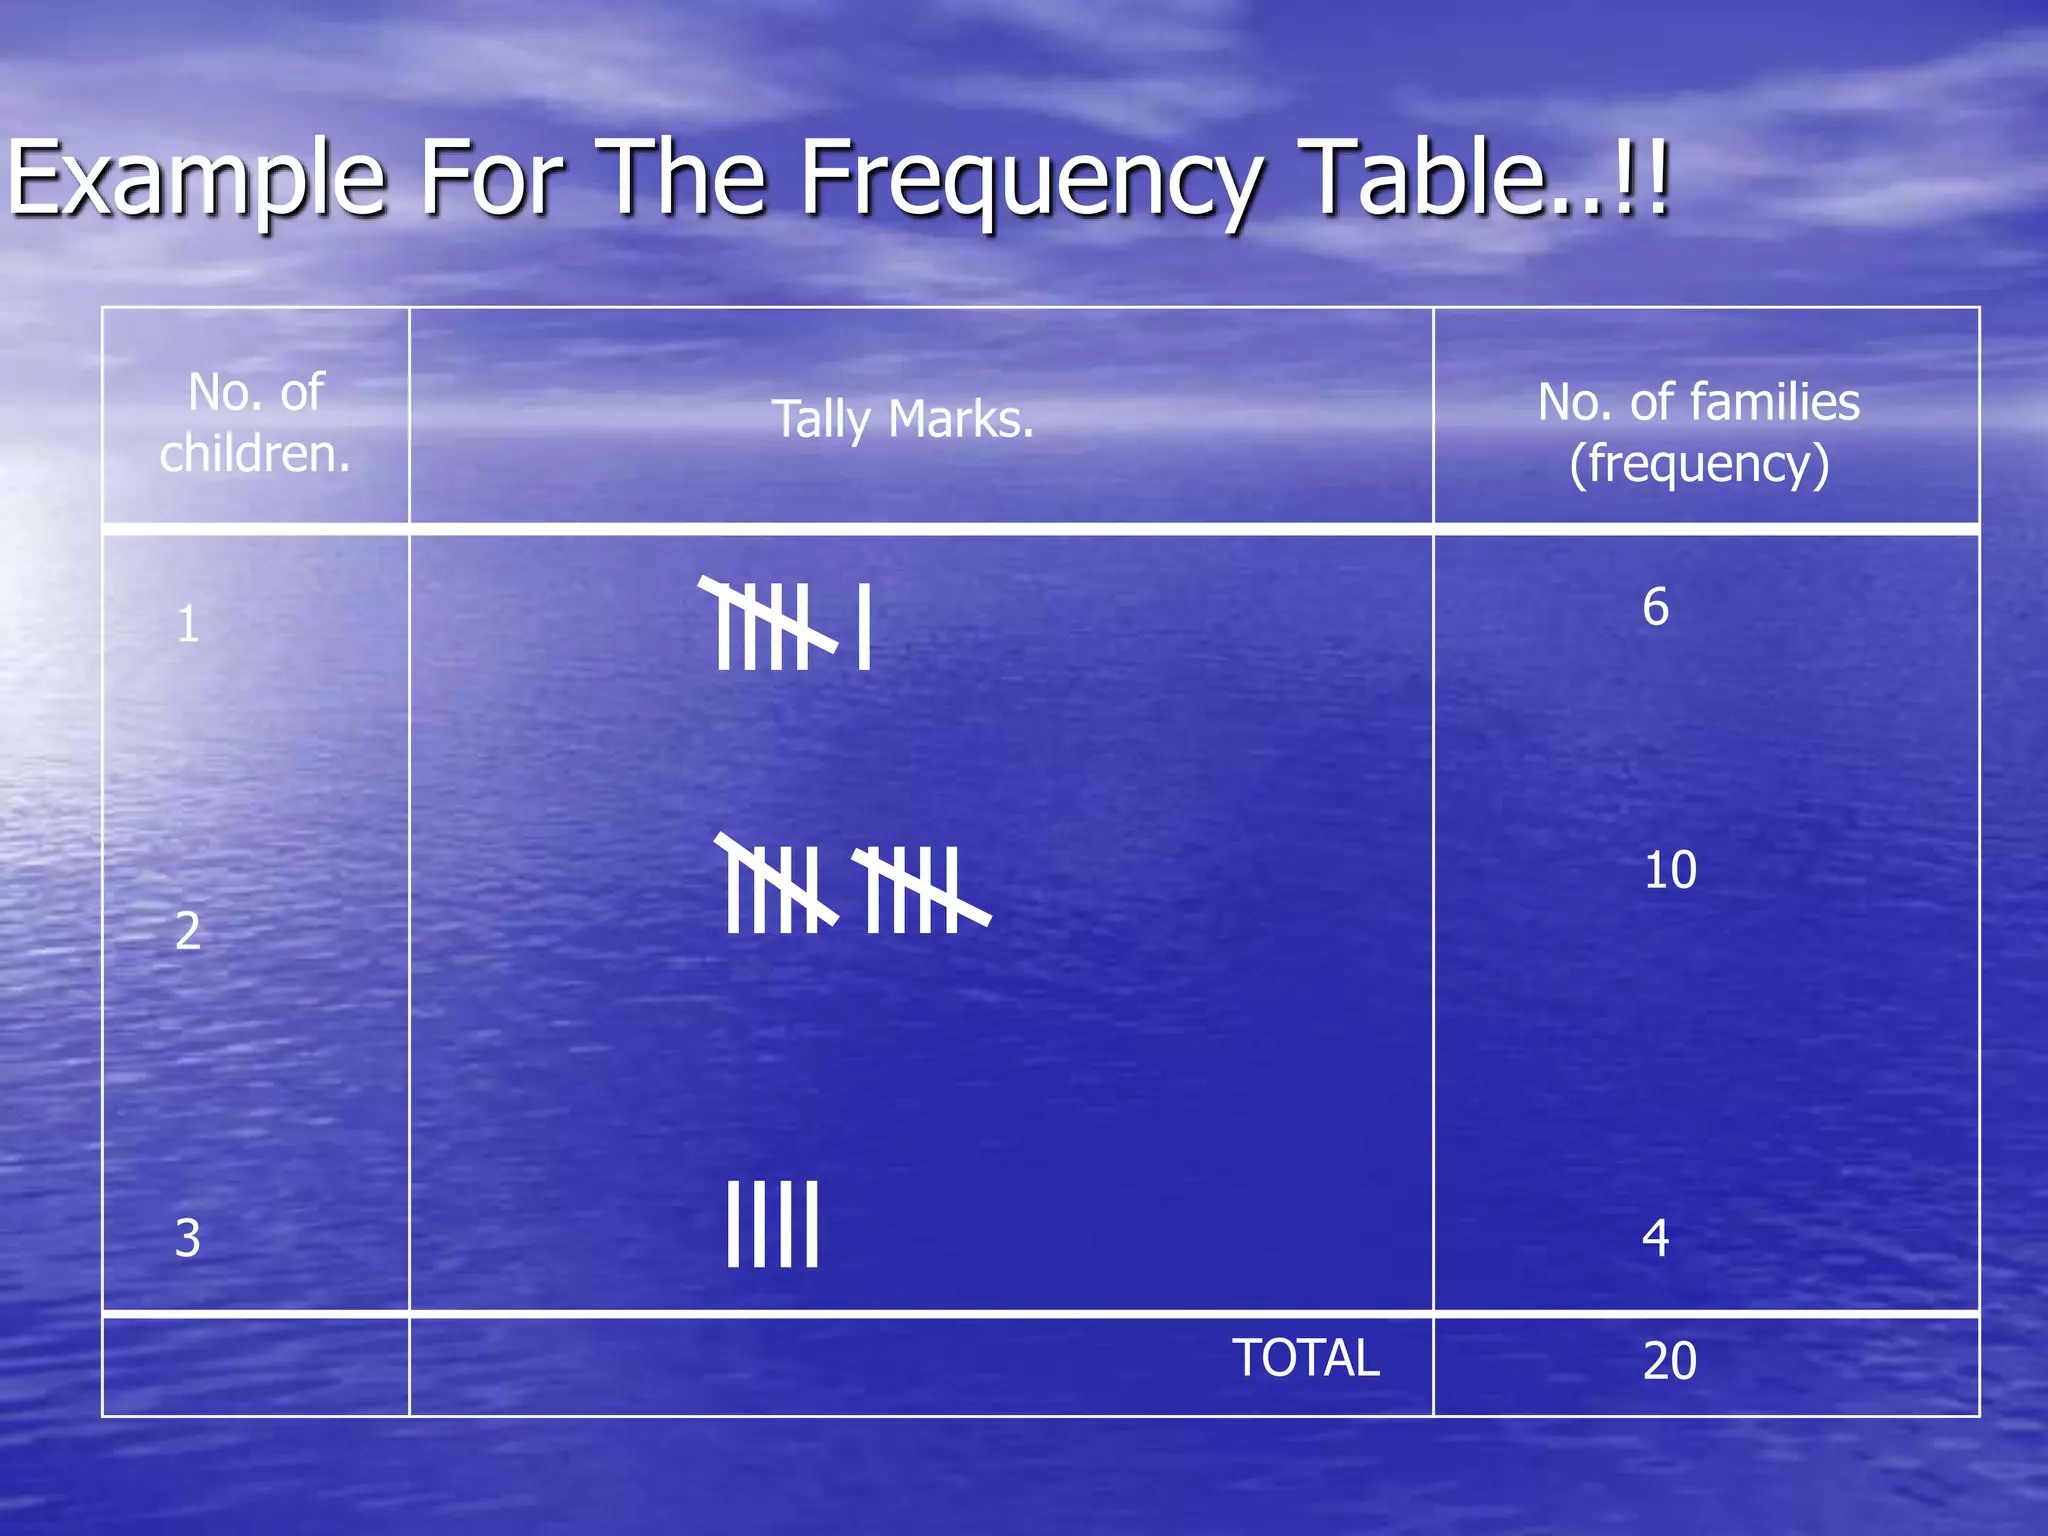
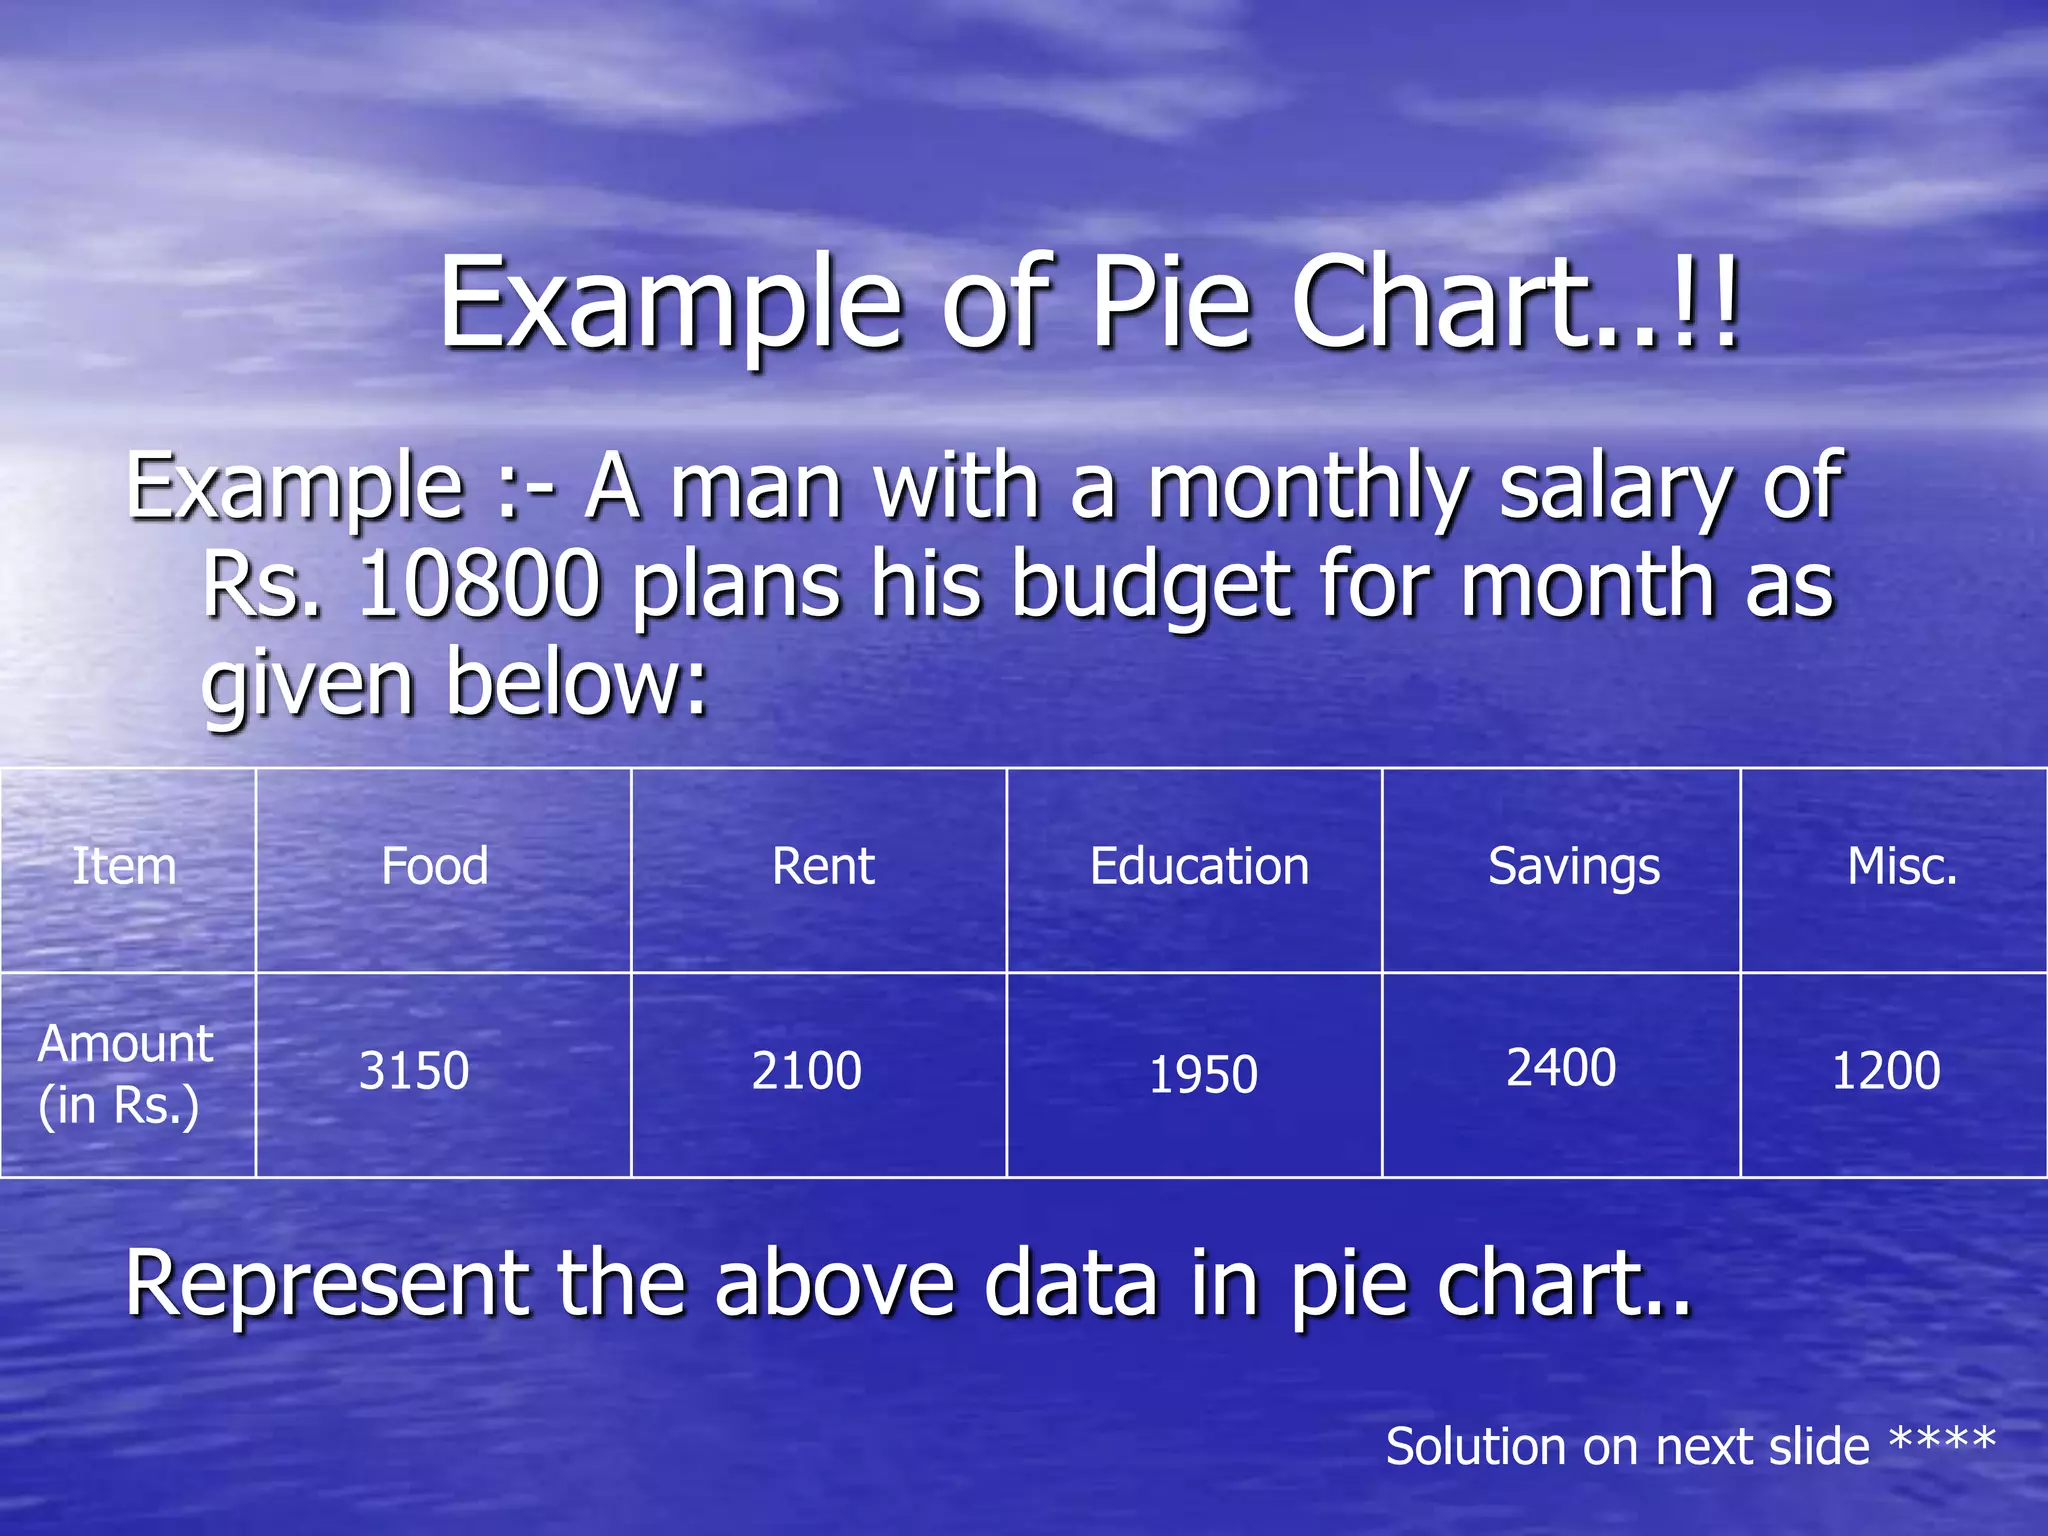
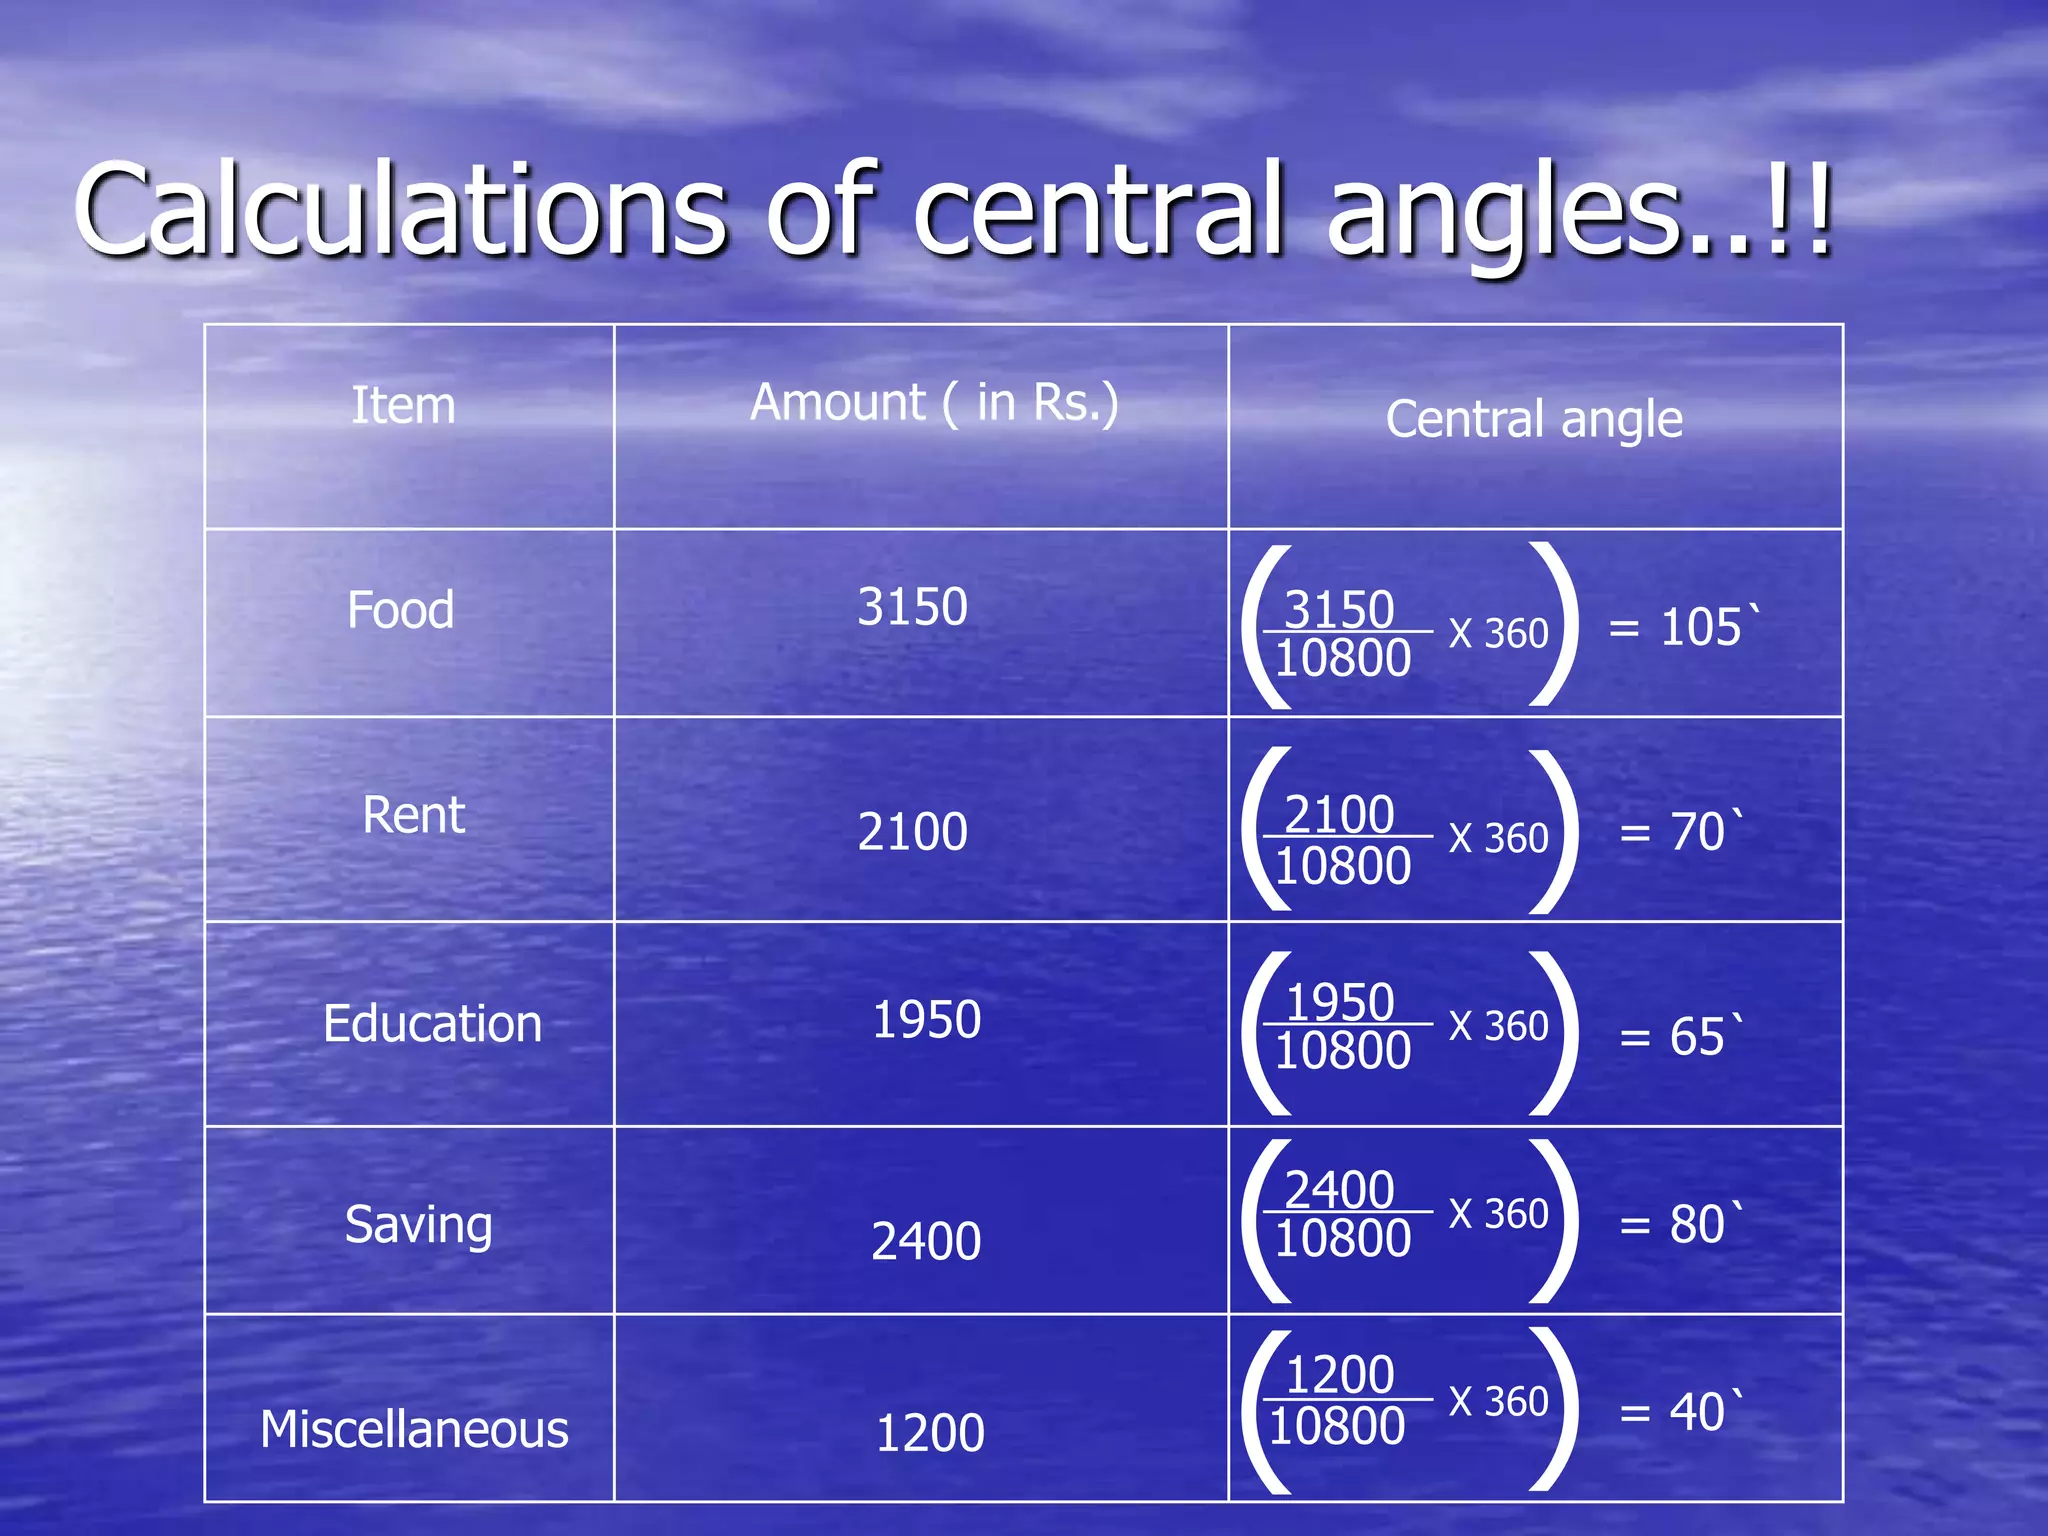
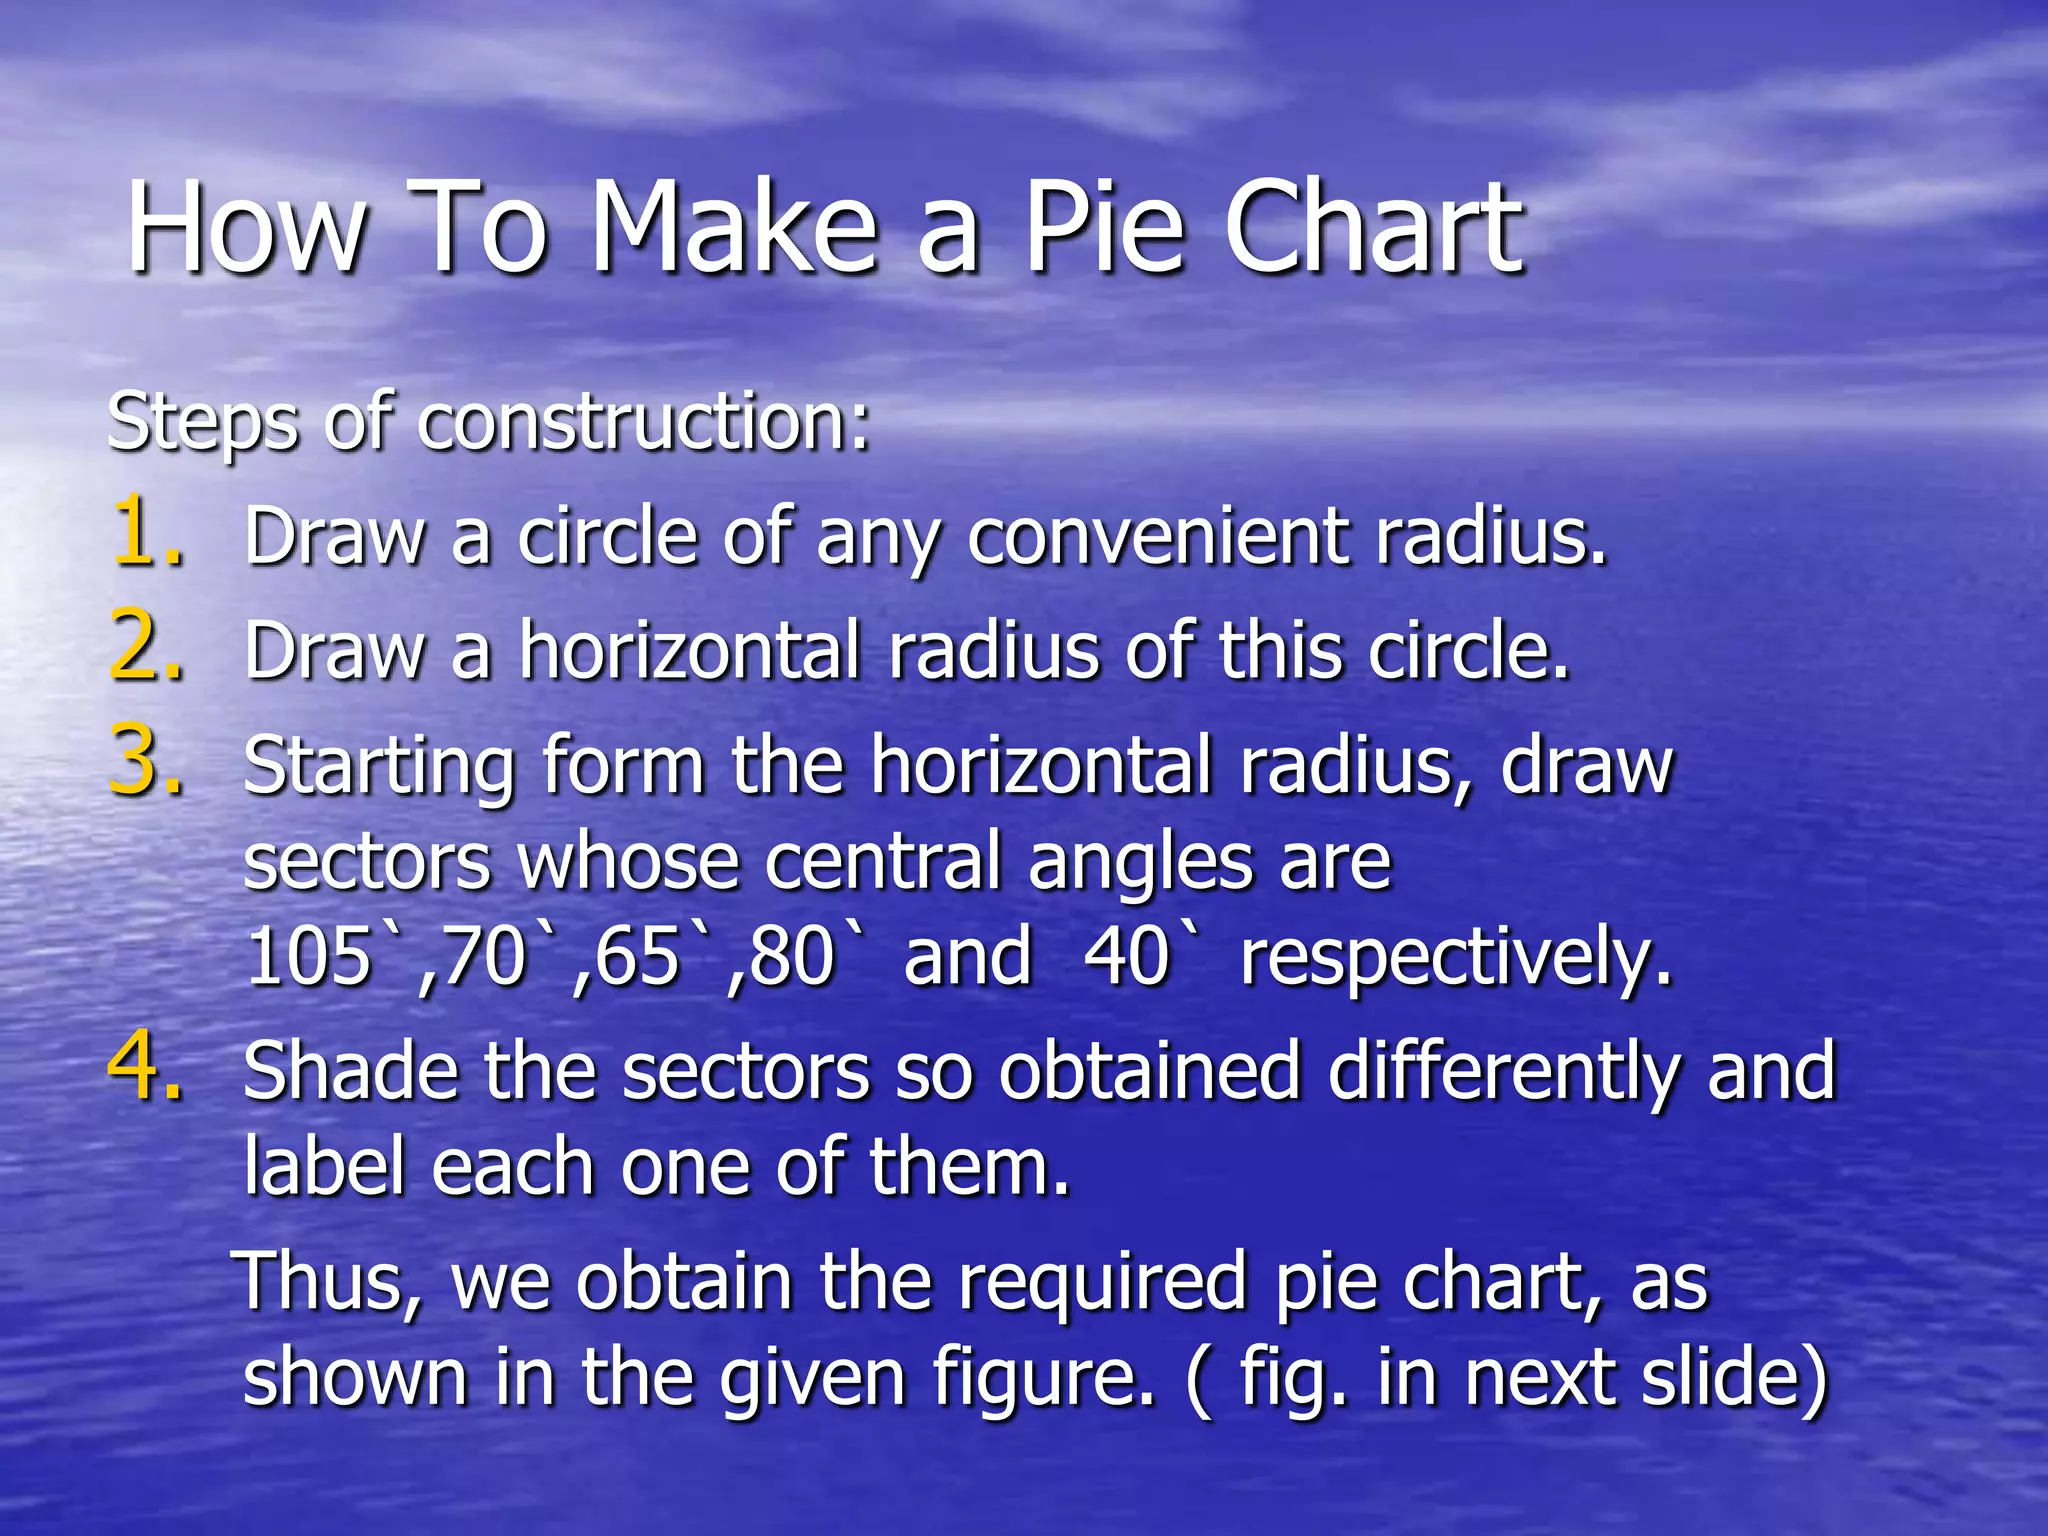
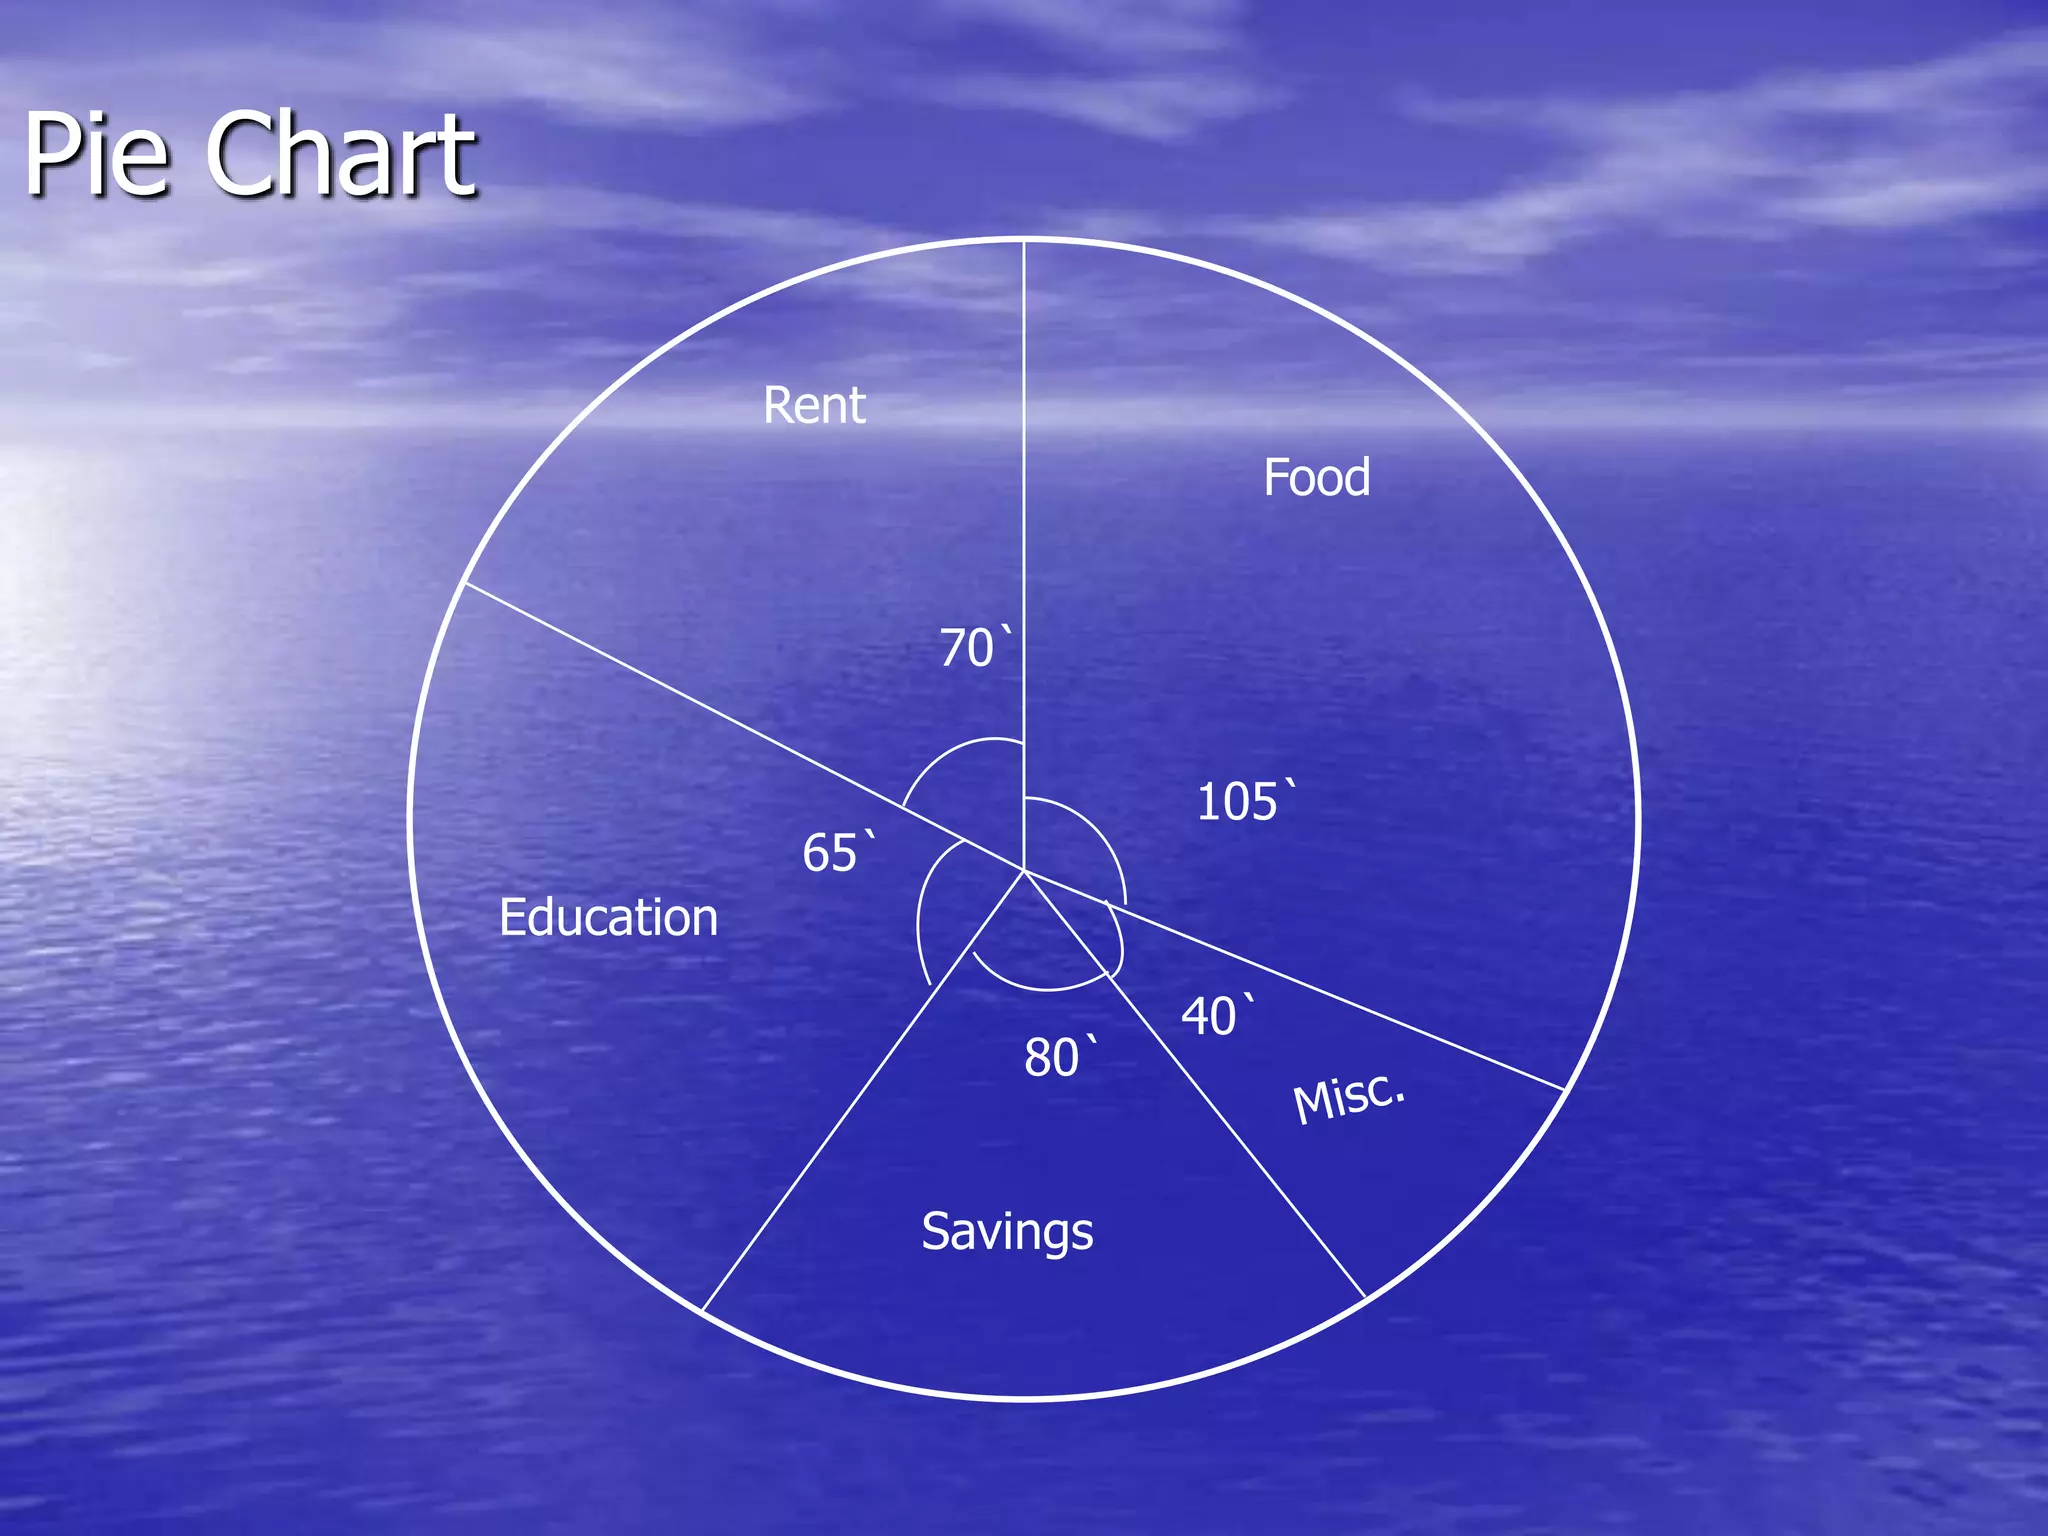


This document provides information about data handling and frequency distribution. It discusses how raw data is collected and organized into a frequency distribution table showing how often each observation occurs. An example is given of a survey counting the number of children in 20 families. The observations of 1, 2, and 3 children are tabulated along with their frequencies of 6, 10, and 4 respectively. The document also shows how to create a pie chart representing the monthly budget breakdown of a person with a salary of Rs. 10,800 allocated to food, rent, education, savings, and miscellaneous amounts.