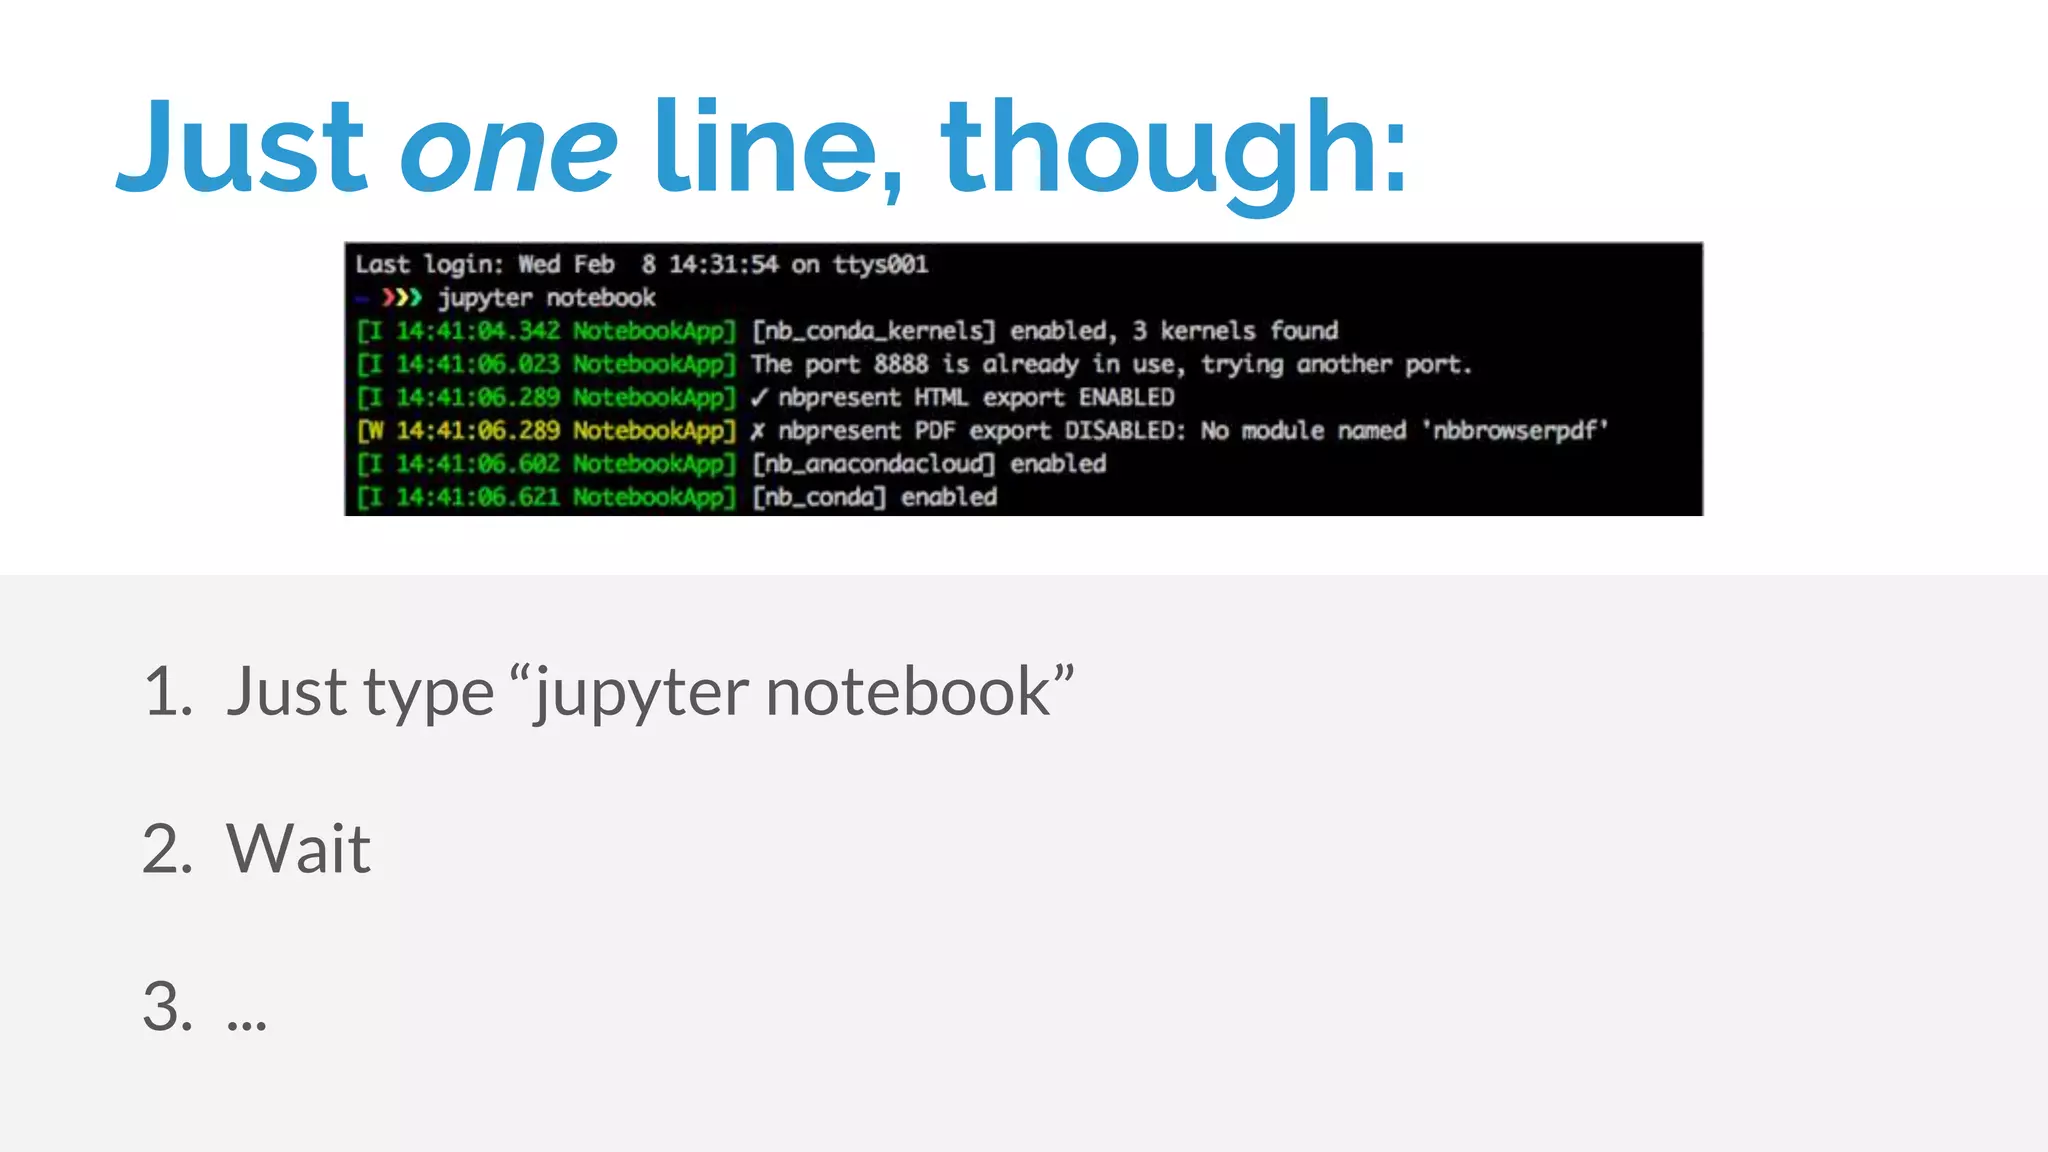
Download to read offline


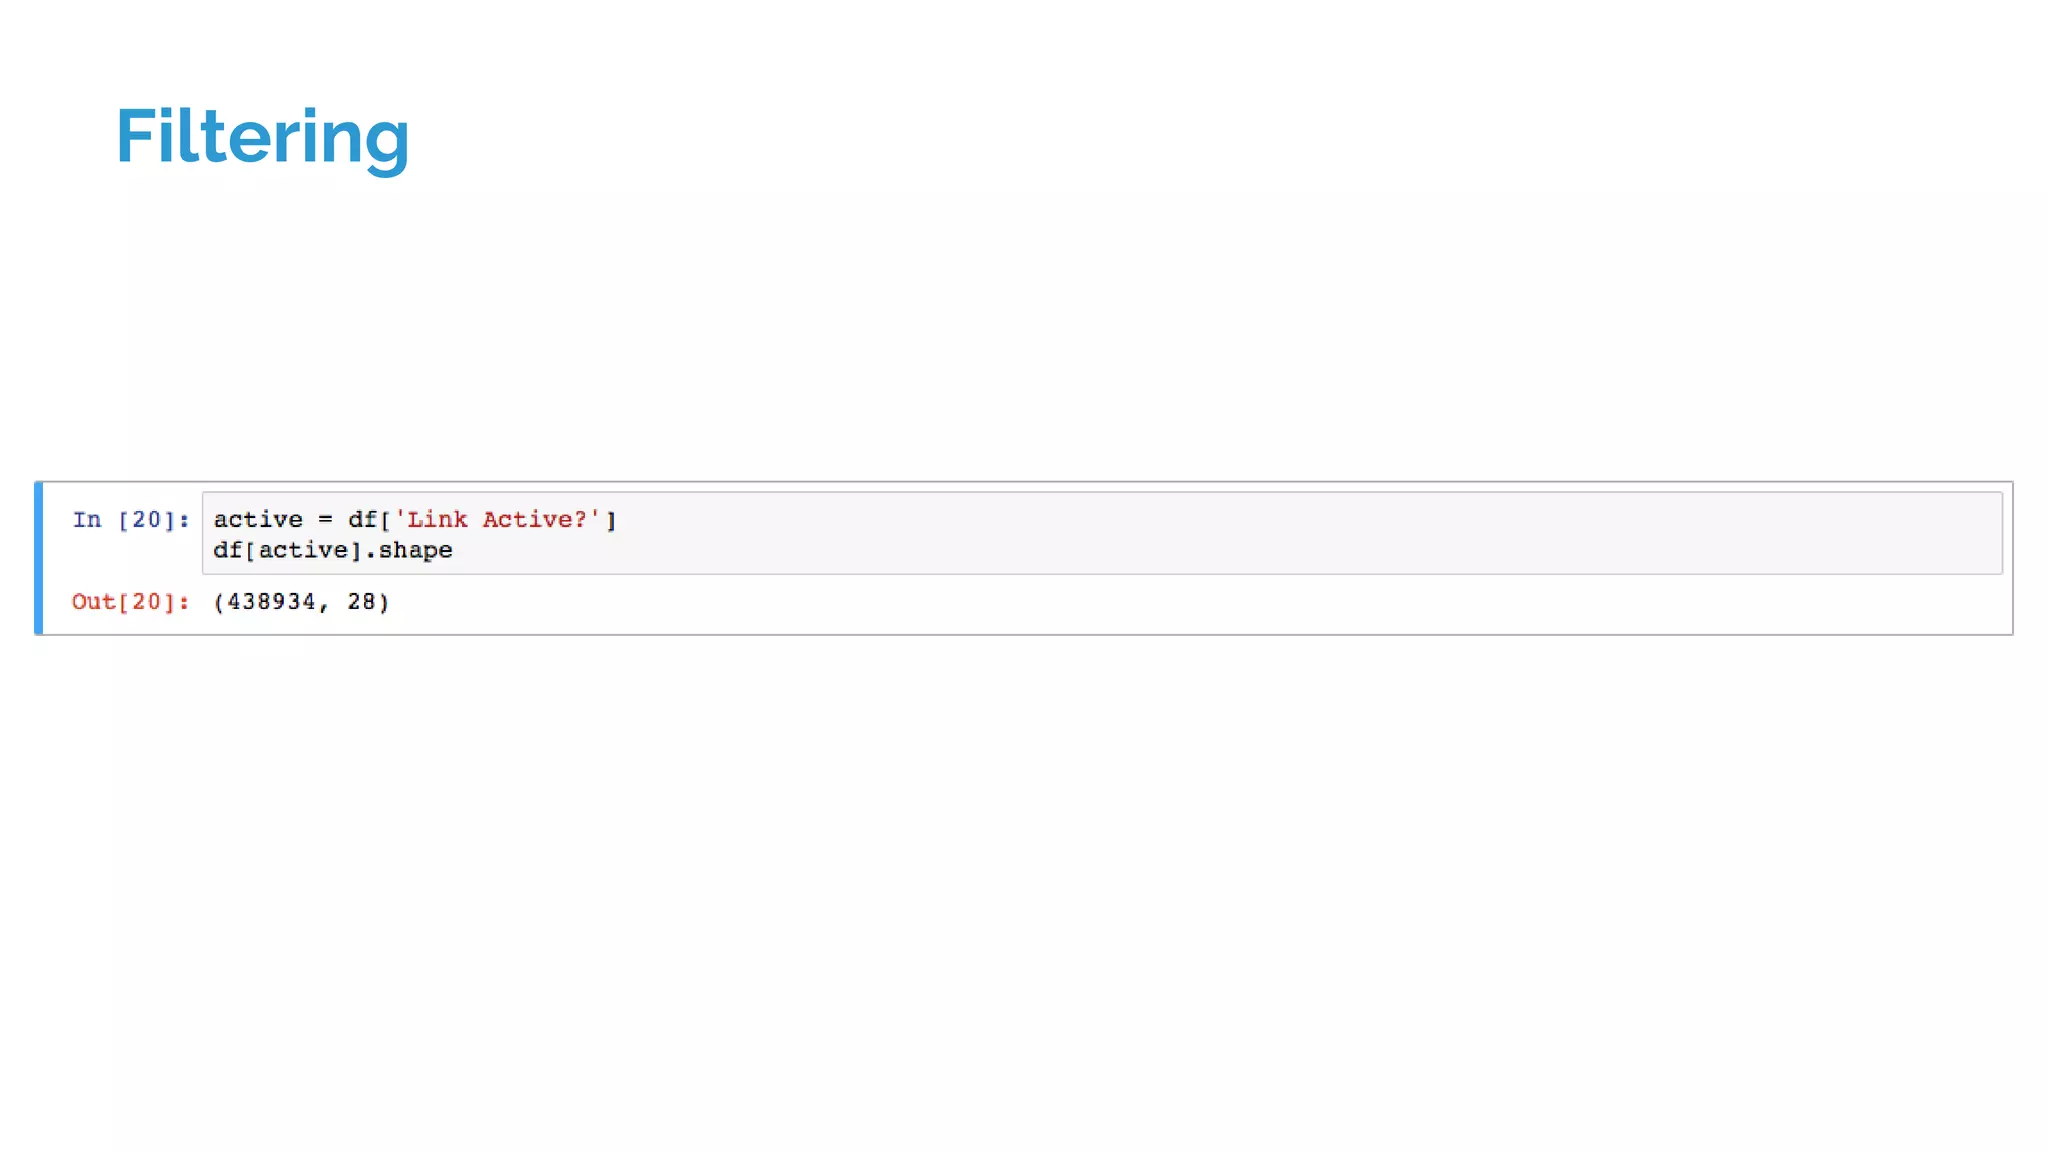
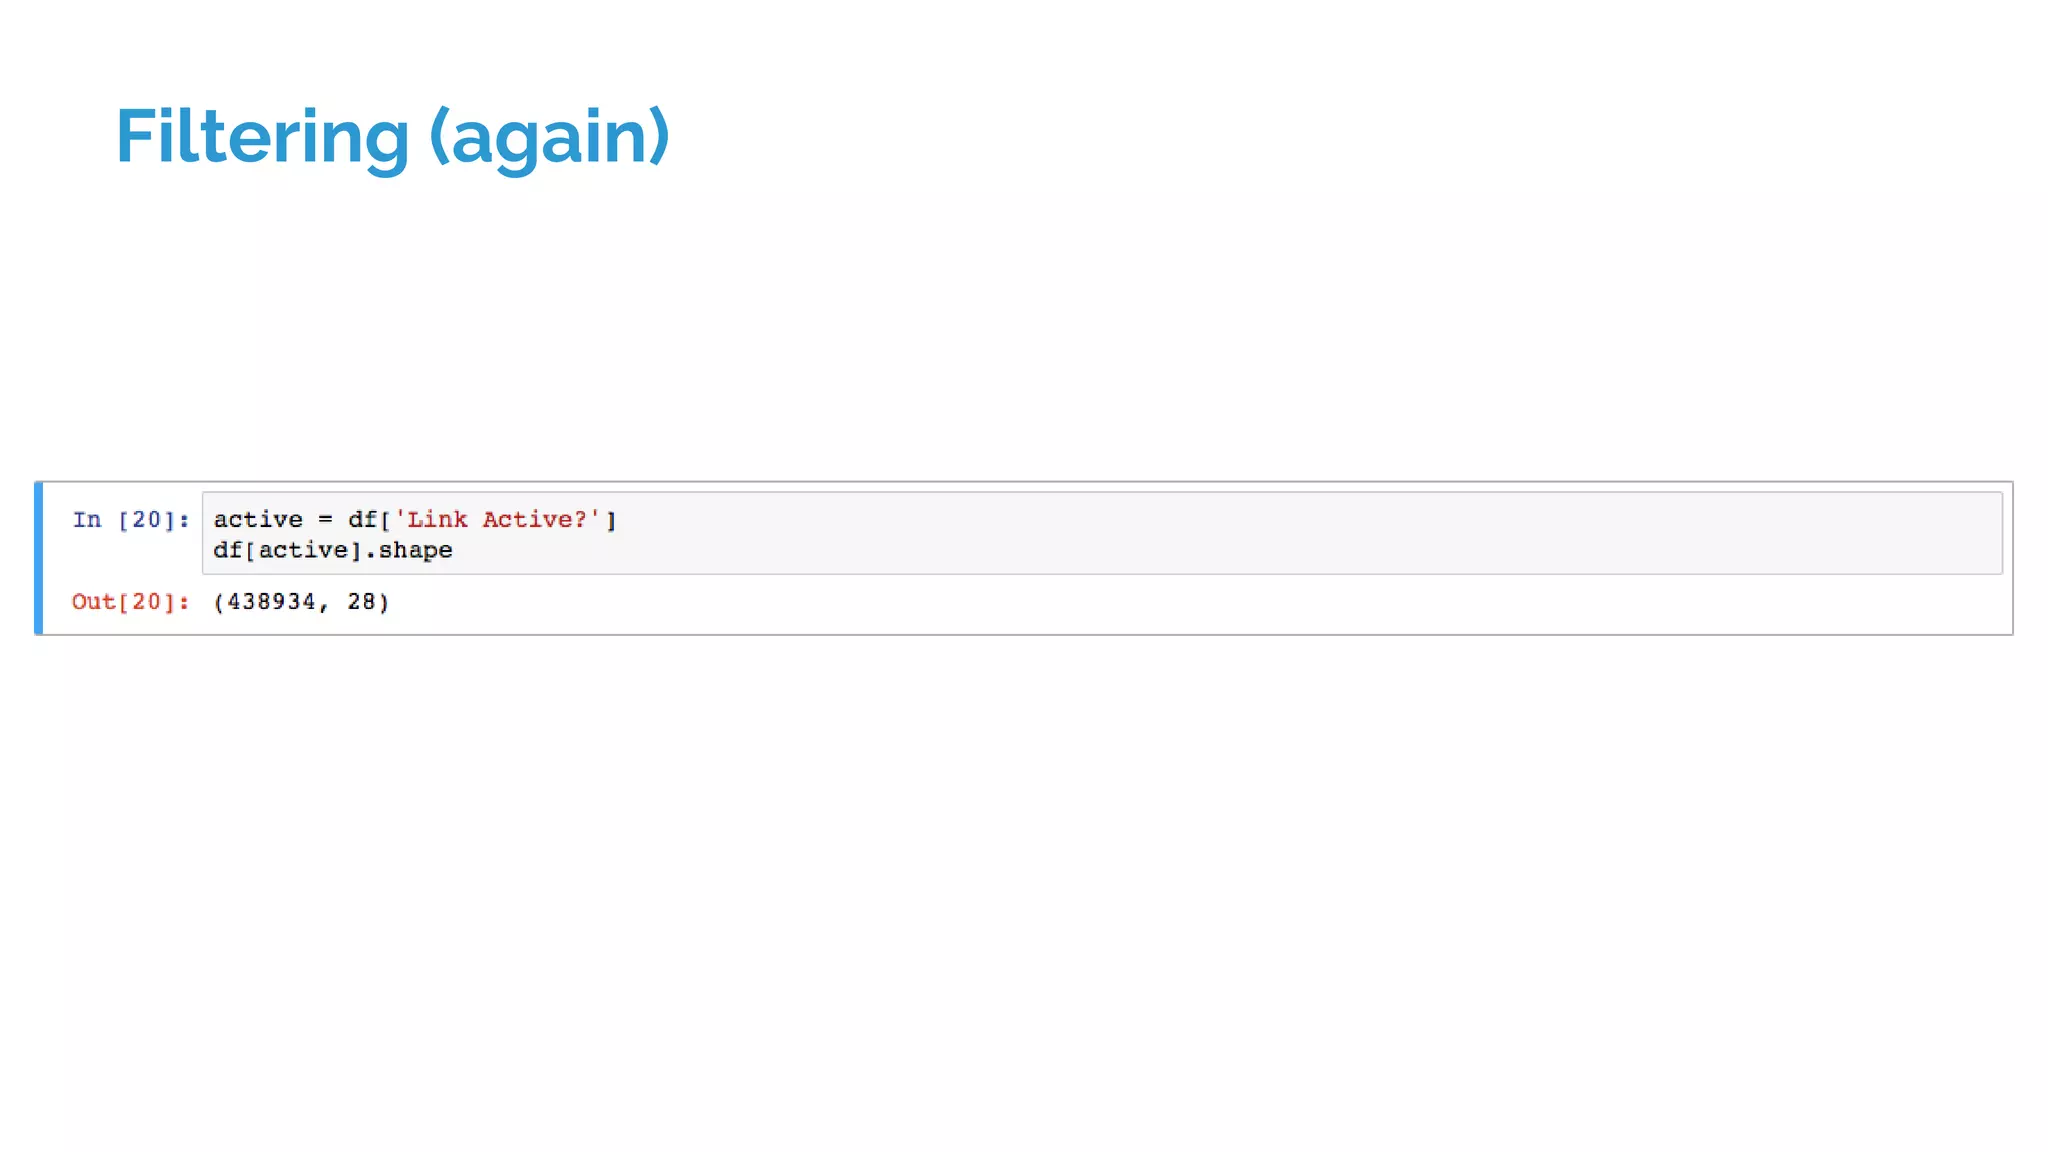
![What’s happening there?
df[‘Link Active?’] is:
1. Checking that whole column for values that are True or
False
2. Returning an array of True/False values
3. This is fast, and lets us filter in an amazing variety of ways](https://image.slidesharecdn.com/dataanalysiswithpandas-170222103623/75/Data-analysis-with-pandas-34-2048.jpg)

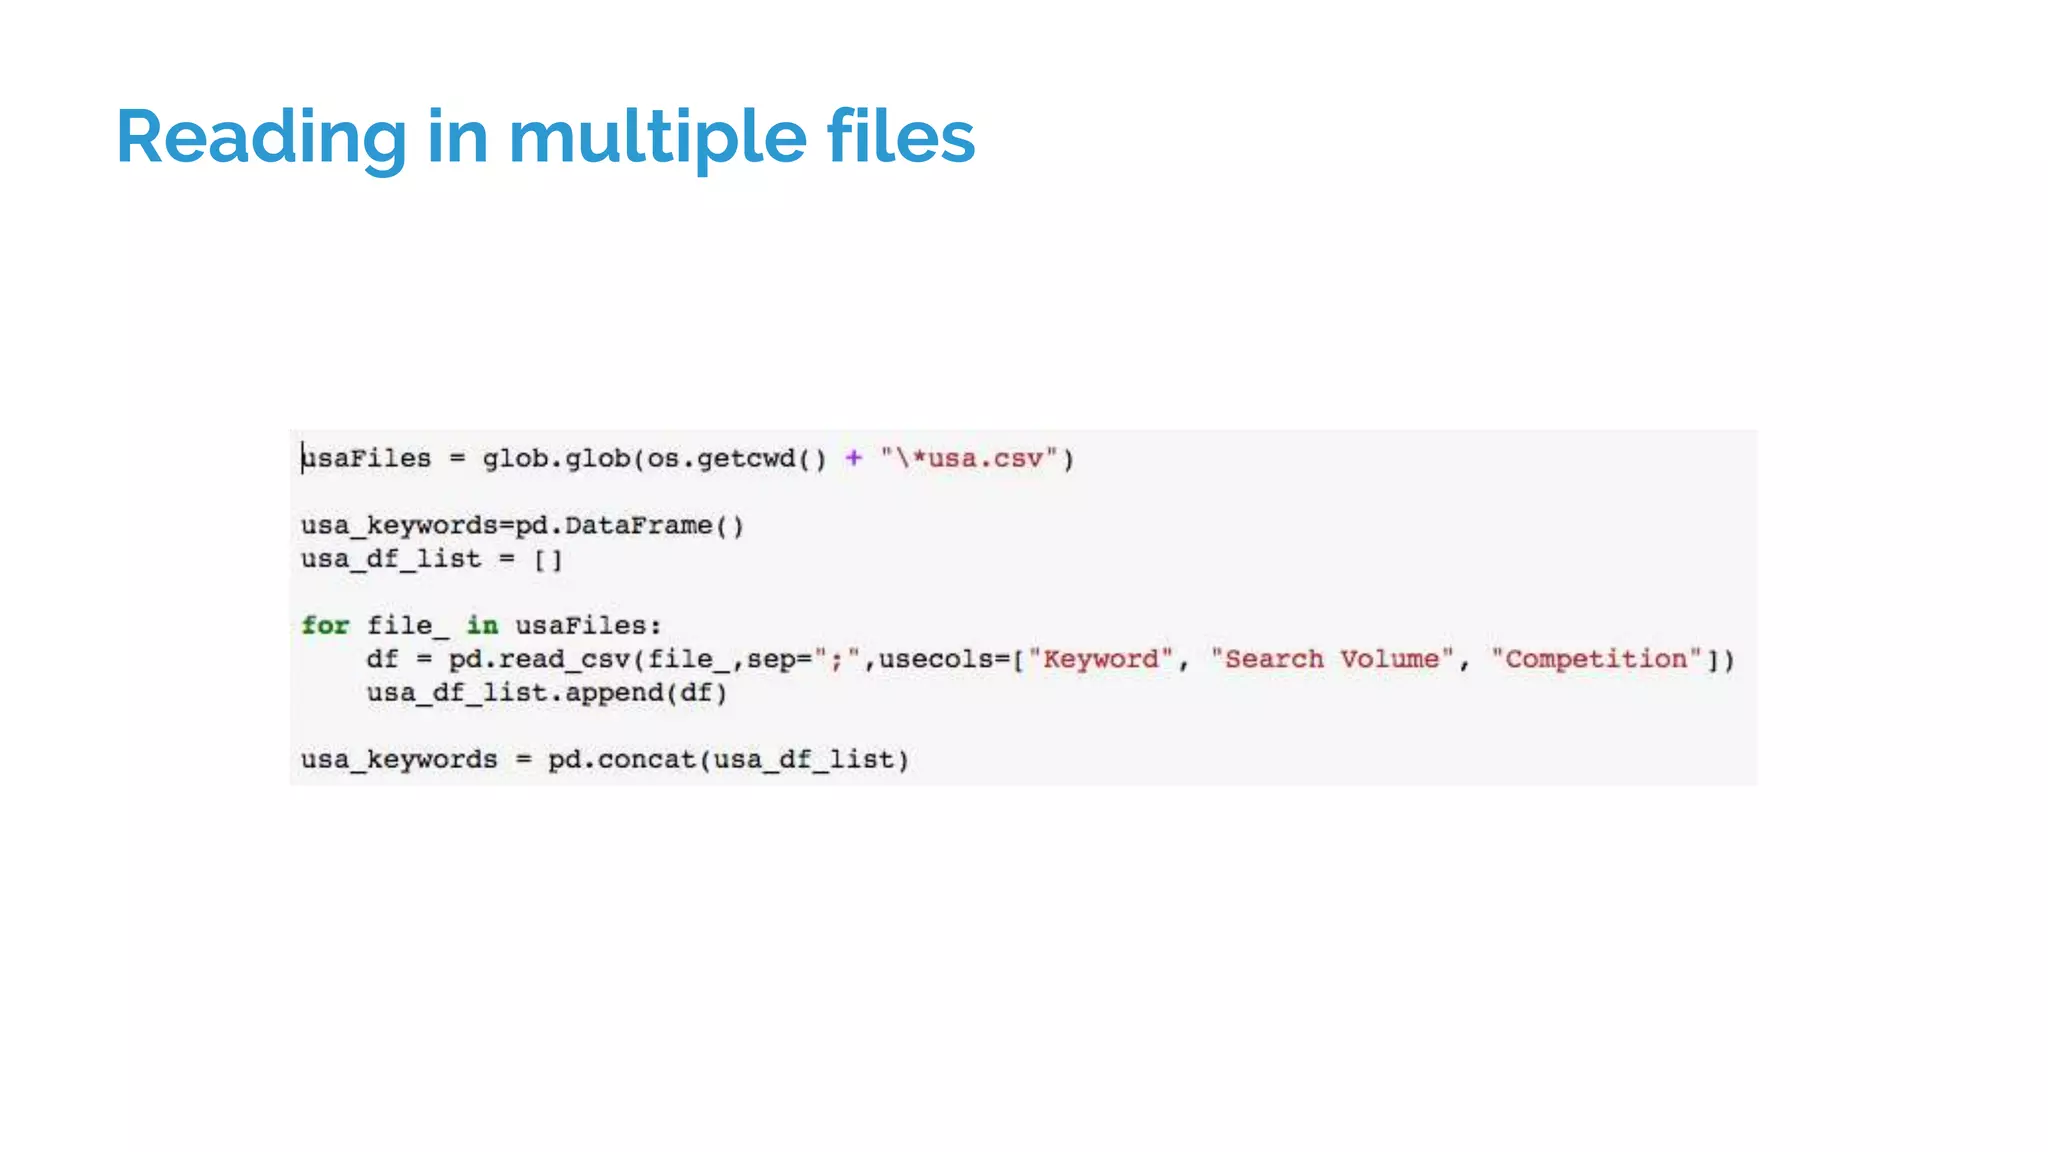
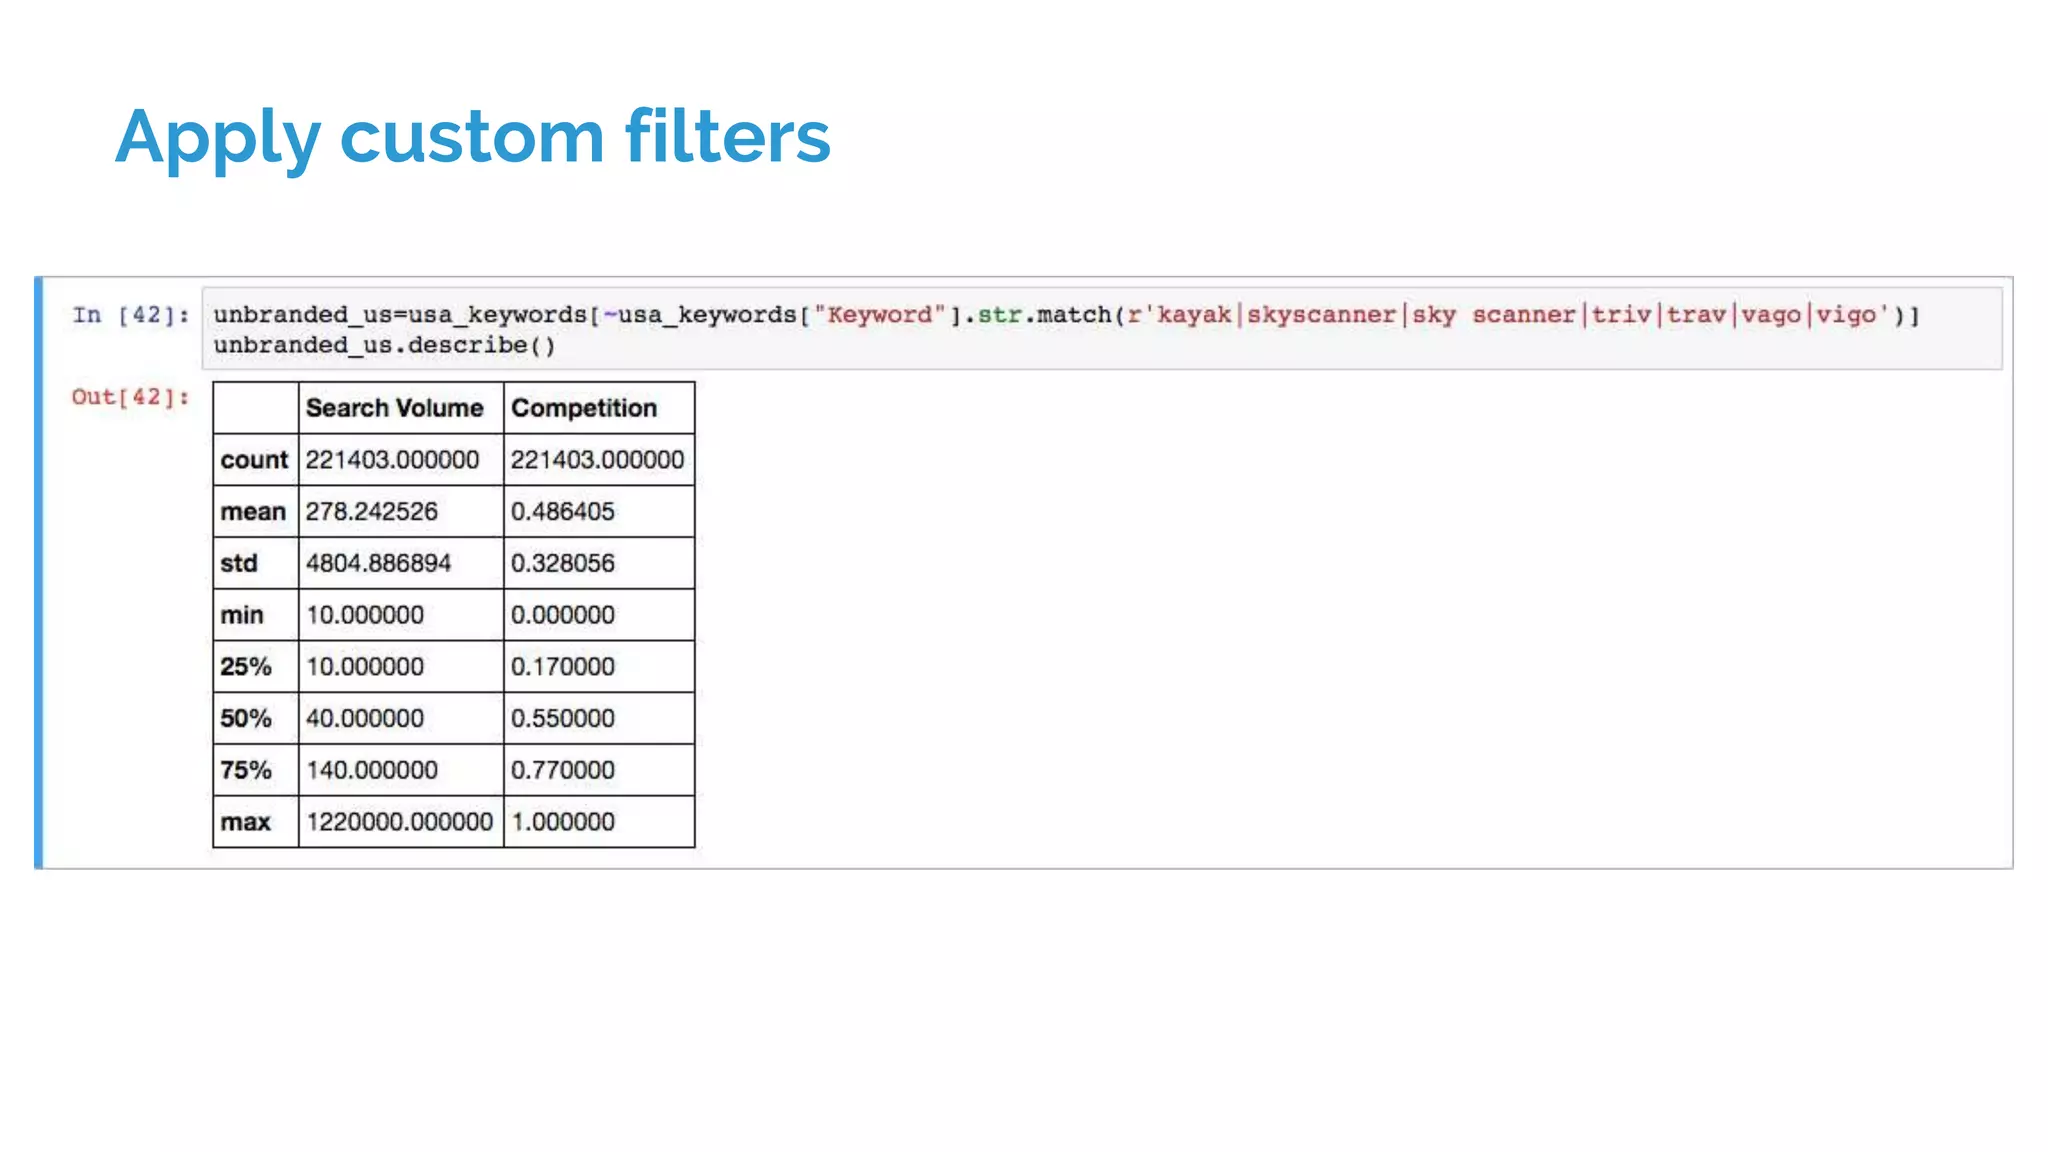
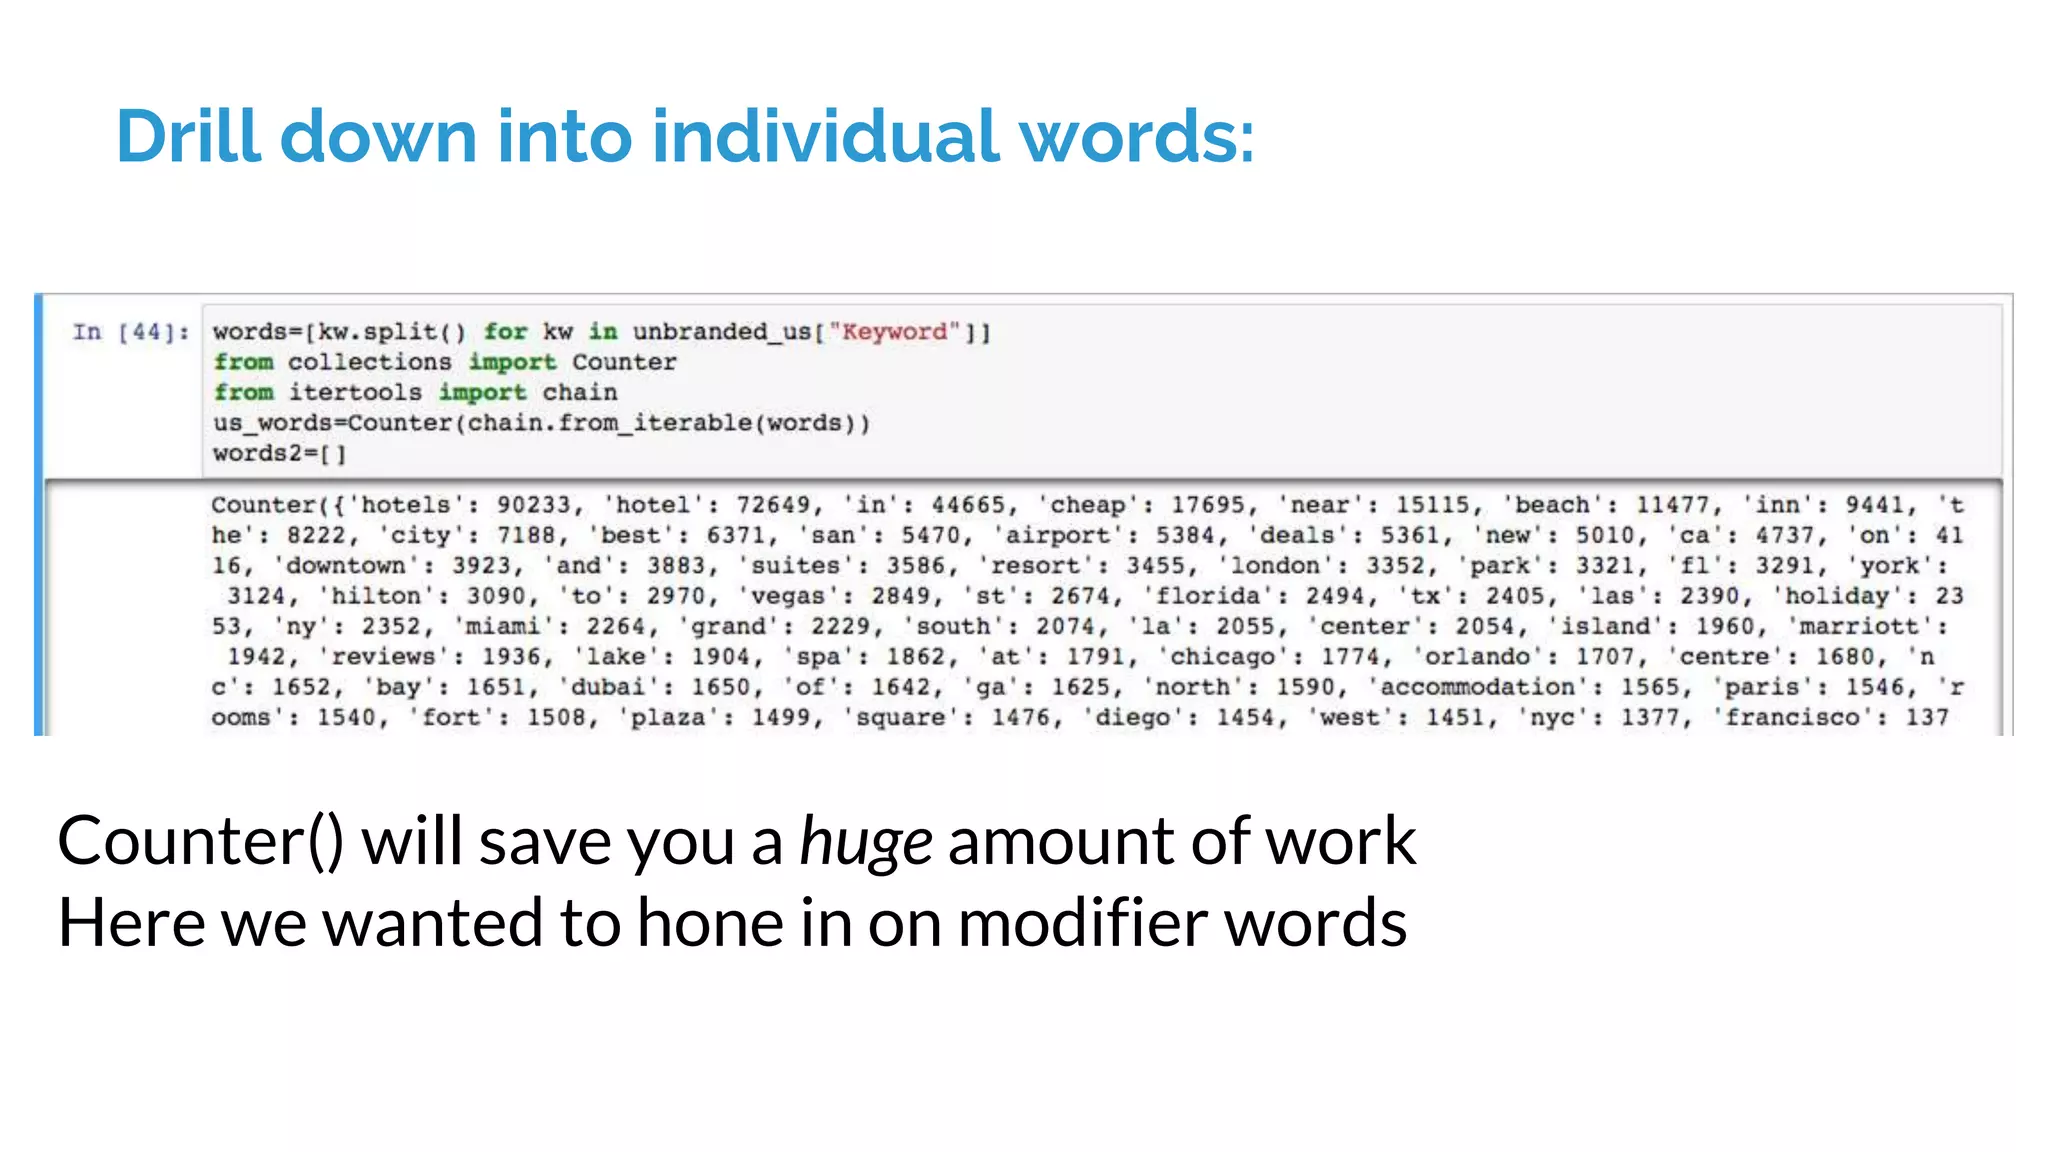
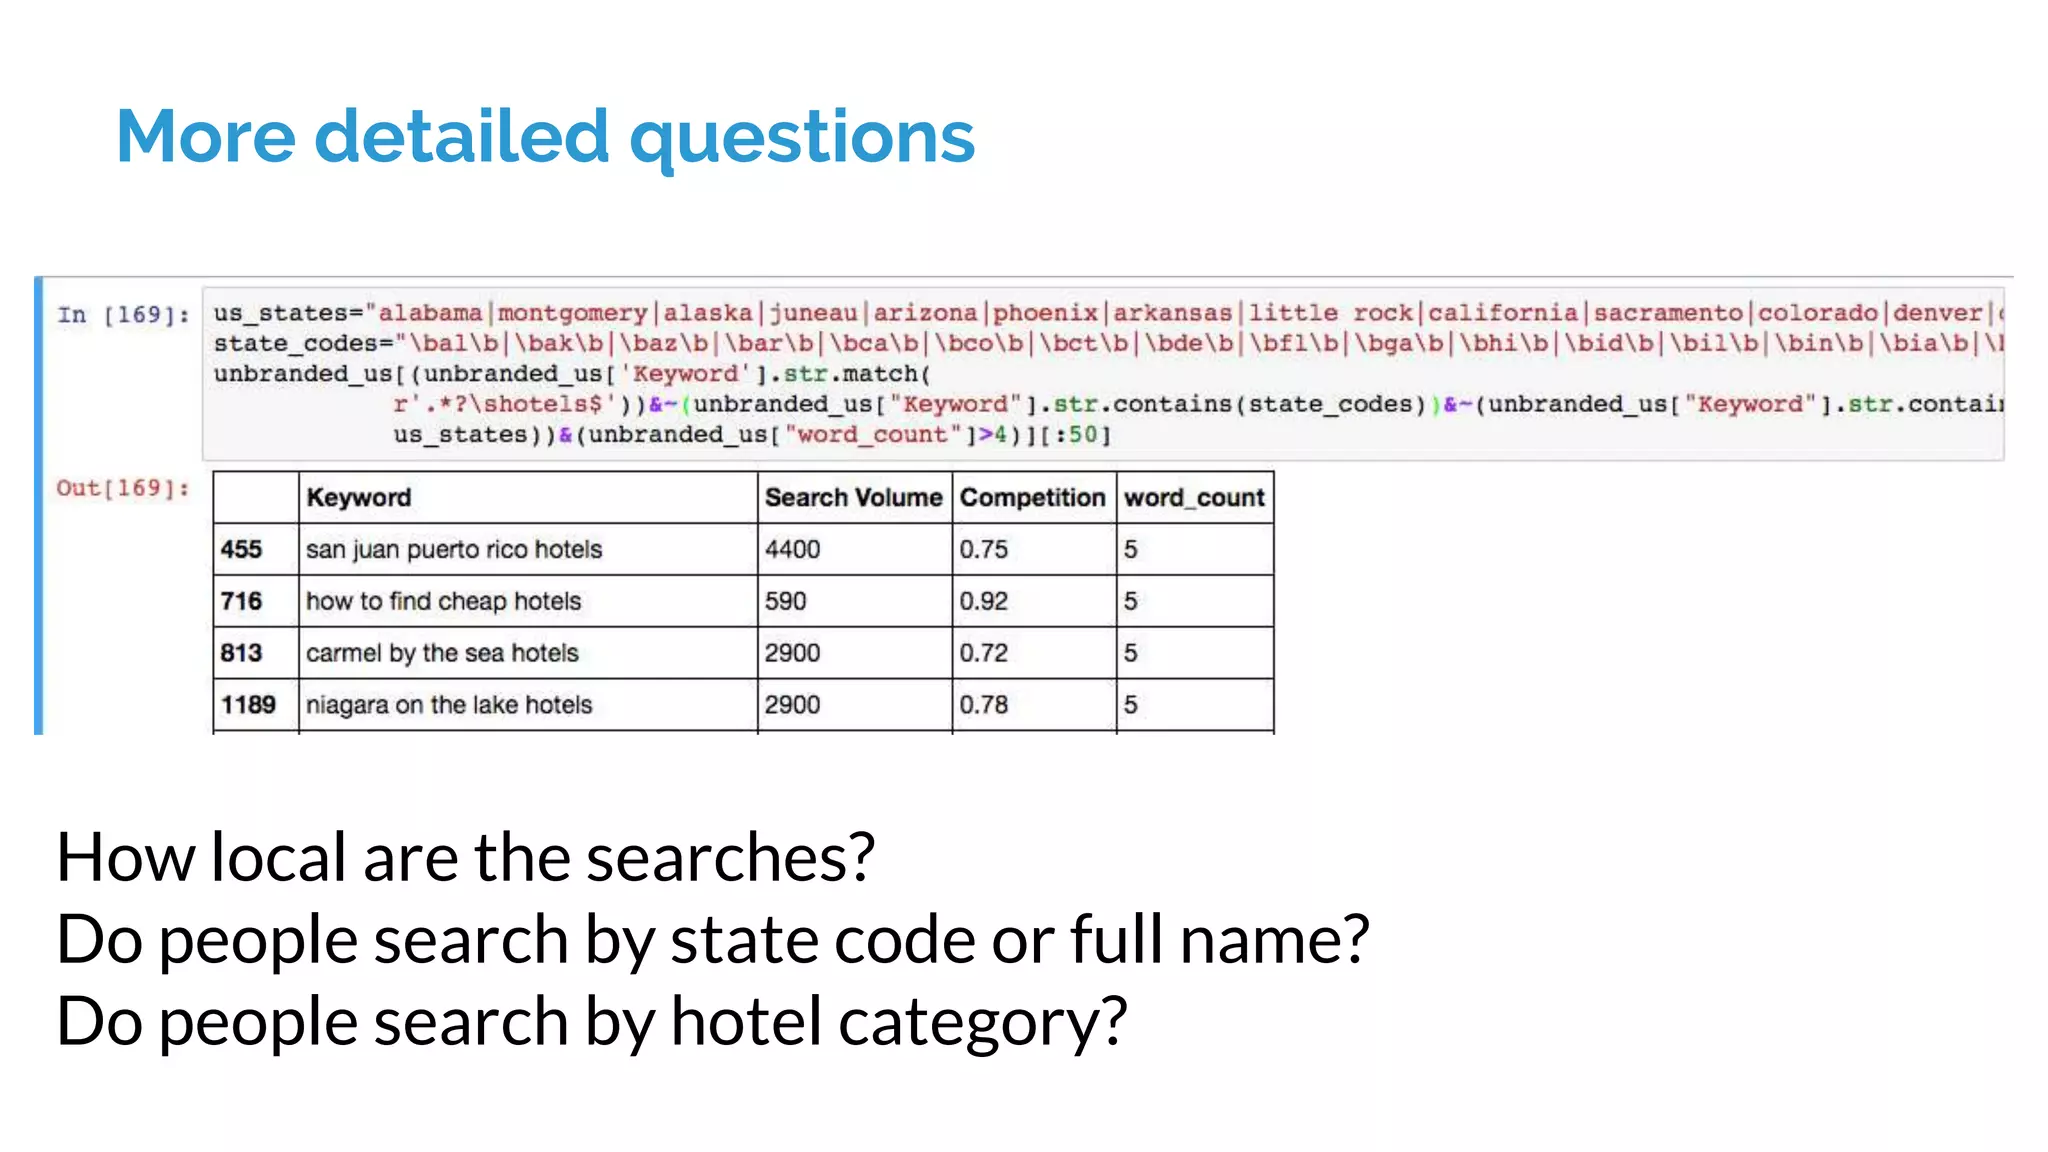


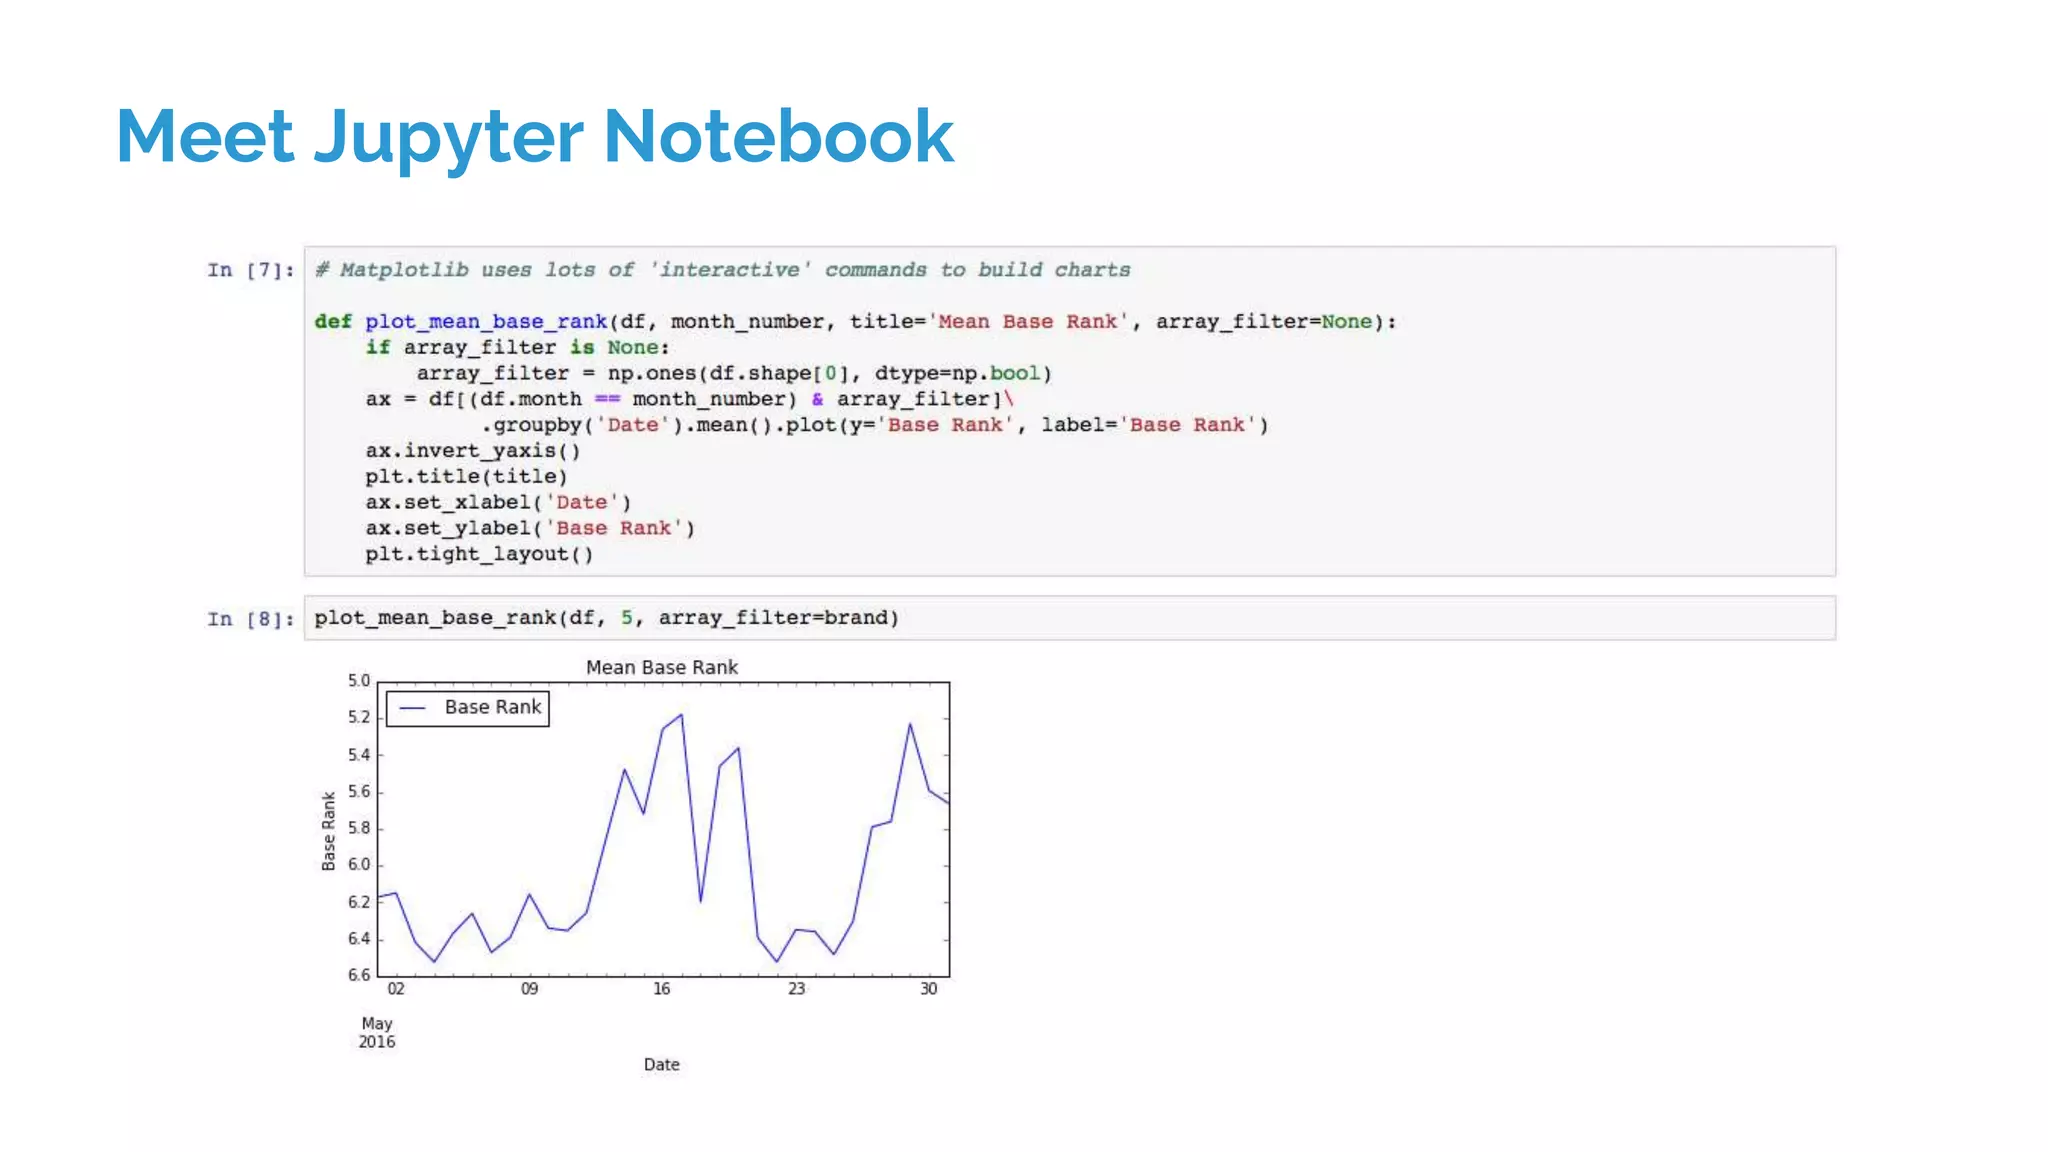
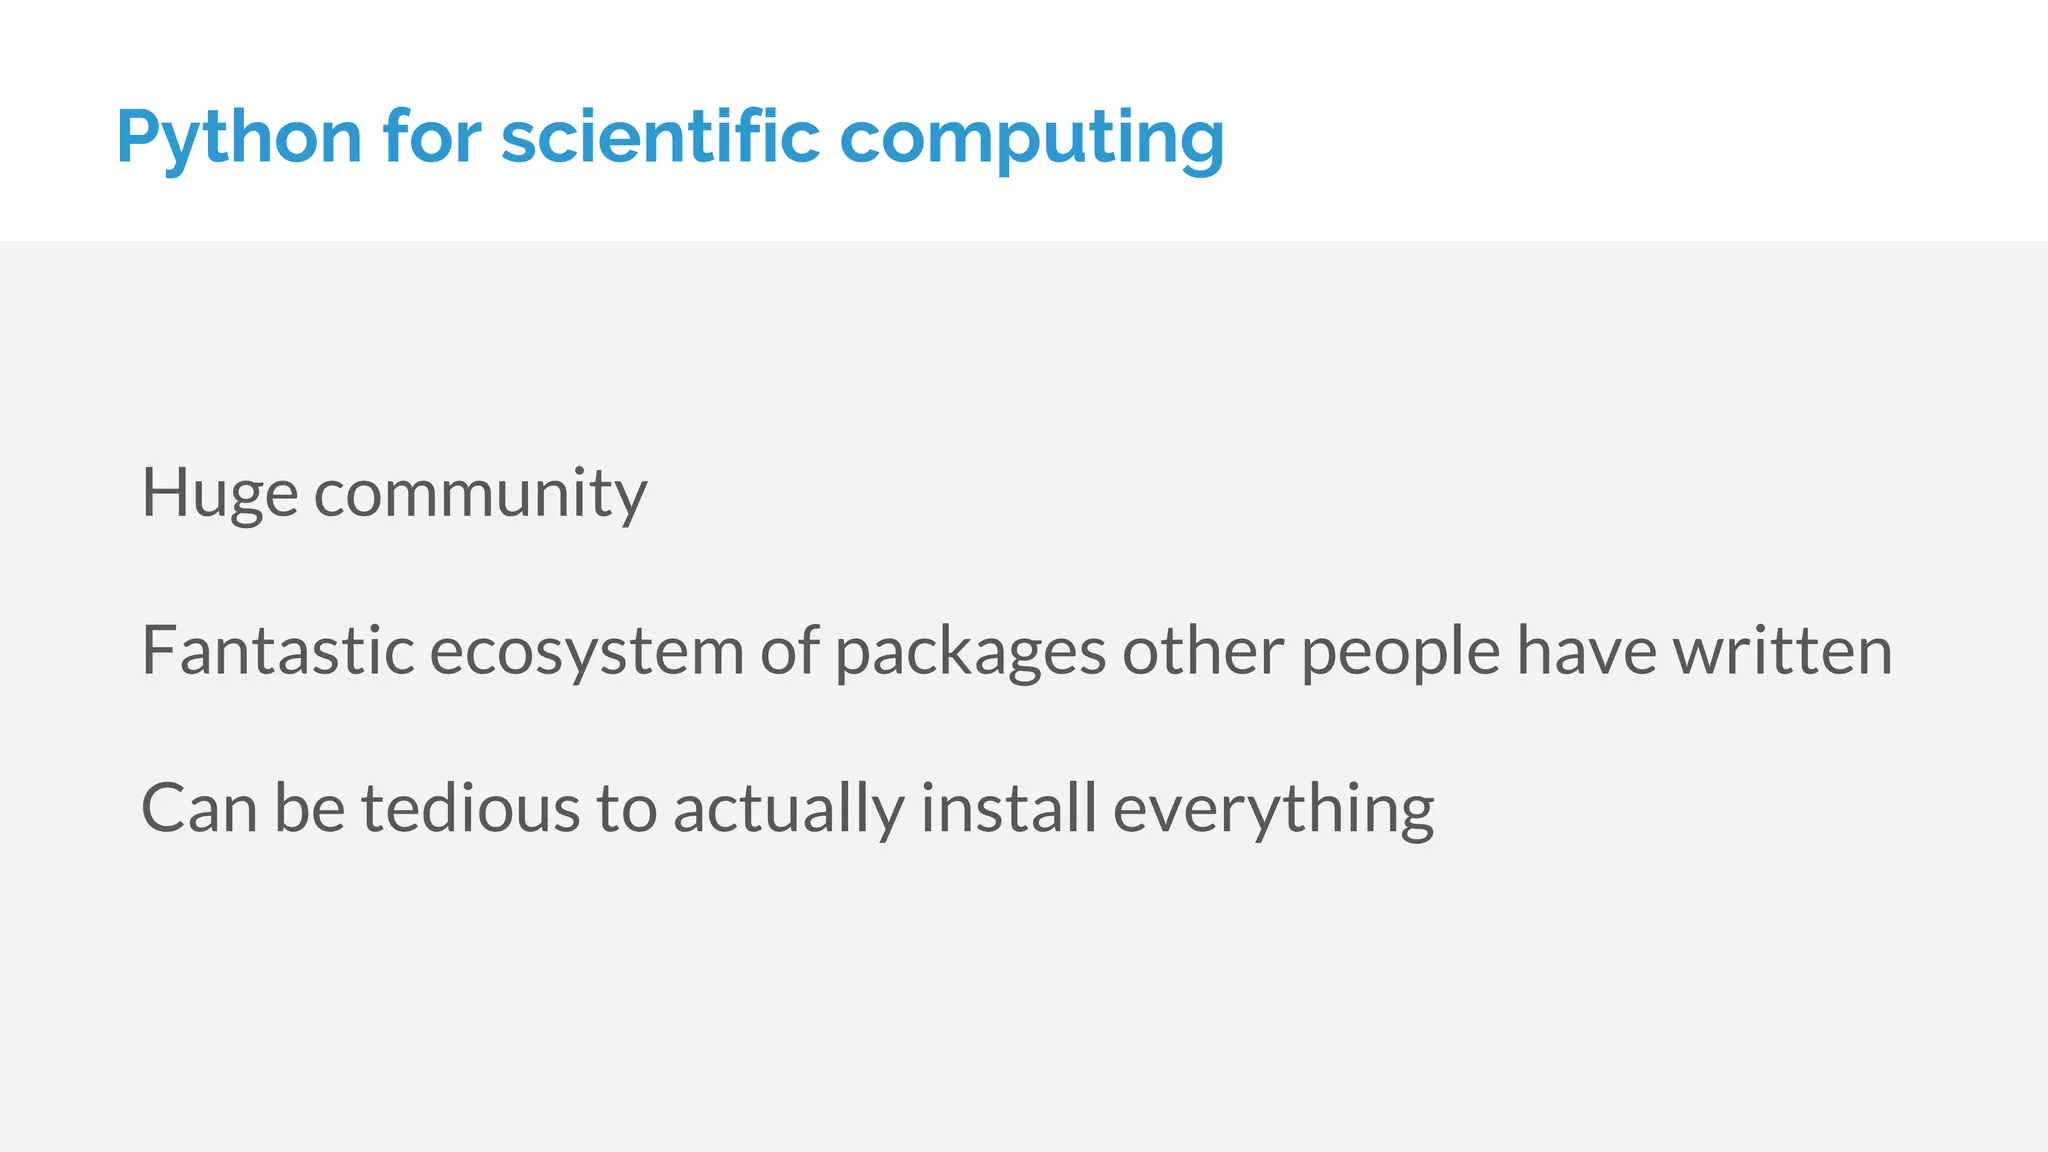
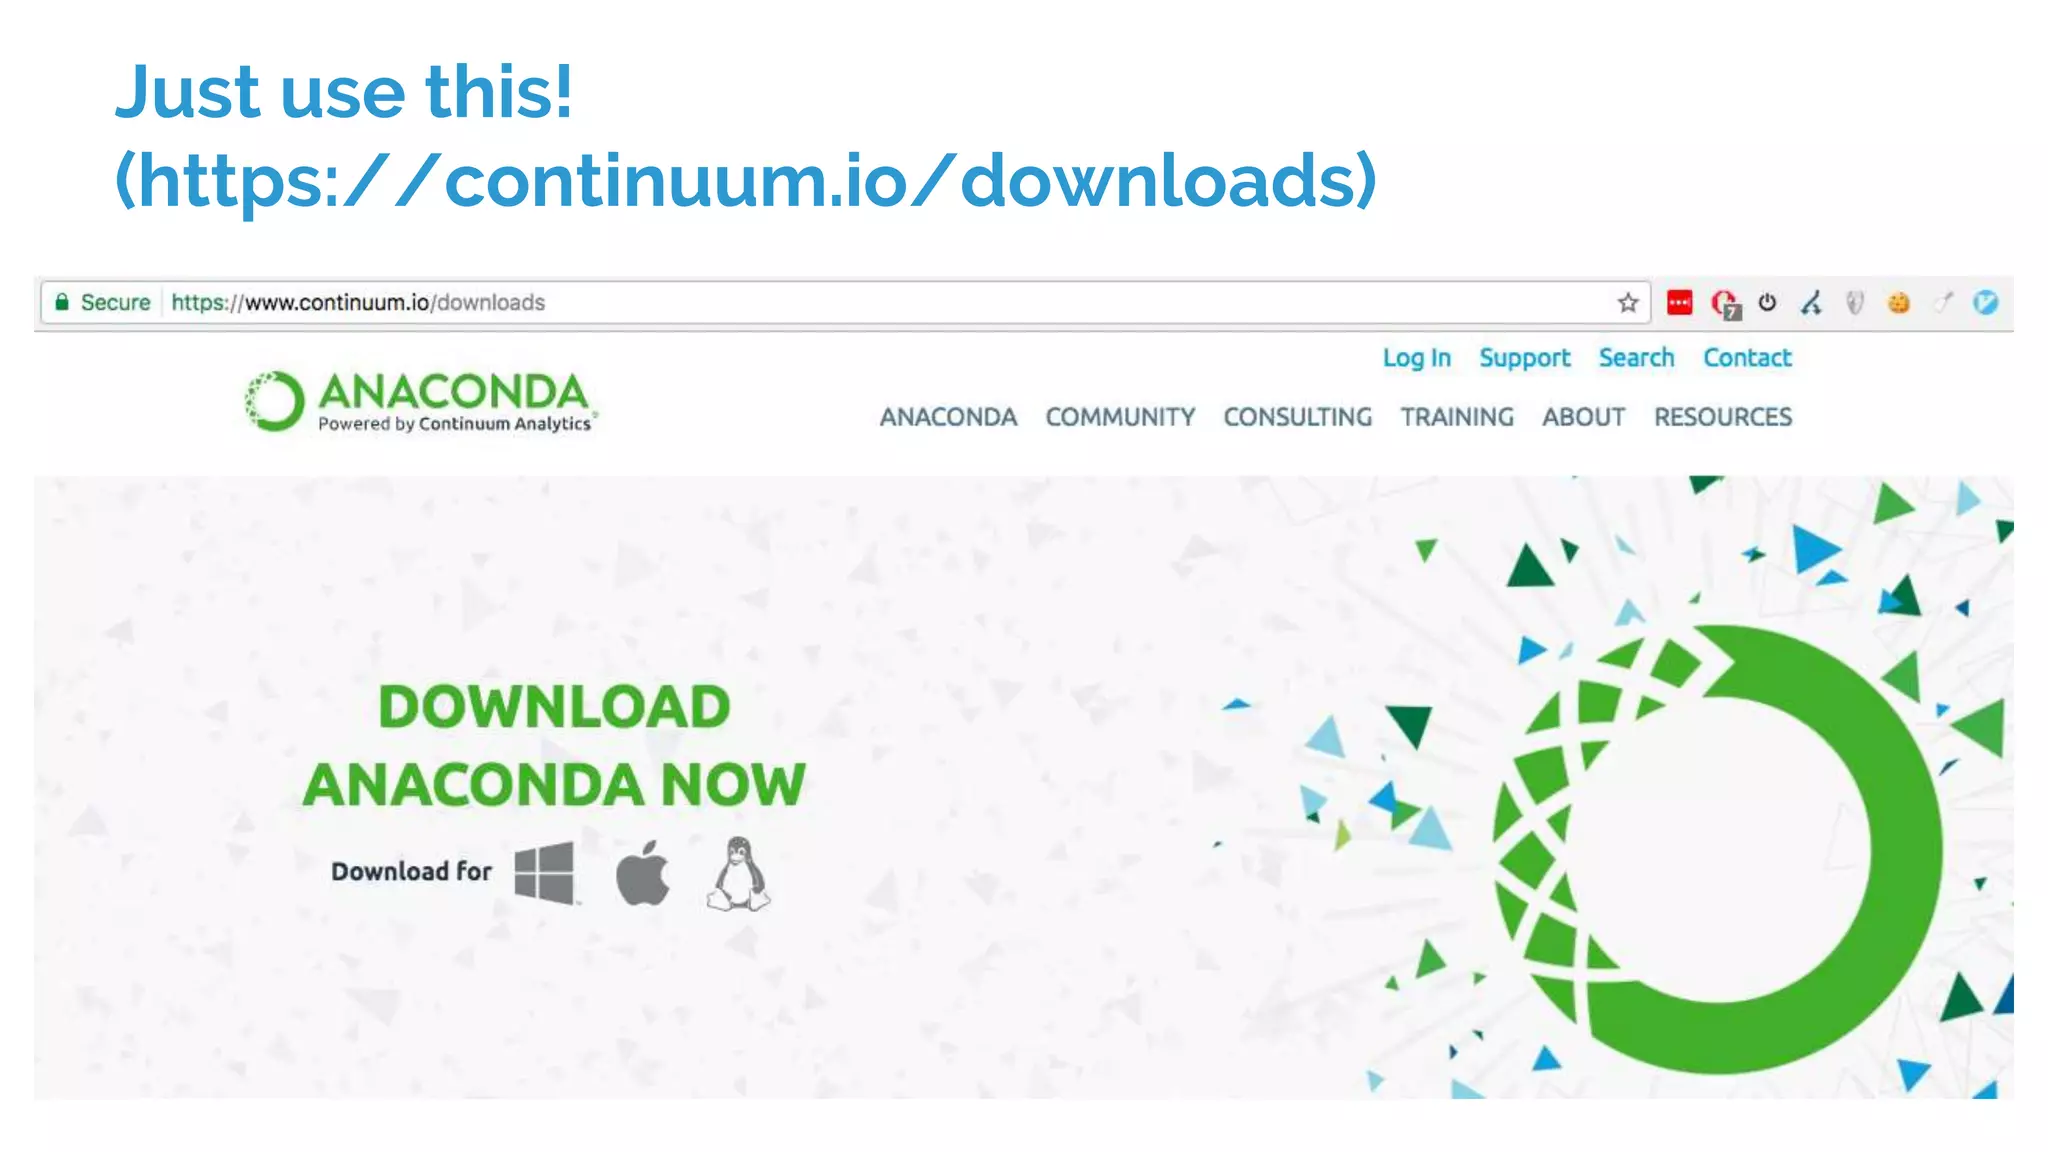
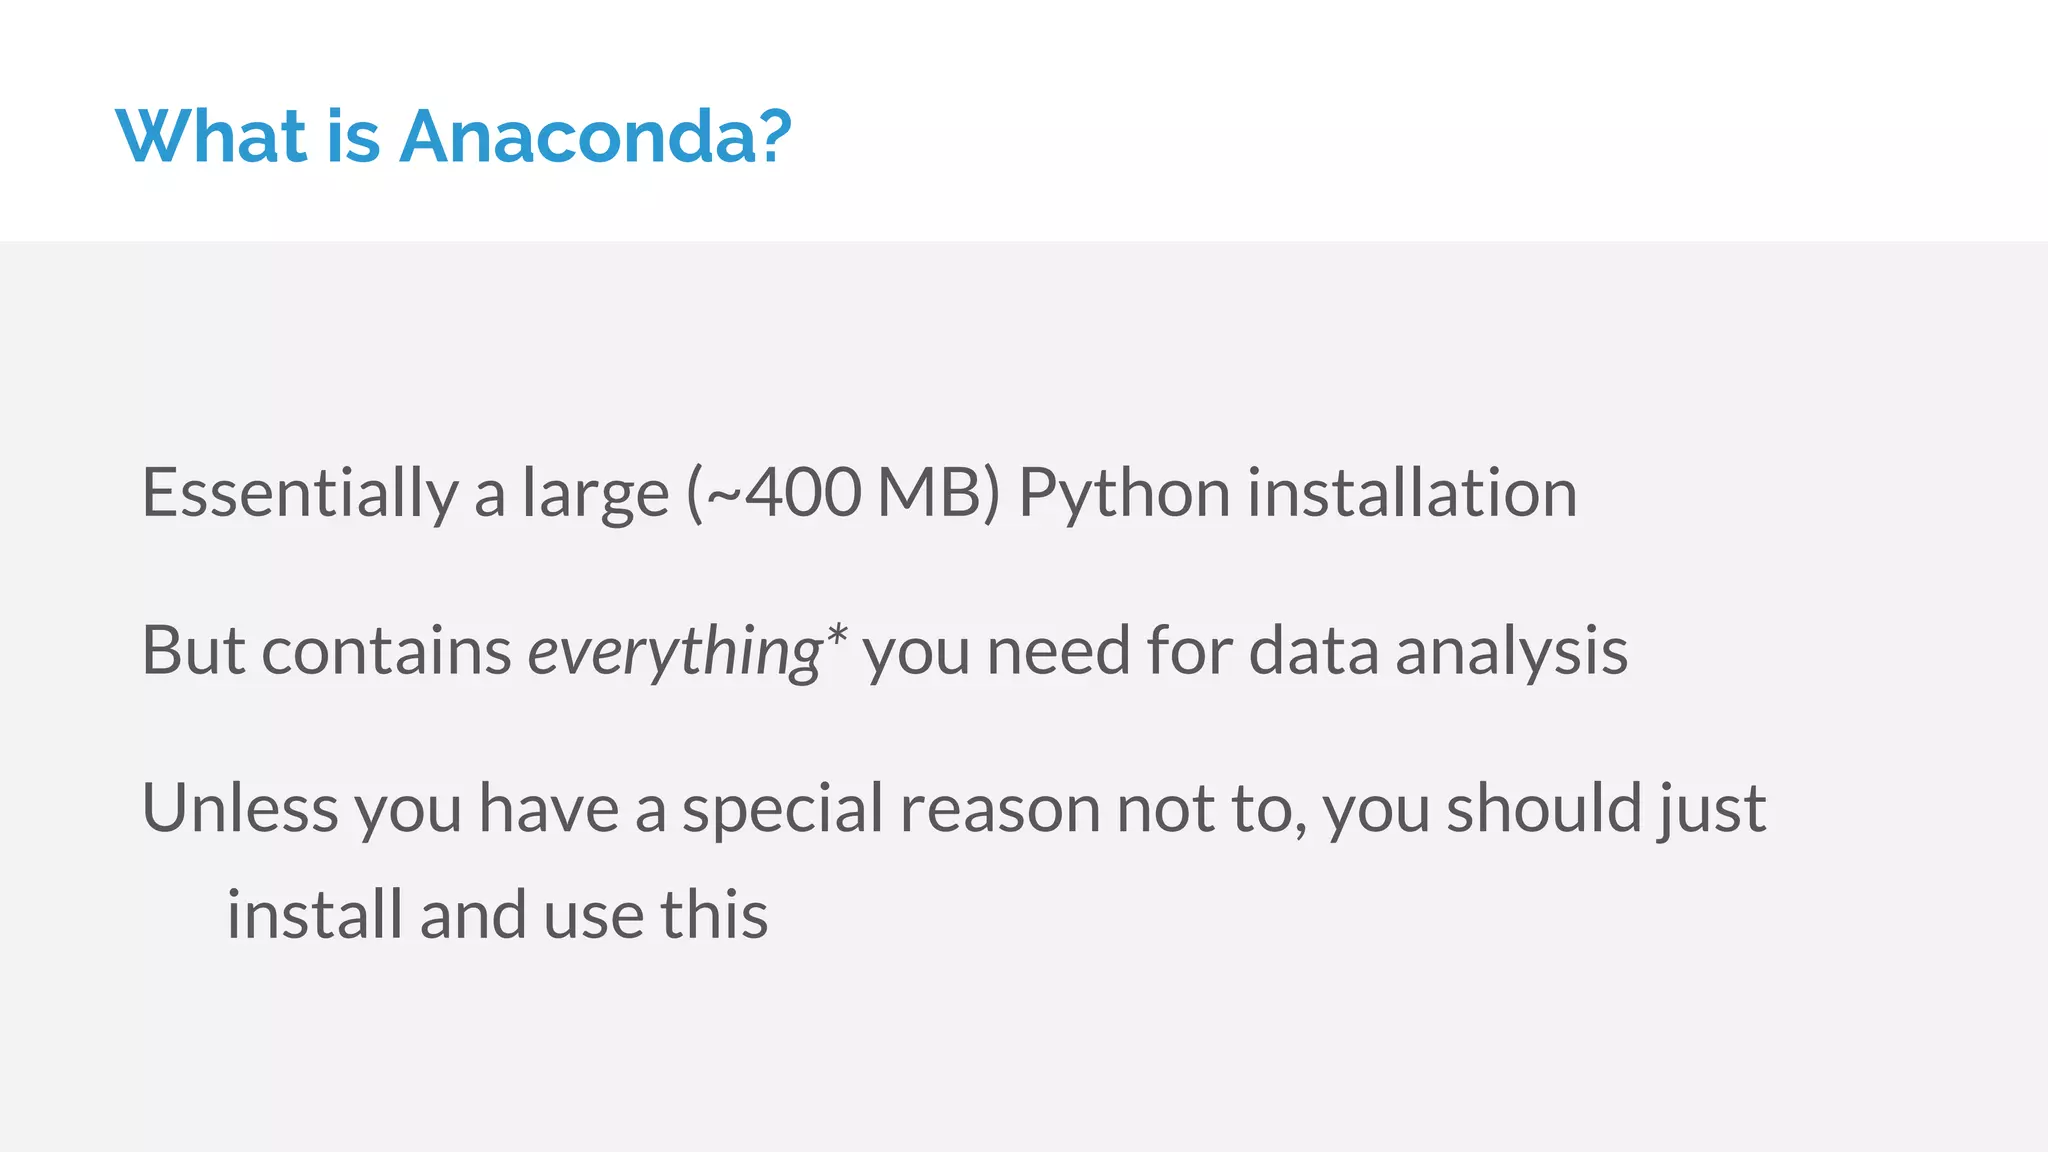
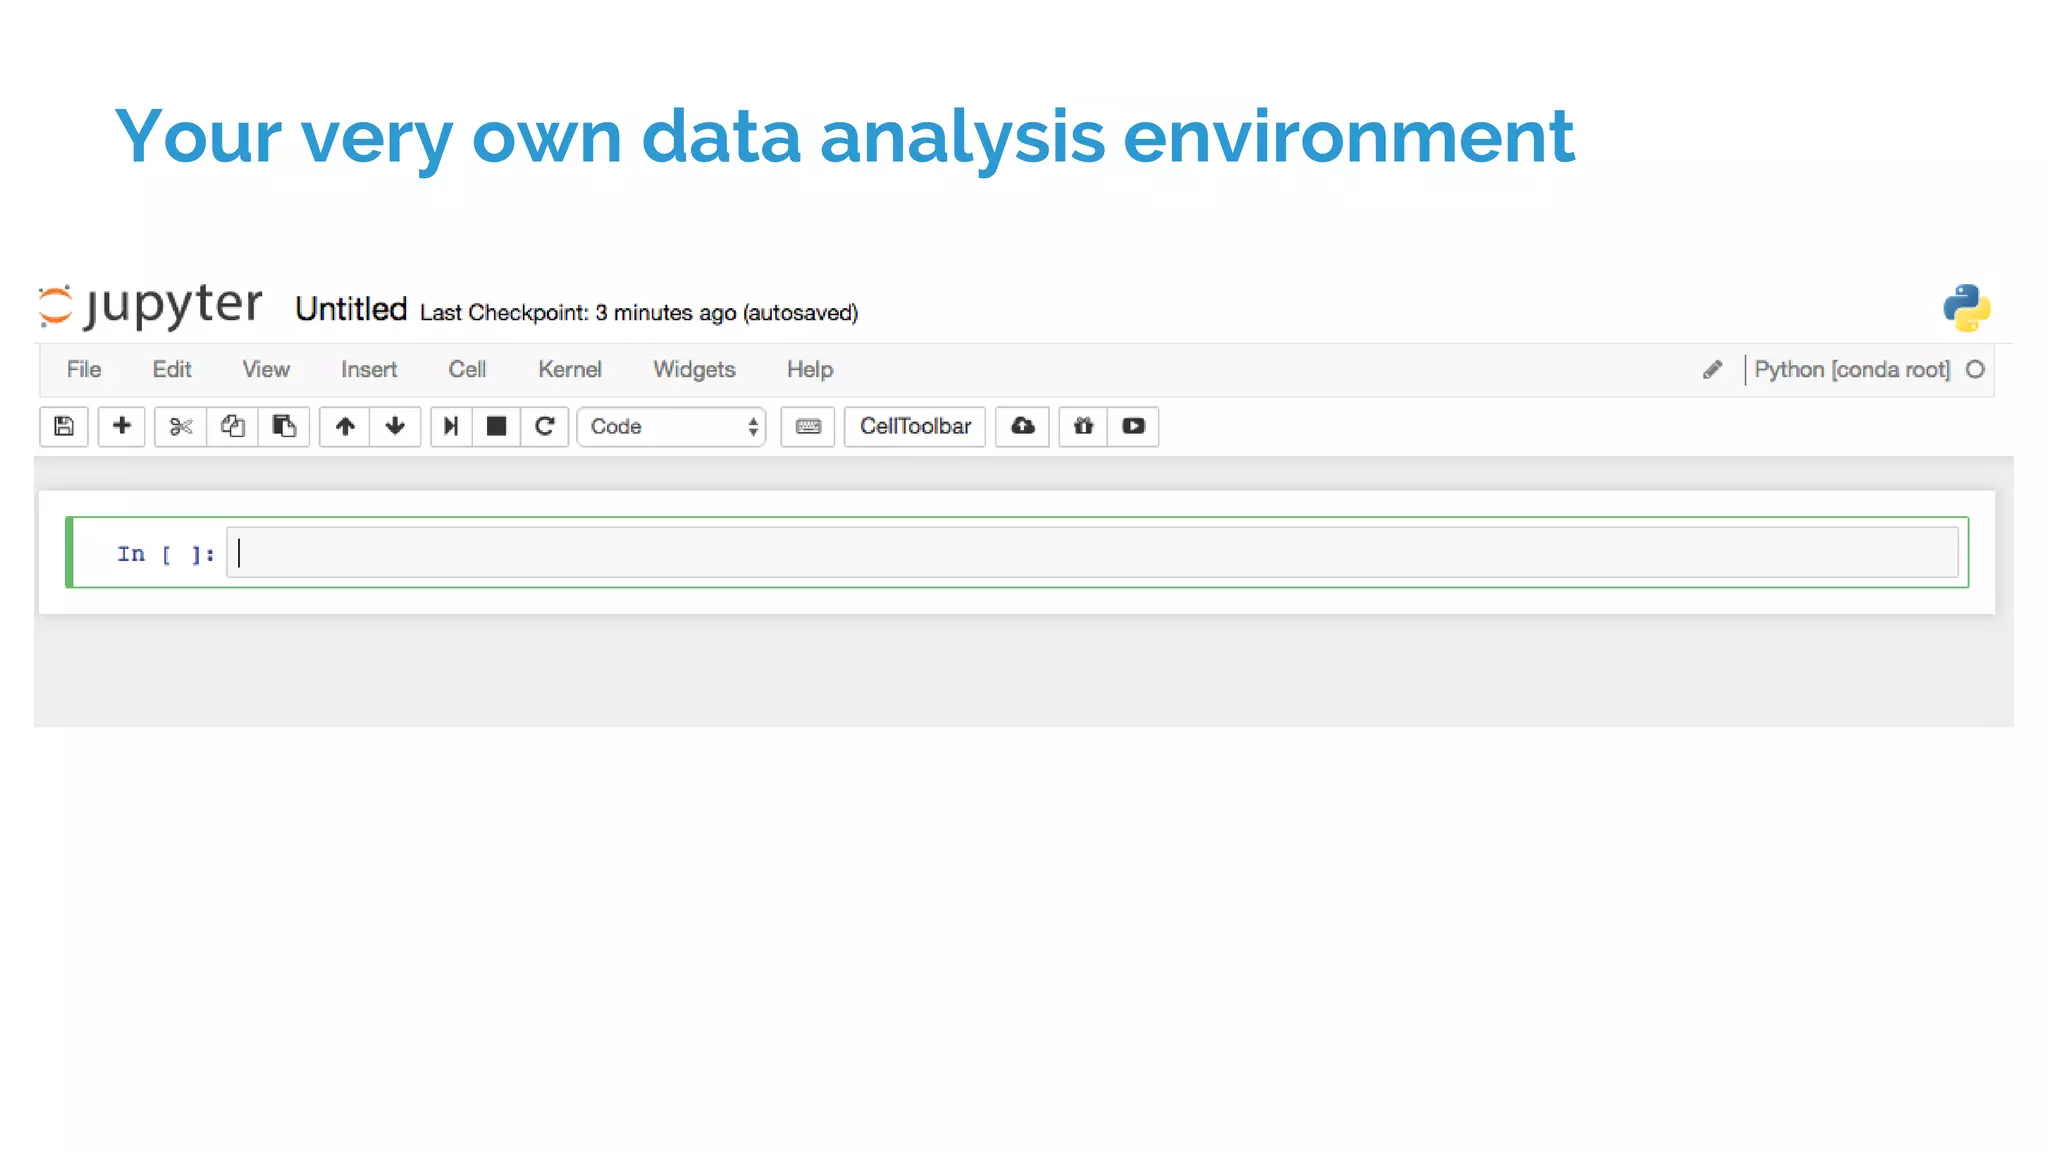
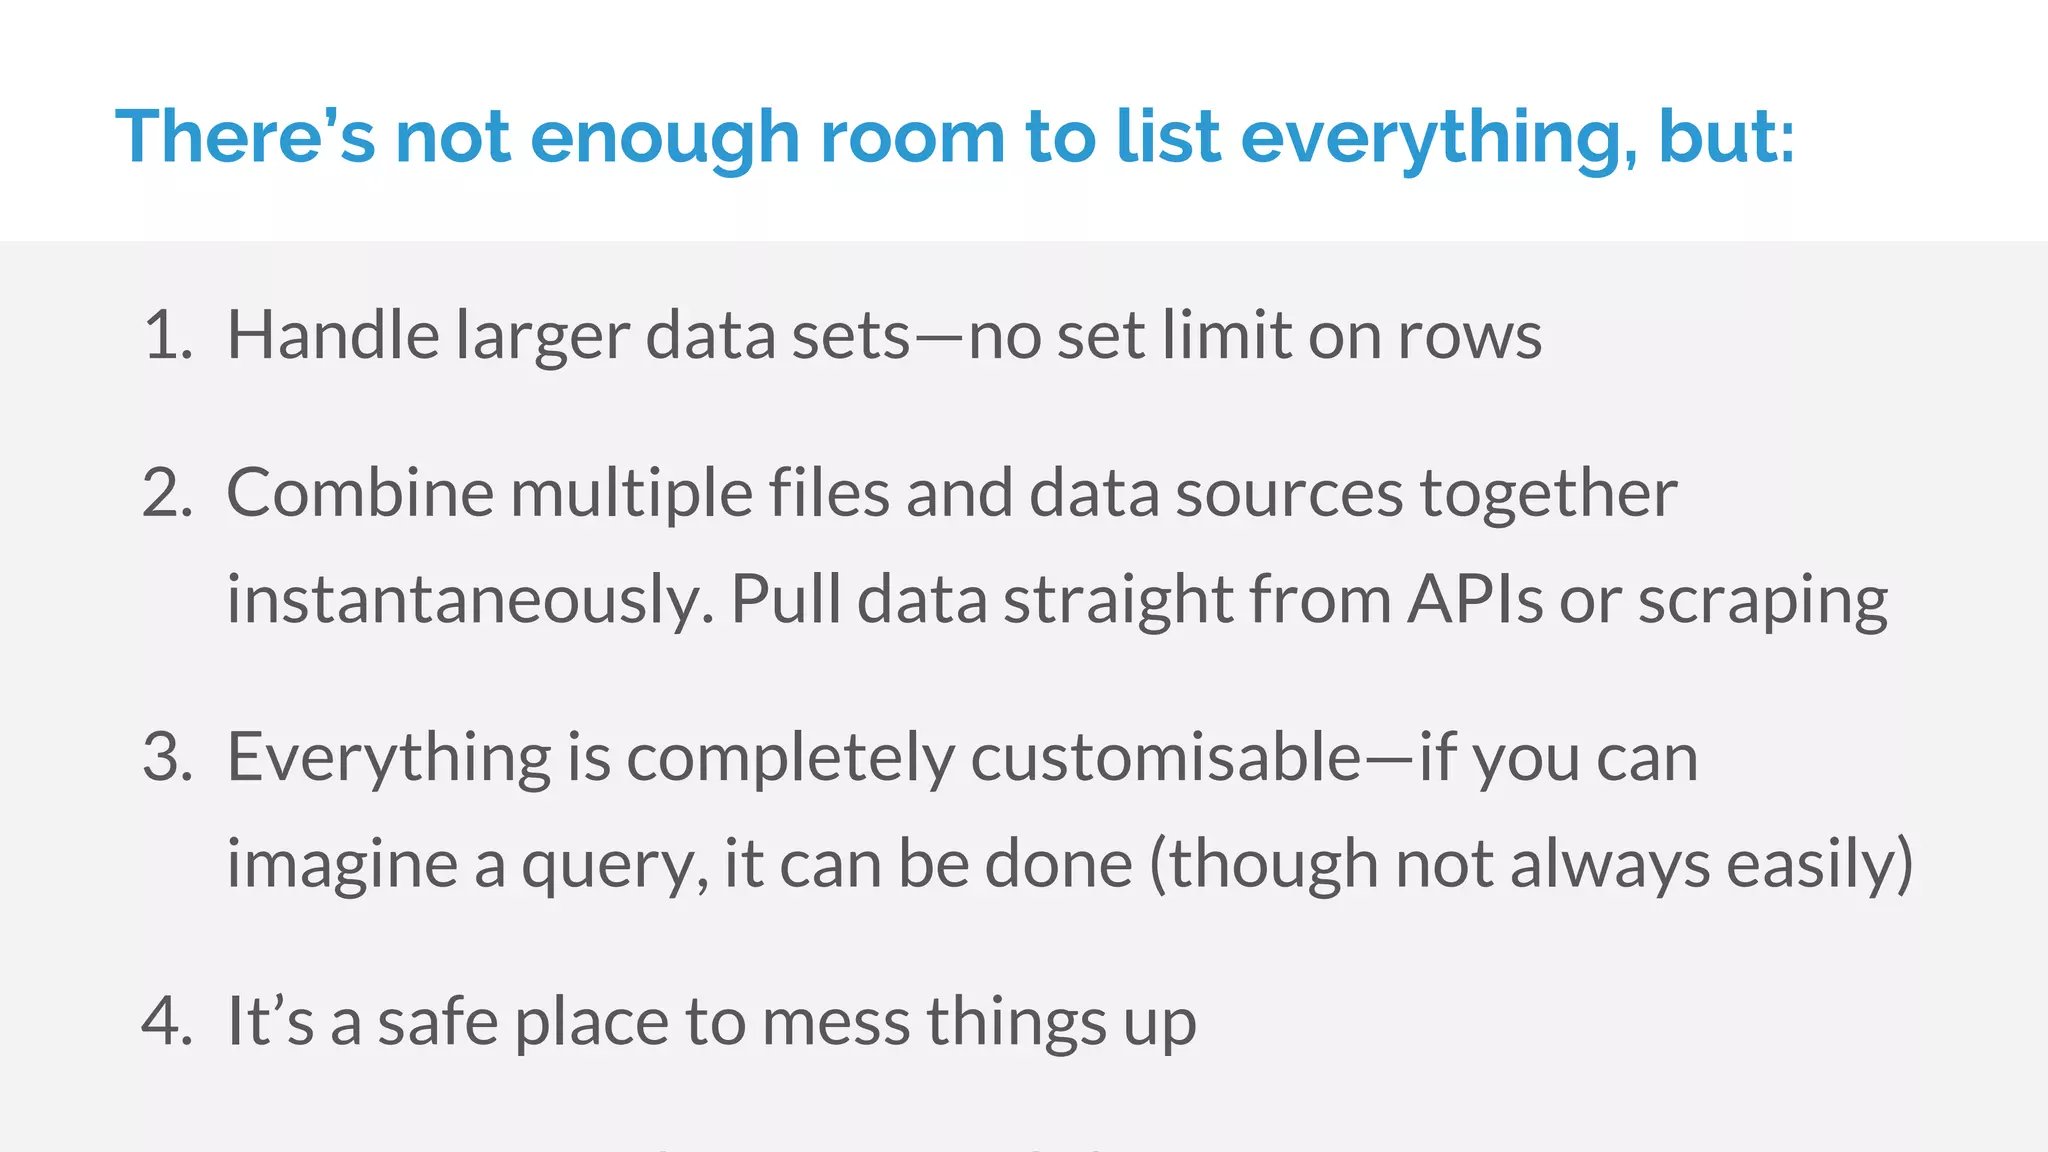
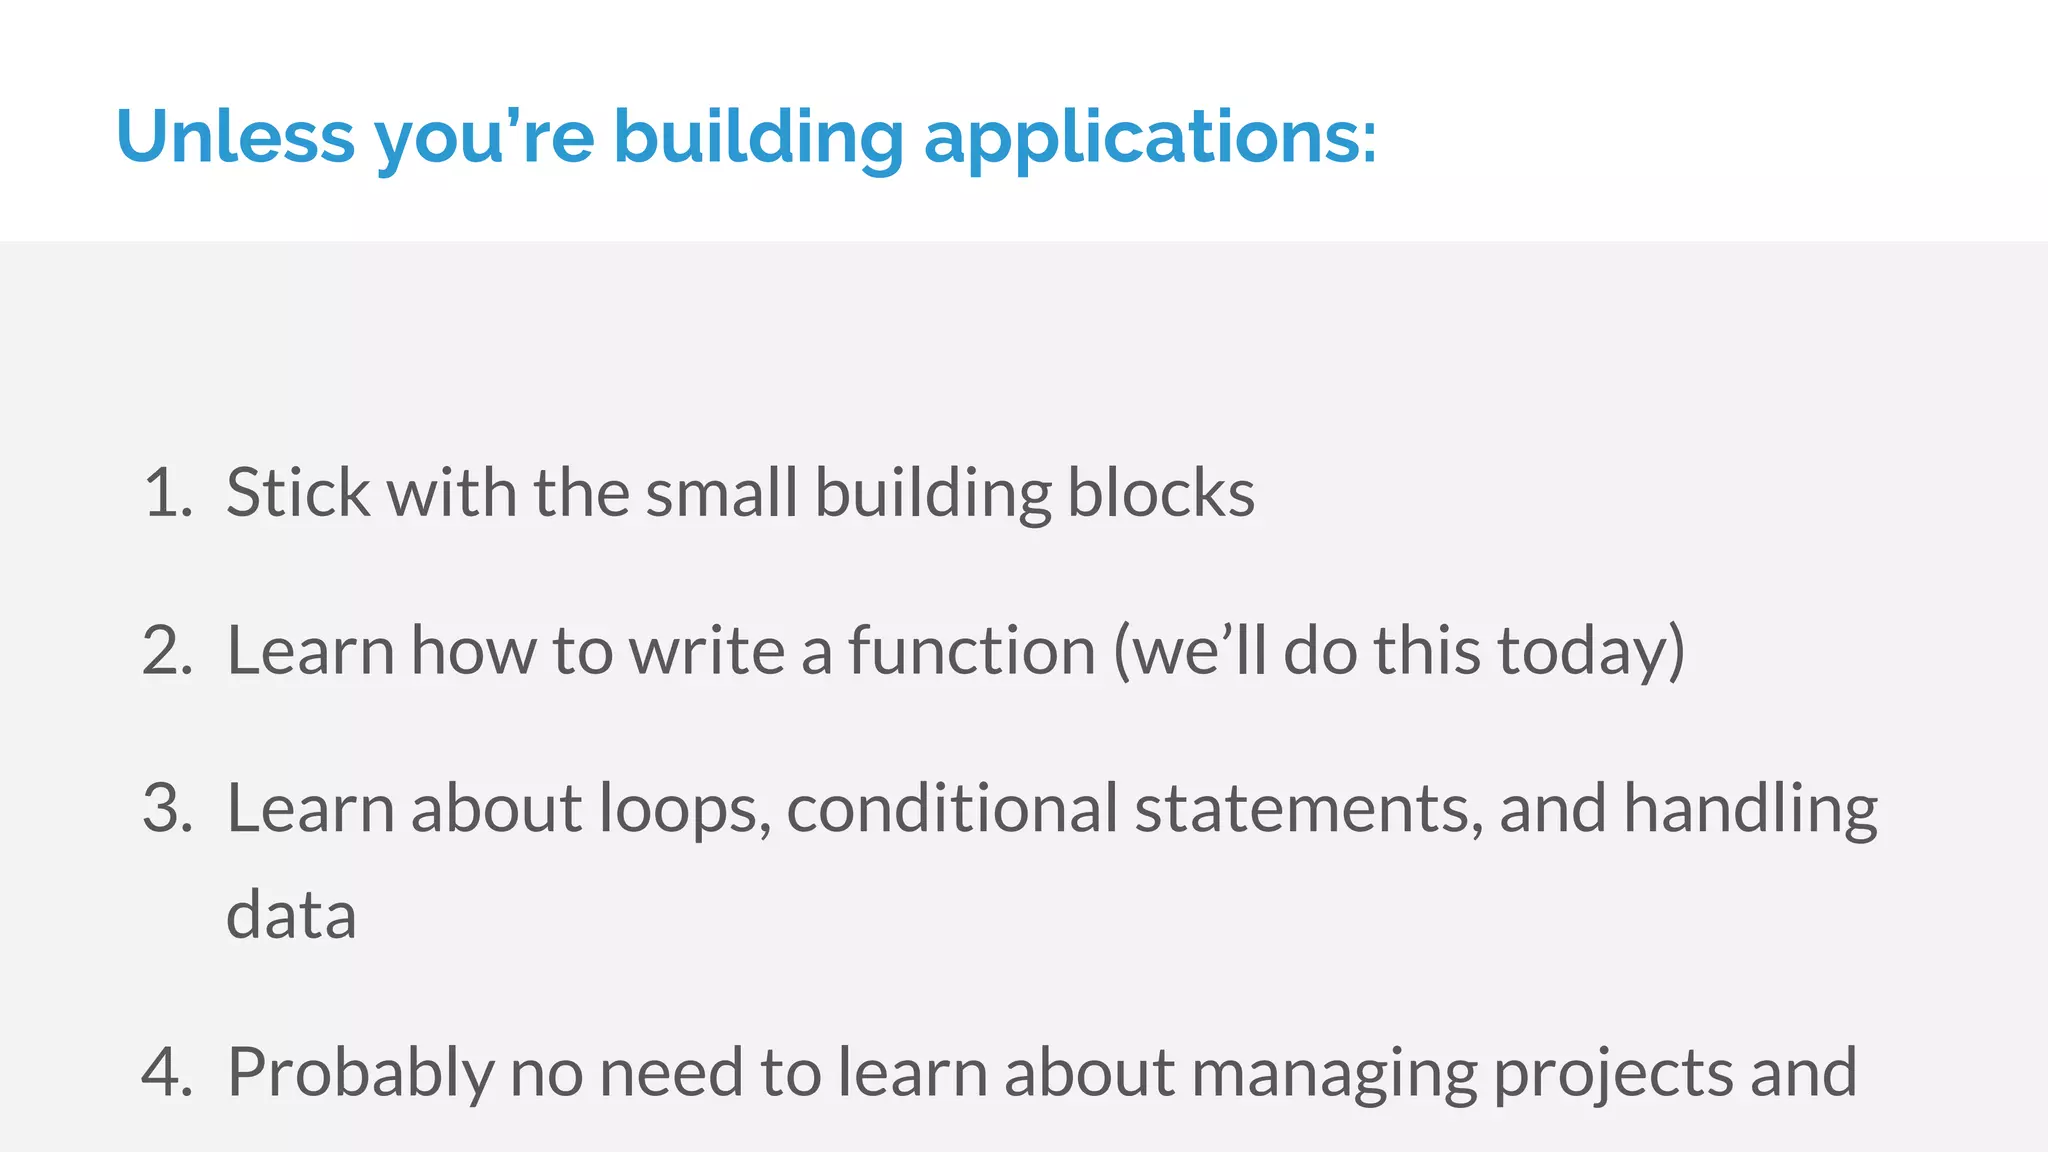
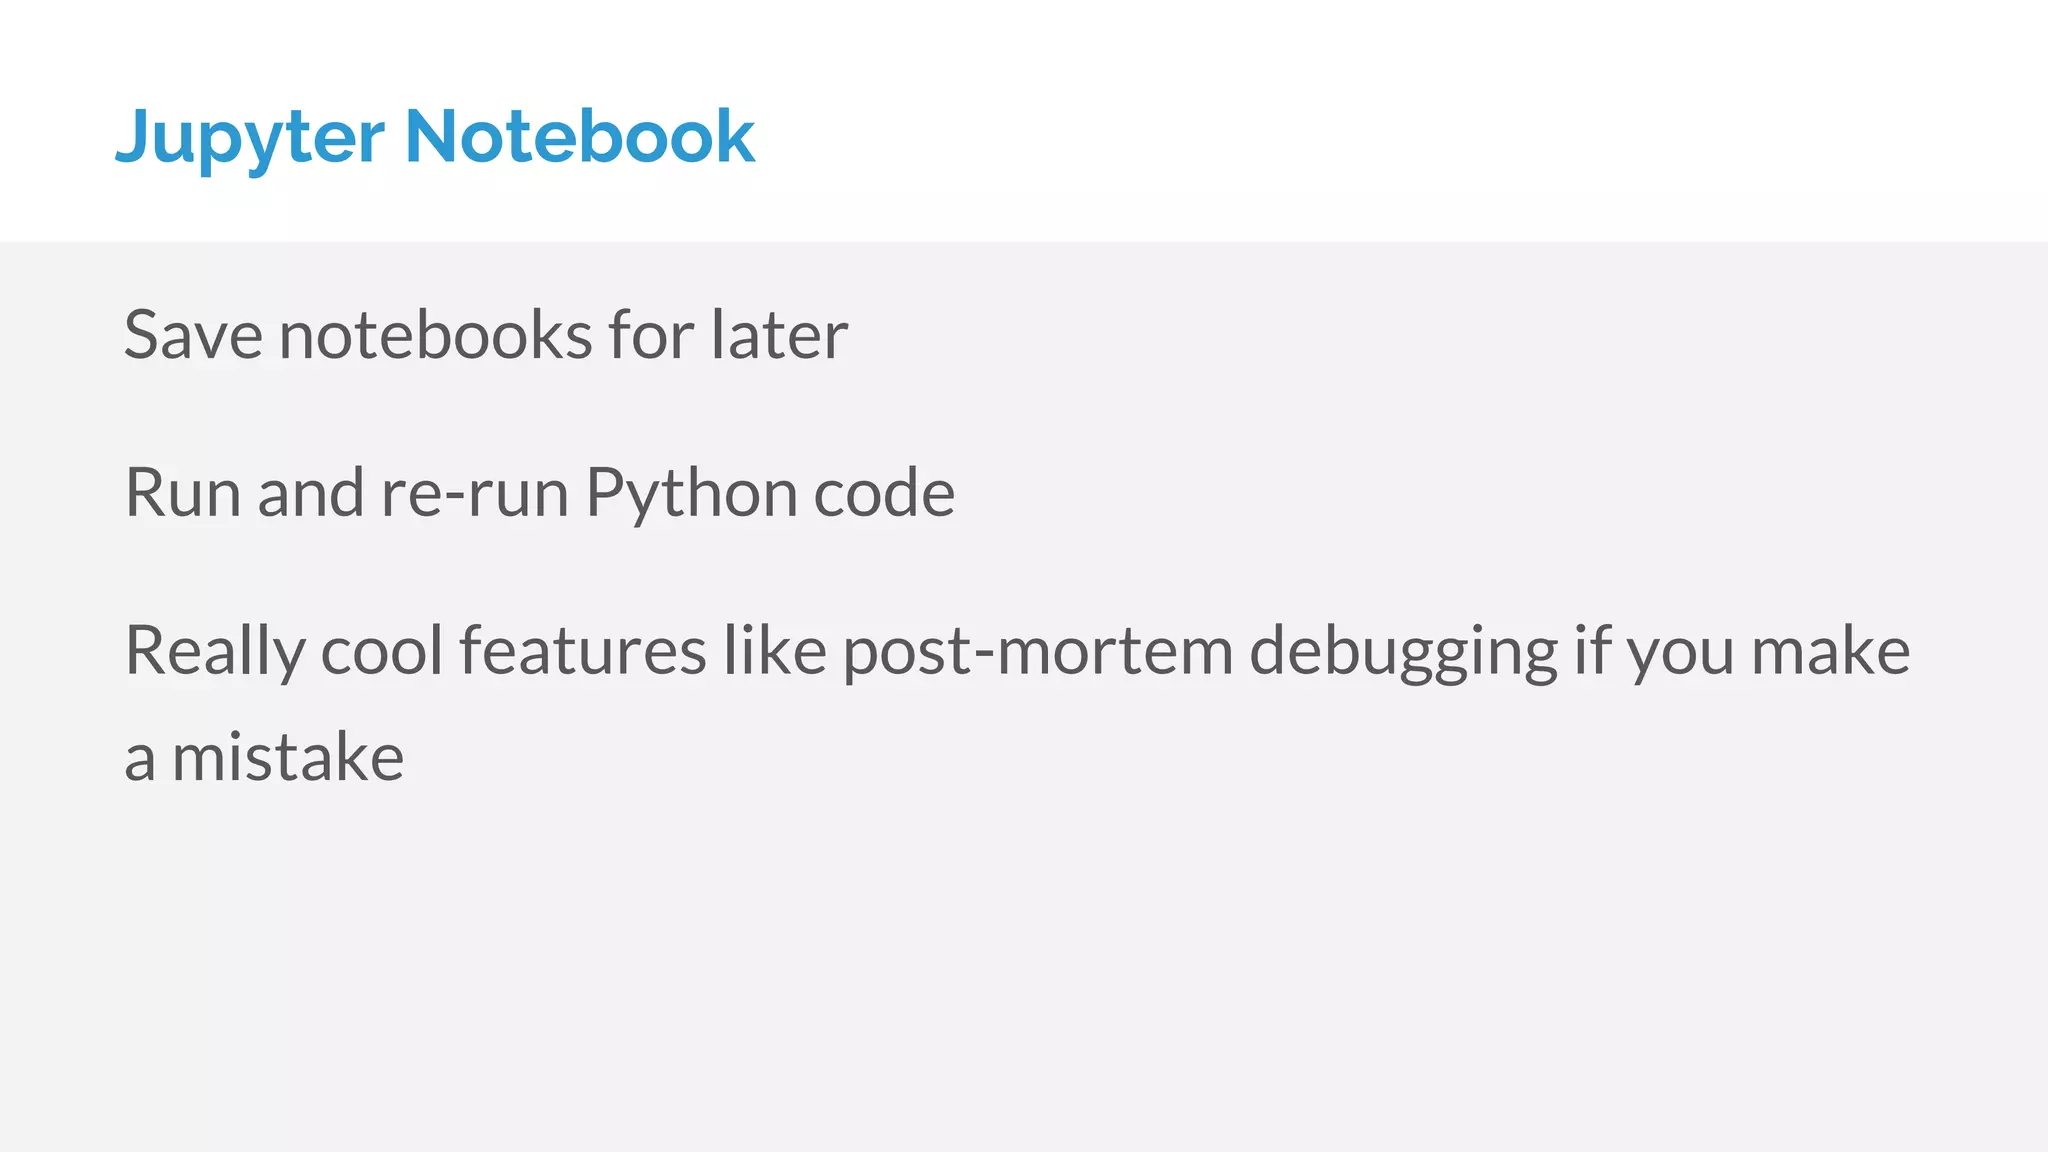
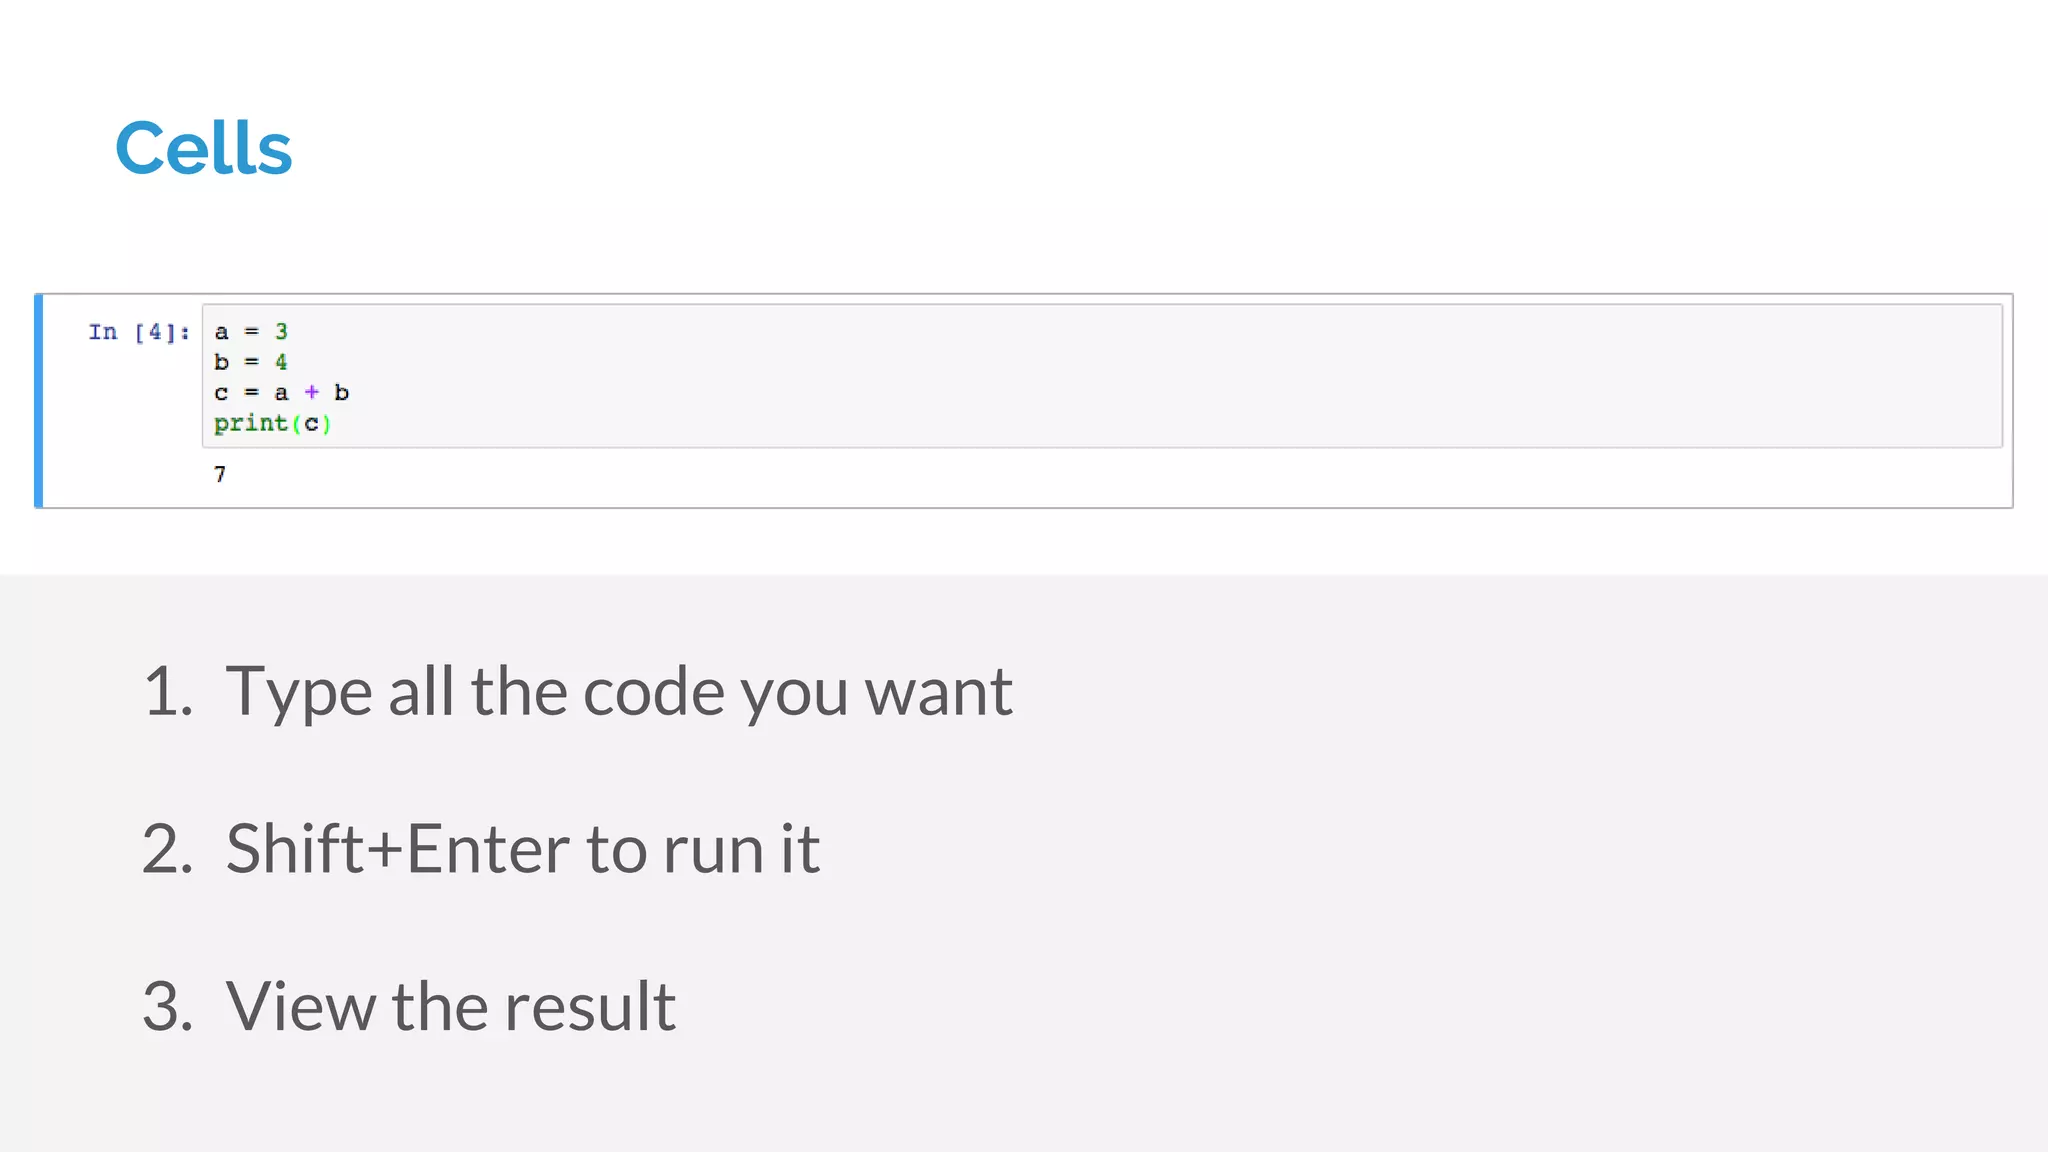
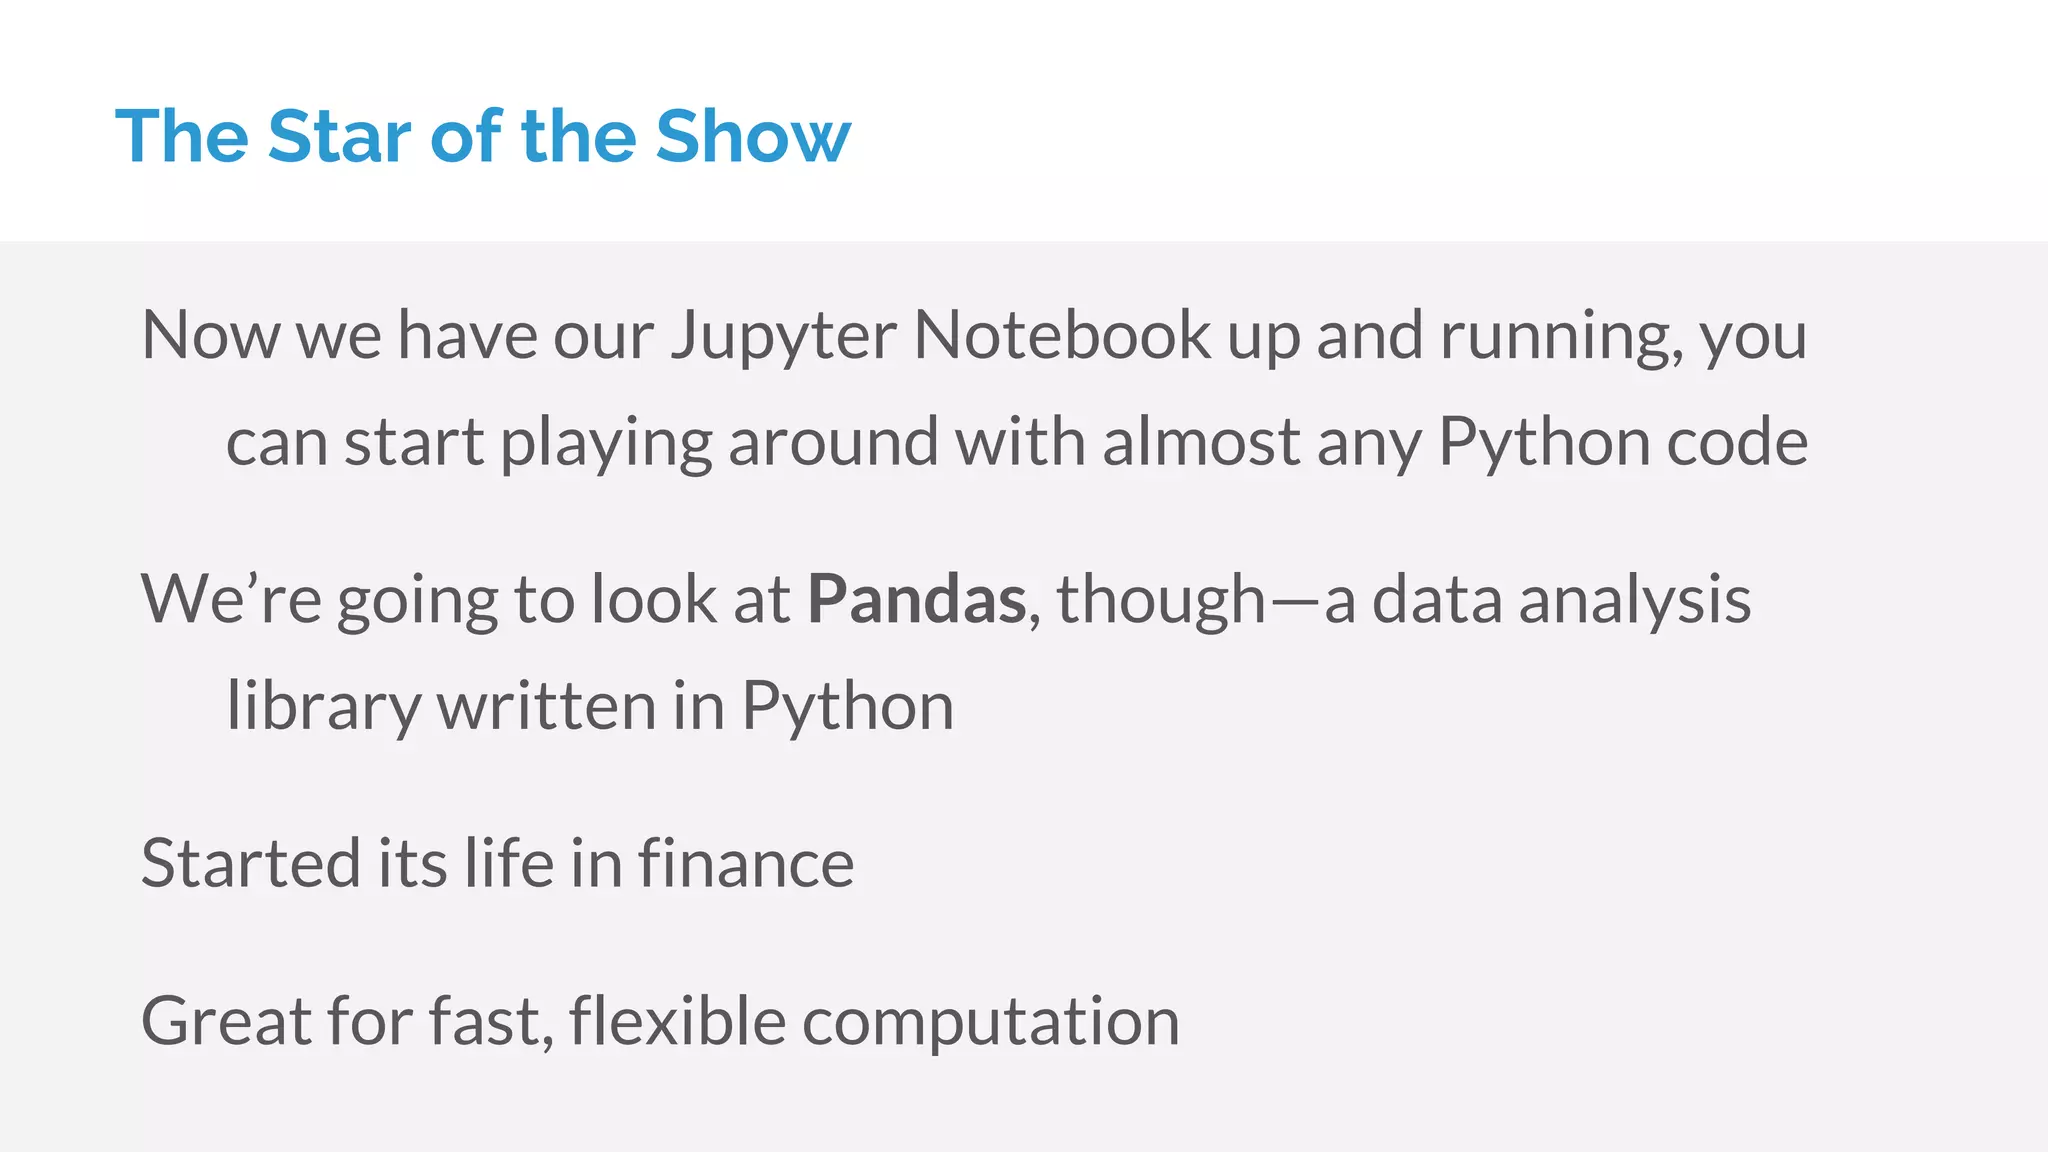
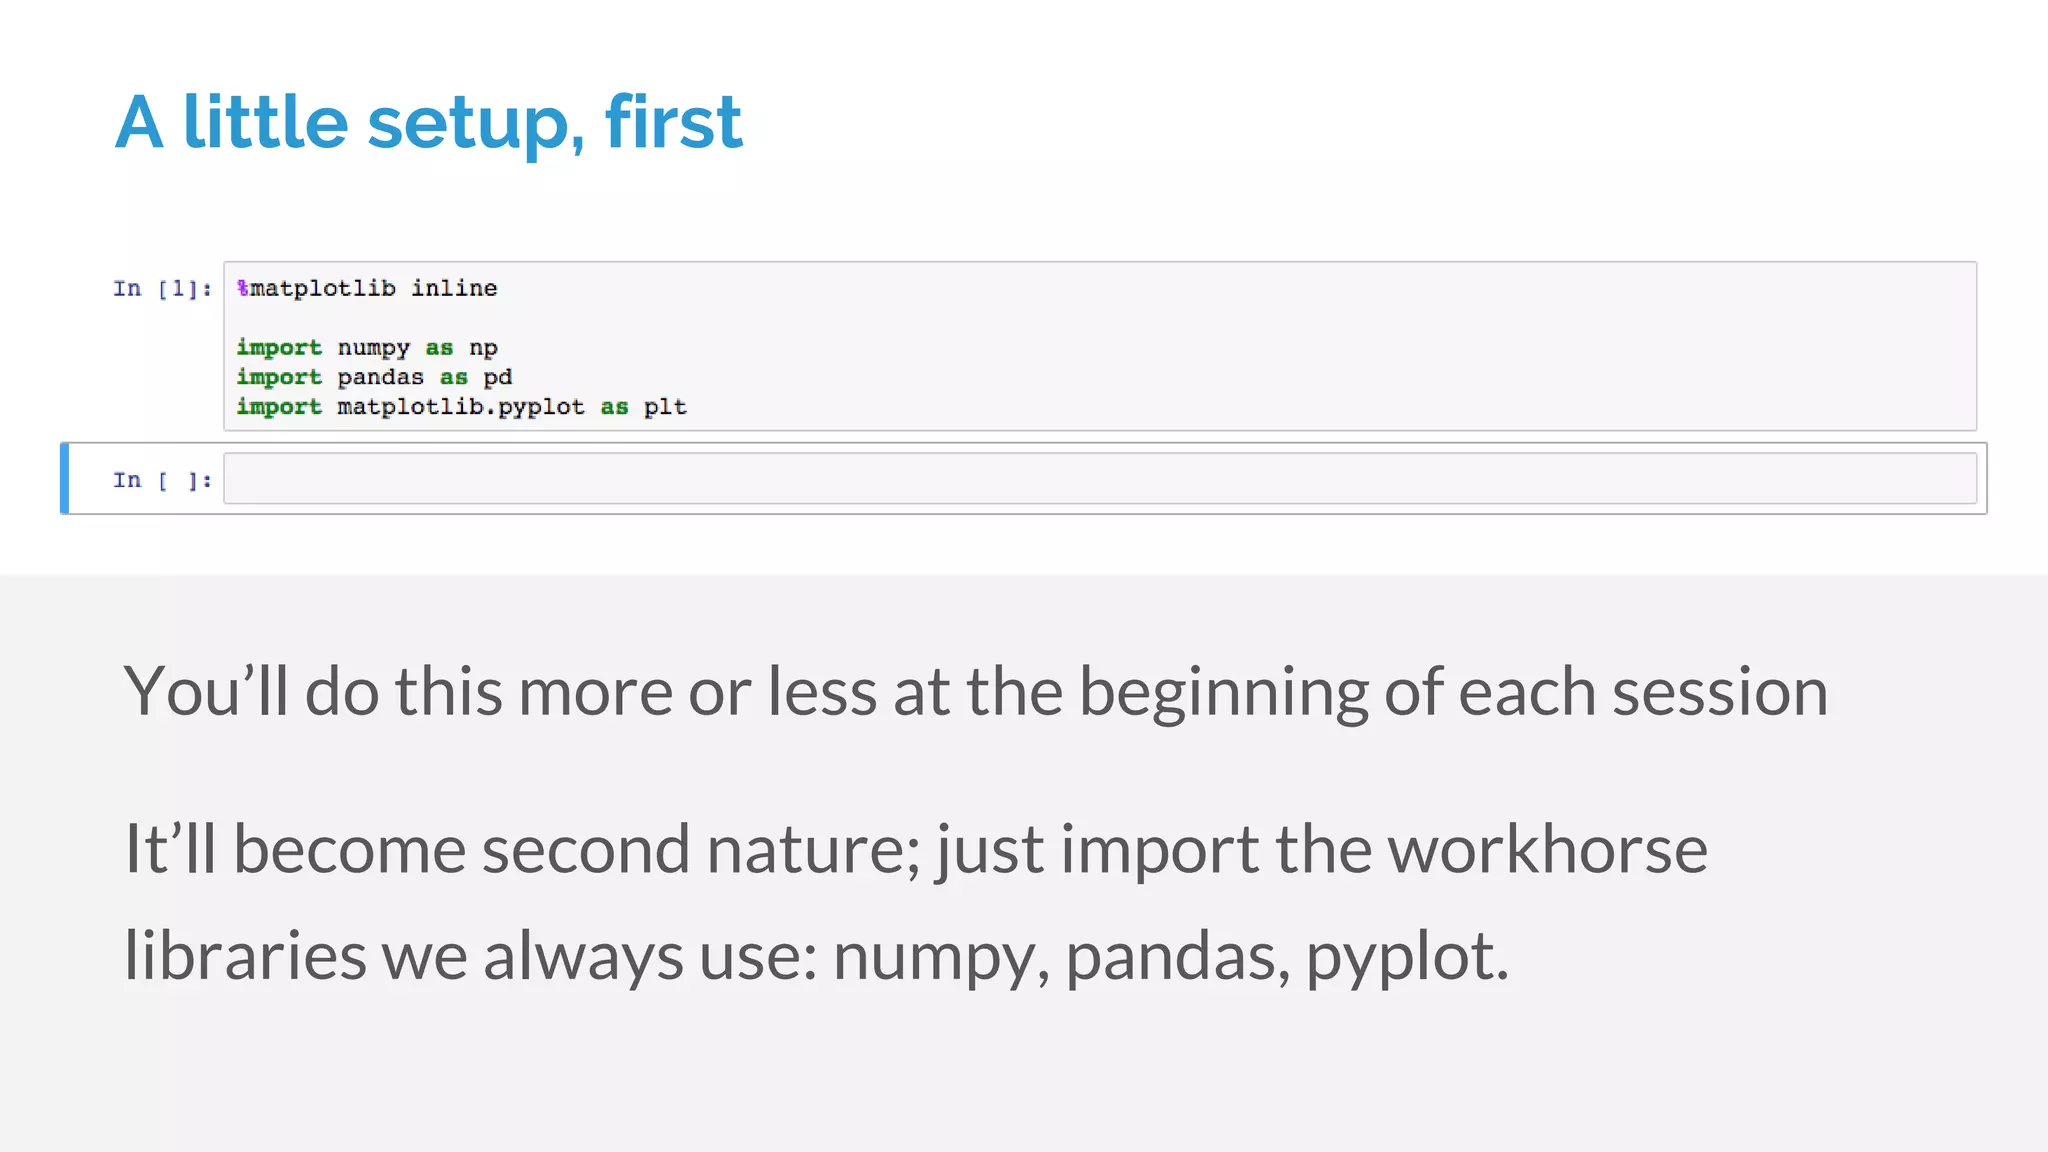
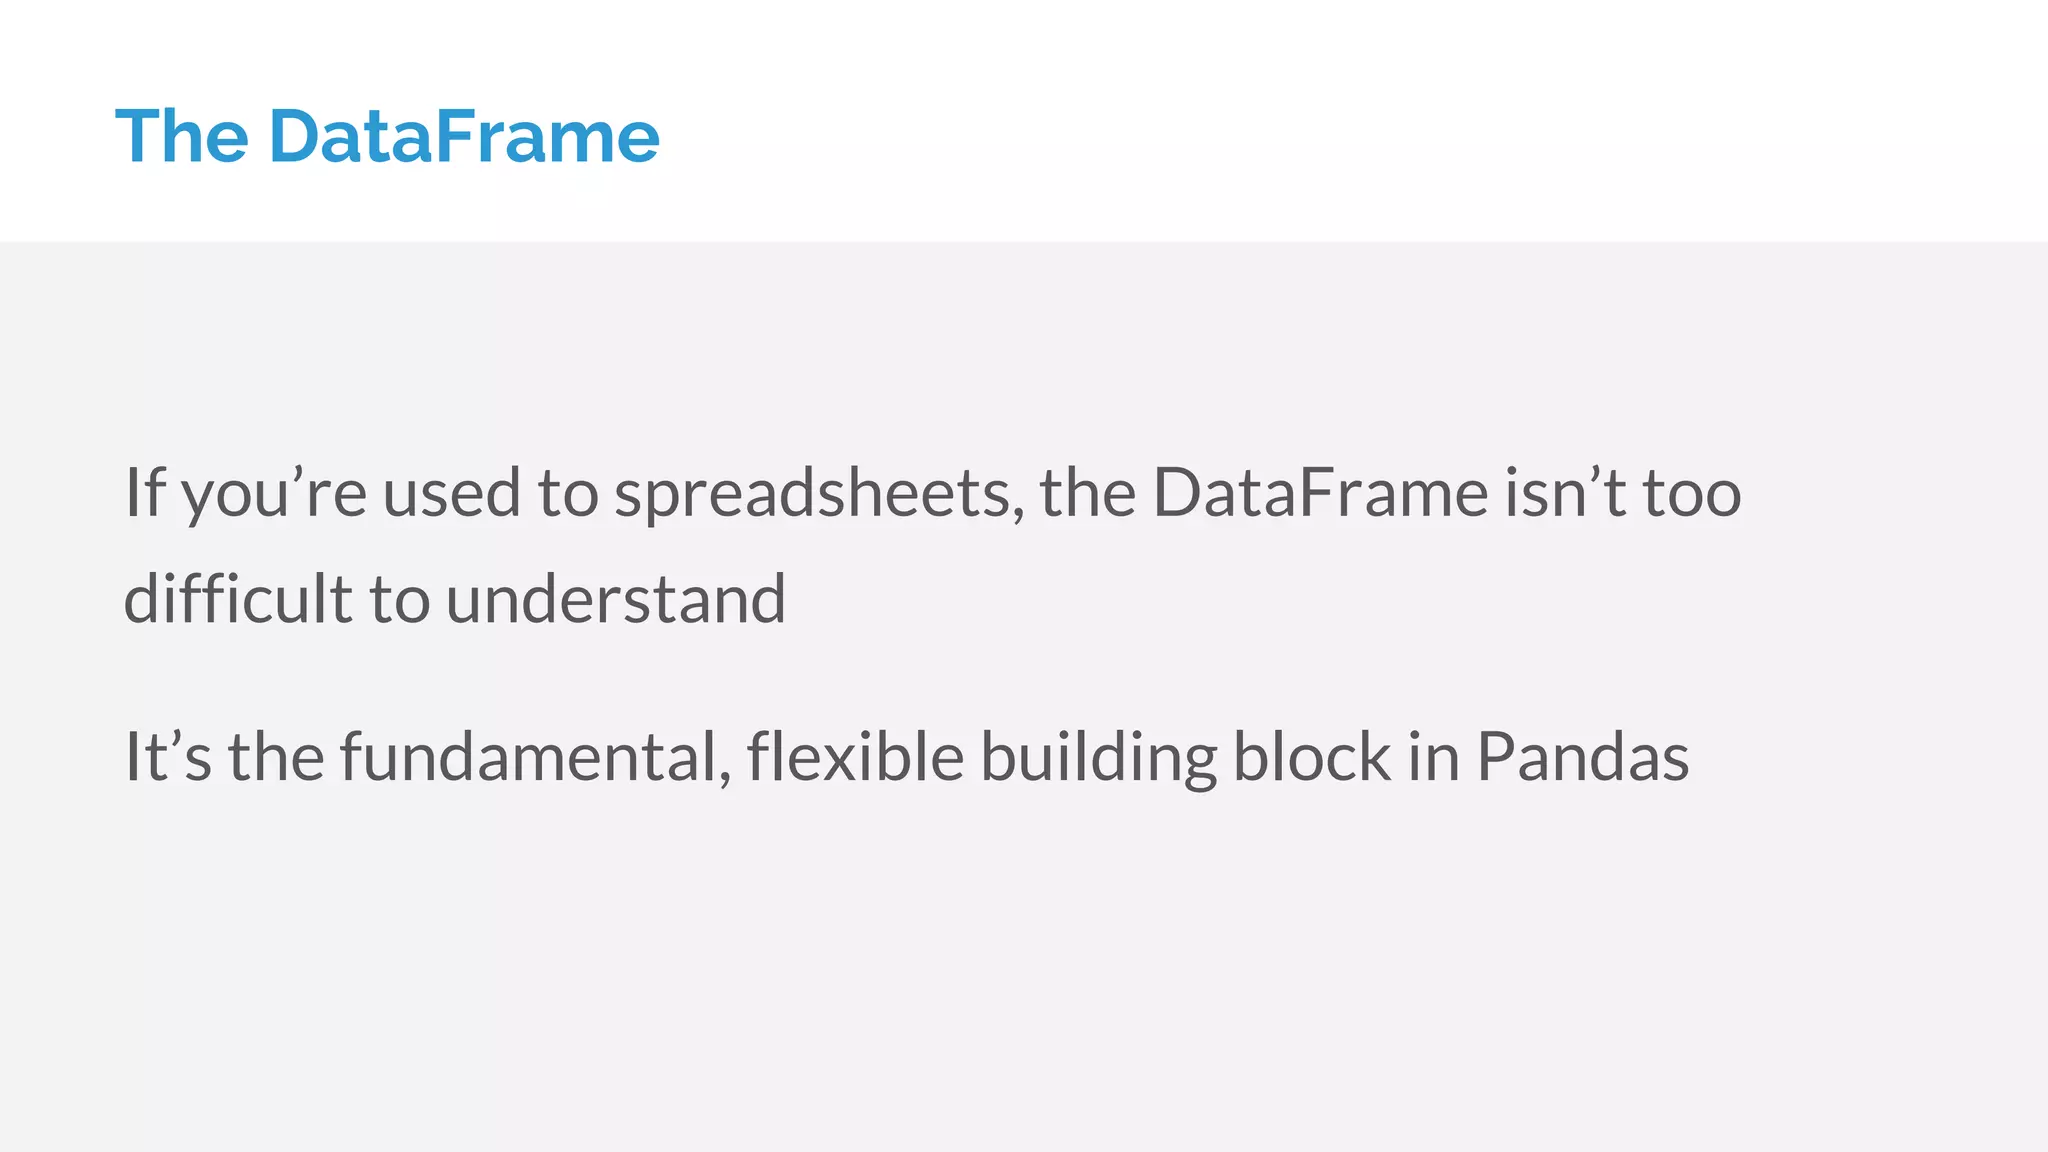
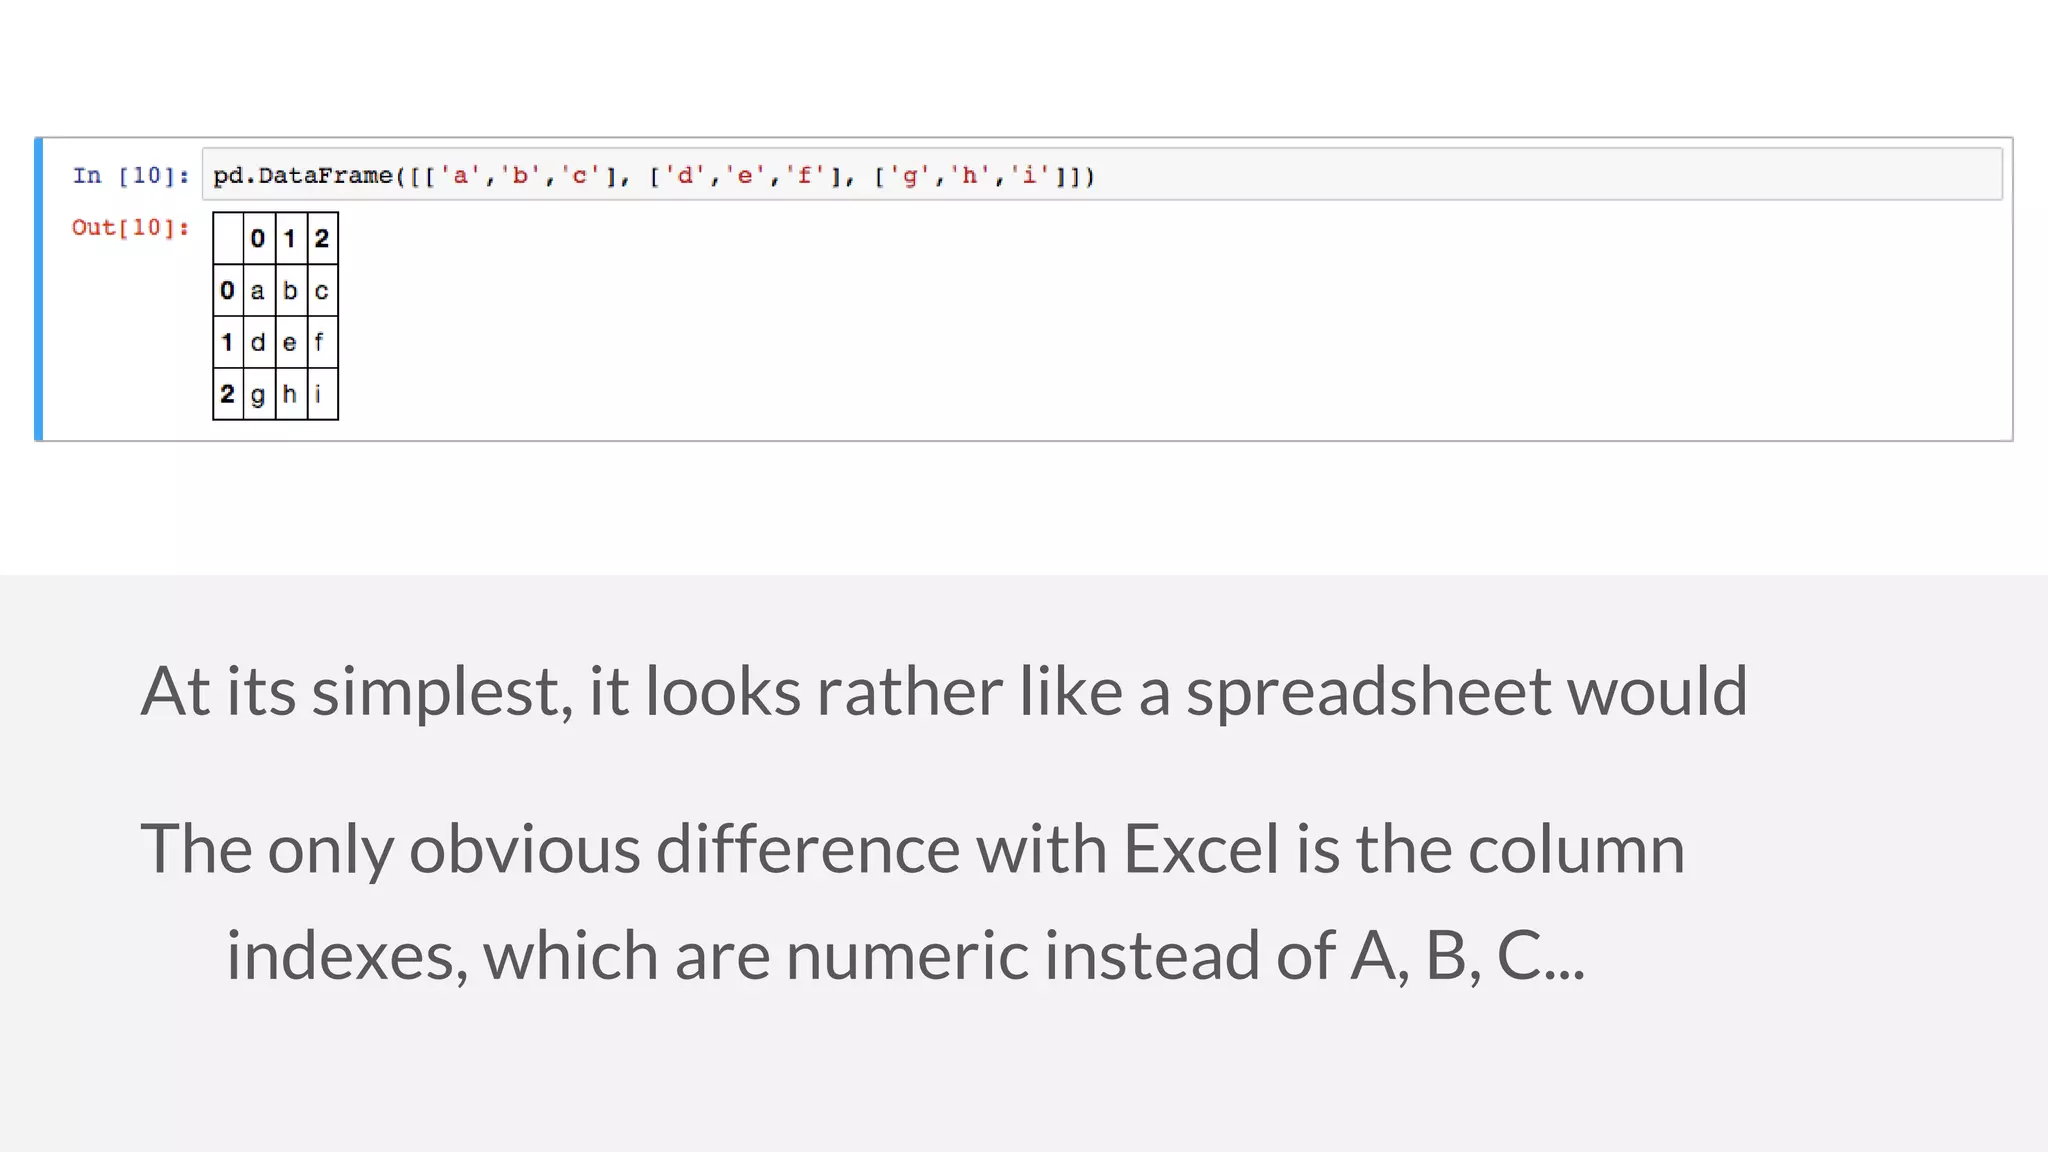
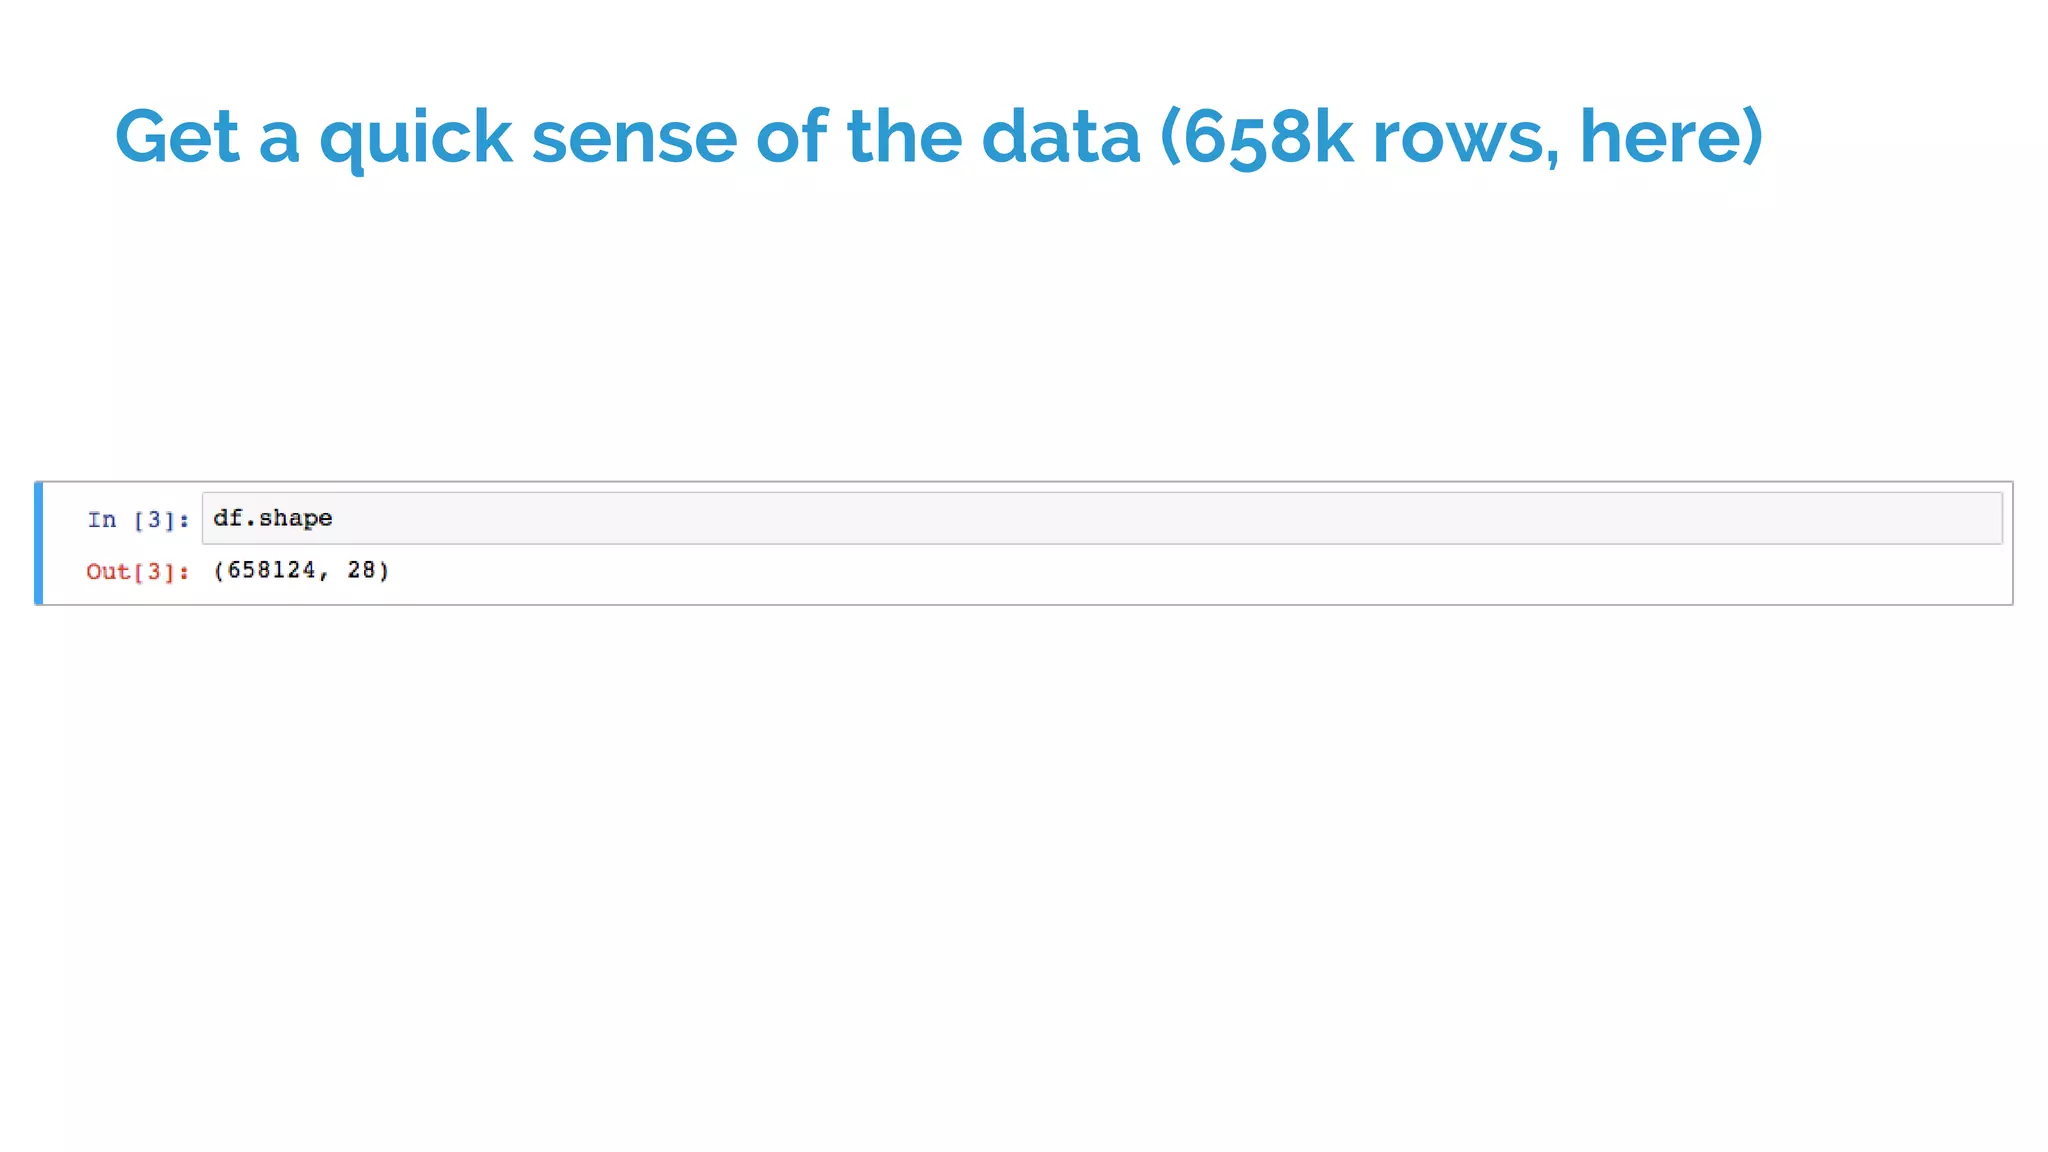
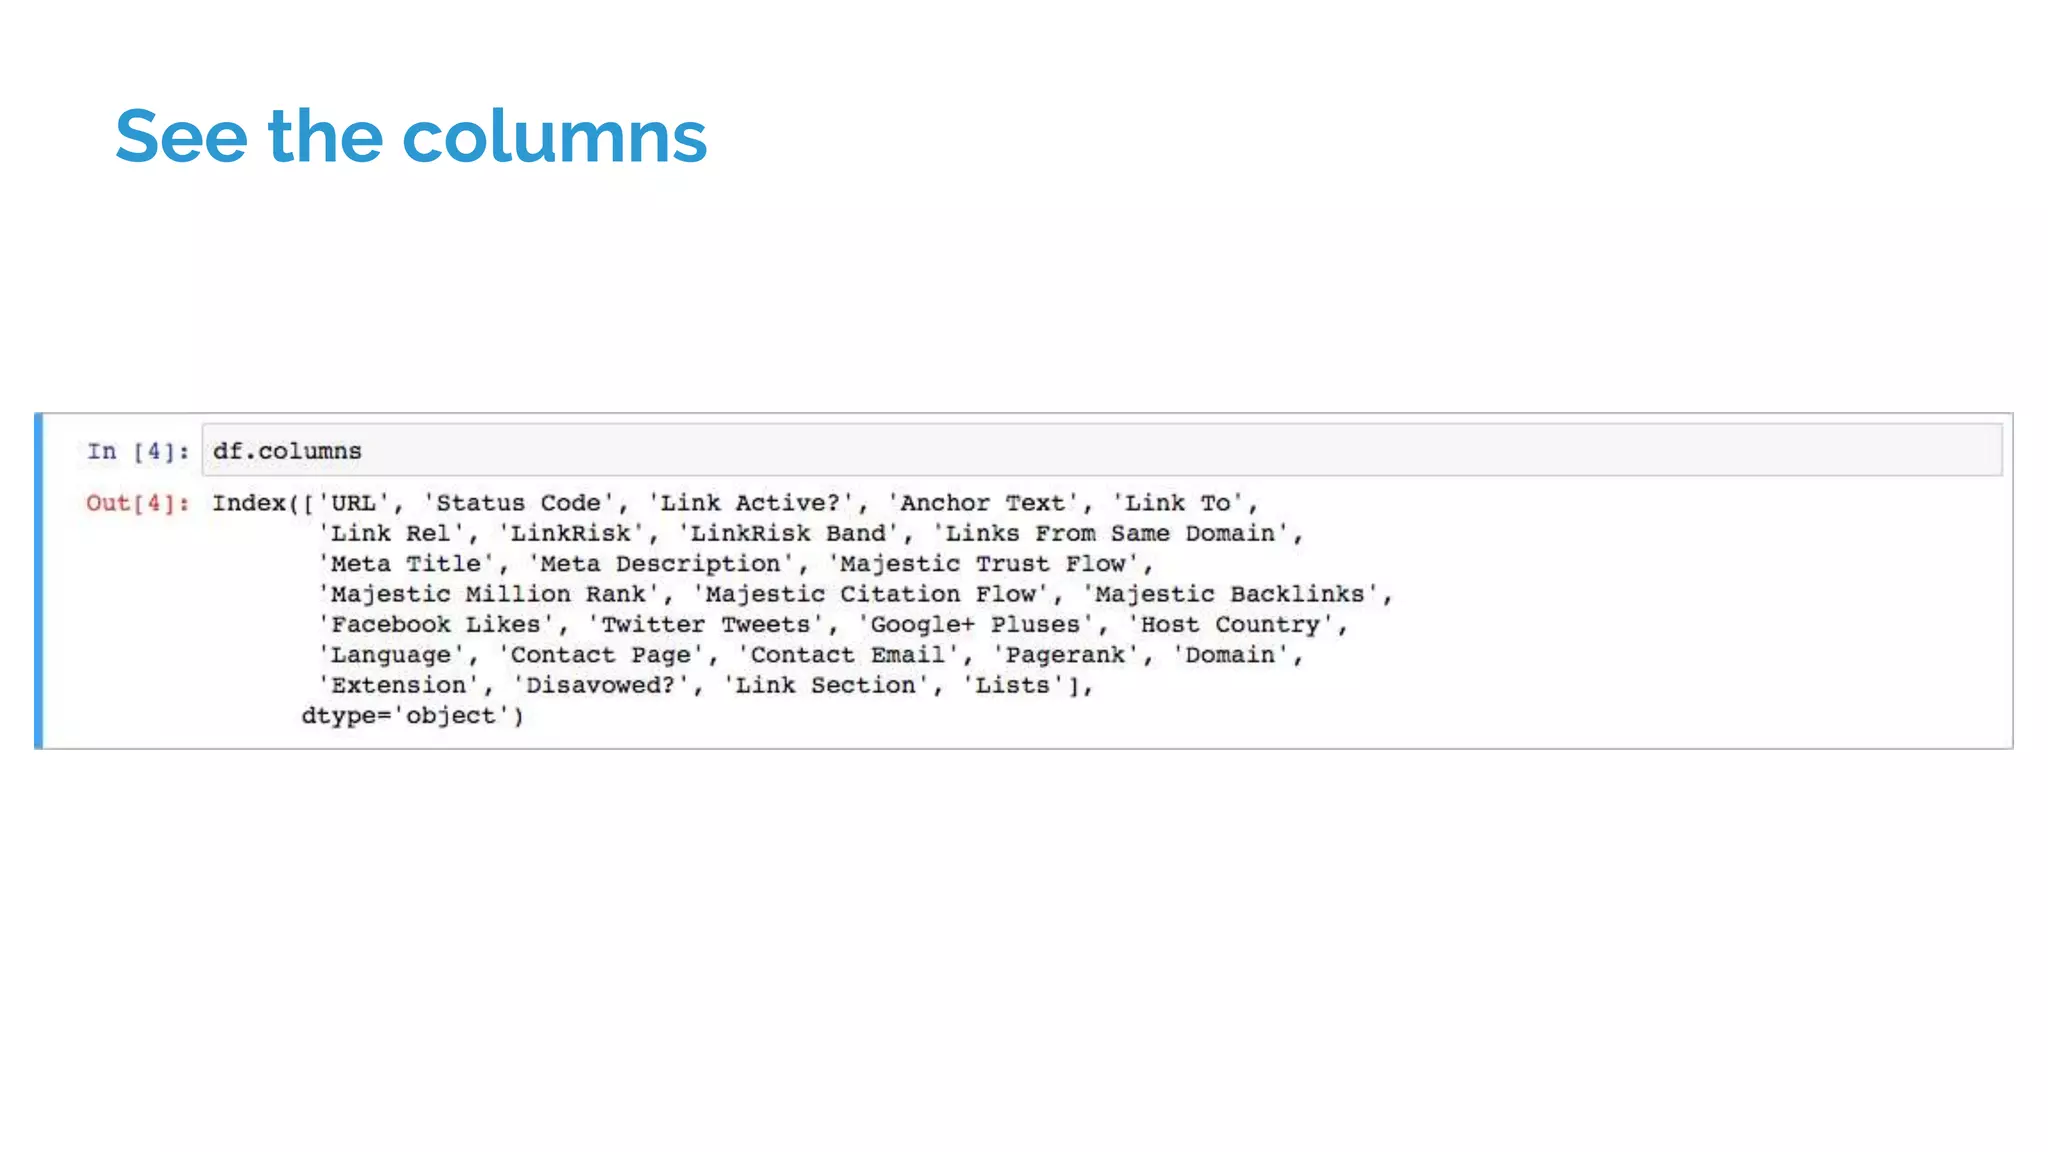
The document discusses using Pandas and Jupyter Notebook for data analysis in Python. It introduces Pandas as a data analysis library for working with tabular data like spreadsheets. The key points covered include: - Using Anaconda distribution for a complete Python data analysis environment - Opening Jupyter Notebook and creating cells to run Python code - Loading data from files into Pandas DataFrames for analysis - Filtering and exploring DataFrames using methods like df[] and Counter() - Examples of projects like gathering SEMRush data and custom tracking charts


![[null]Metapwn - Pwn at a puff by Prajwal Panchmahalkar](https://cdn.slidesharecdn.com/ss_thumbnails/metapwn-101219215353-phpapp01-thumbnail.jpg?width=640&height=640&fit=bounds)


![[DSC Europe 25] Jim Sterne - Adopting Generative AI Capabilities Into the Ent...](https://cdn.slidesharecdn.com/ss_thumbnails/sxhpofuorcagxsaulkmt-3-251204082258-7e66bc48-thumbnail.jpg?width=640&height=640&fit=bounds)


![[DSC Europe 25] Goran Obradovic - The Rise of Sovereign AI: Building the Regi...](https://cdn.slidesharecdn.com/ss_thumbnails/7nw2xxixrxqdxvrb5wca-6-251205085714-ab09a2ac-thumbnail.jpg?width=640&height=640&fit=bounds)
![[DSC Europe 25] Nikola Rajovic - Hardware Technologies Under the Hood: RISC-V...](https://cdn.slidesharecdn.com/ss_thumbnails/o2gptrmtoyqndgoshwgq-dsc2025-tenstorrent-rajovic-251205090438-814685f5-thumbnail.jpg?width=640&height=640&fit=bounds)


![[DSC Europe 25] Petar Zivanov - AI meets documents From chatbots to AI-powere...](https://cdn.slidesharecdn.com/ss_thumbnails/xer2bb6nrdc8pdpev0pc-8-251204082258-7c2fa4a1-thumbnail.jpg?width=640&height=640&fit=bounds)


![[DSC Europe 25] Marija Vlajkovic & Andrea Radonjanin - Integration of AI tool...](https://cdn.slidesharecdn.com/ss_thumbnails/qf1jrglttoc3bm8s3aop-final-integration-of-ai-tools-251208151905-394f3a6a-thumbnail.jpg?width=640&height=640&fit=bounds)

