Download as PDF, PPTX

![Series data structure
• 1-dimensional
import numpy as np
randn = np.random.randn
from pandas import *
s = Series(randn(3),
index=['a','b','c'])
s
a -0.889880
b 1.102135
c -2.187296
Friday, May 18, 2012](https://image.slidesharecdn.com/gettingstartedwithpandas-120518065234-phpapp02/85/Getting-started-with-pandas-6-320.jpg)
![Reindexing labels
>>> s
a -0.496848
b 0.607173
c -1.570596
>>> s.reindex(['c','b','a'])
c -1.570596
b 0.607173
a -0.496848
Friday, May 18, 2012](https://image.slidesharecdn.com/gettingstartedwithpandas-120518065234-phpapp02/85/Getting-started-with-pandas-8-320.jpg)
![Dataframe add column
>>> s
a -0.889880
b 1.102135
c -2.187296
>>> df['three'] = s * 3
>>> df
one two three
a 0.791886 -1.779760 -2.669640
b 1.214701 2.204269 3.306404
c 4.784264 -4.374592 -6.561888
Friday, May 18, 2012](https://image.slidesharecdn.com/gettingstartedwithpandas-120518065234-phpapp02/85/Getting-started-with-pandas-14-320.jpg)
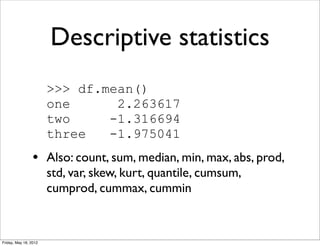

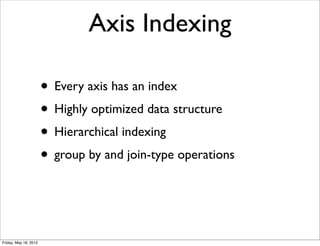
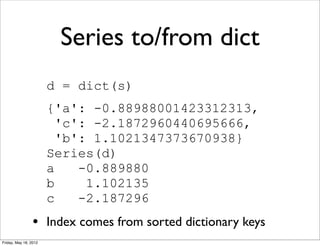
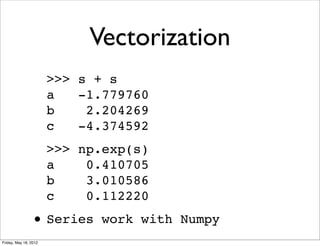
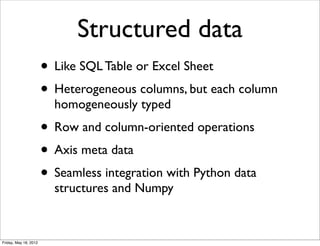
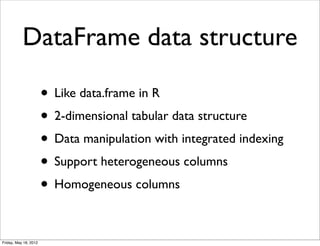
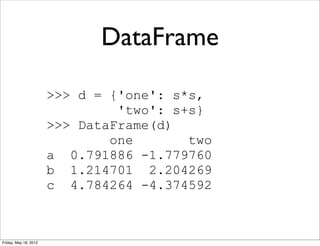
Pandas is a Python library for data analysis and manipulation of structured data. It allows working with time series, grouping data, merging datasets, and performing statistical computations. Pandas provides data structures like Series for 1D data and DataFrame for 2D data that make it easy to reindex, select subsets, and handle missing data. It integrates well with NumPy and Matplotlib for numerical processing and visualization.


![Getting Started with Apache Spark: Big Data Made Simple [Free Meetup]](https://cdn.slidesharecdn.com/ss_thumbnails/apachesparkgettingstarted-260203175547-8361bcc3-thumbnail.jpg?width=640&height=640&fit=bounds)


