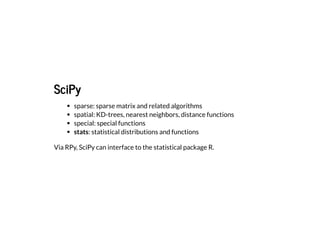
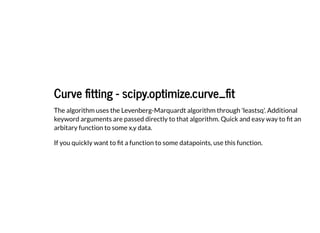
The document discusses Python modules for astronomical data analysis, particularly focusing on numerical computing and visualization using libraries such as NumPy, SciPy, and Matplotlib, as well as the Astropy ecosystem that consolidates various tools for handling astronomical data. It elaborates on functionalities including data input/output, hierarchical clustering, curve fitting, and optimization algorithms. The document serves as a comprehensive introduction to using these tools effectively for tasks in astronomy and astrophysics.


![Let's Start
Let's Start
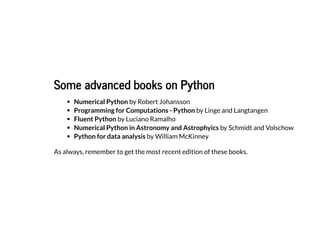
In [2]: # First we need the Table class to create table objects.
# The warning that will be flashed has so far not affected
# any functional features of Table class
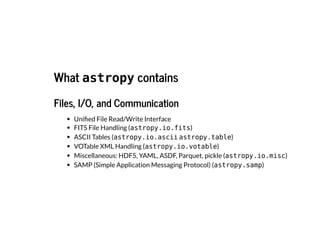
from astropy.table import Table
In [3]: # Next we need to create the Table object using a file.
demo_table = Table.read("demo.txt", format = "ascii")](https://image.slidesharecdn.com/lect8slides-240610073918-3846e167/85/Astronomy_python_data_Analysis_made_easy-pdf-19-320.jpg)
![Displaying Tables.
Displaying Tables.
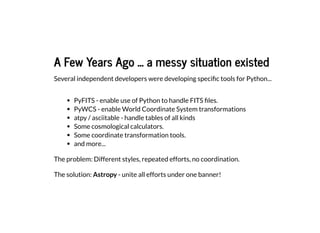
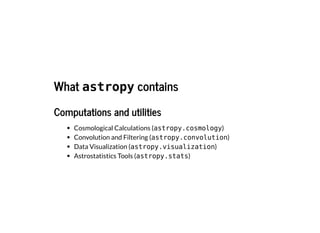
In [4]: print (demo_table)
name obs_date mag_b mag_v
---- ---------- ----- -----
M31 2012-01-02 17.0 17.5
M31 2012-01-02 17.1 17.4
M101 2012-01-02 15.1 13.5
M82 2012-02-14 16.2 14.5
M31 2012-02-14 16.9 17.3
M82 2012-02-14 15.2 15.5
M101 2012-02-14 15.0 13.6
M82 2012-03-26 15.7 16.5
M101 2012-03-26 15.1 13.5
M101 2012-03-26 14.8 14.3](https://image.slidesharecdn.com/lect8slides-240610073918-3846e167/85/Astronomy_python_data_Analysis_made_easy-pdf-21-320.jpg)
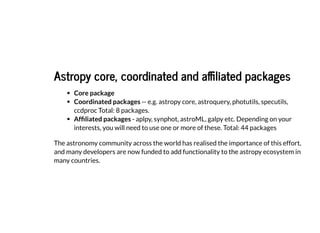
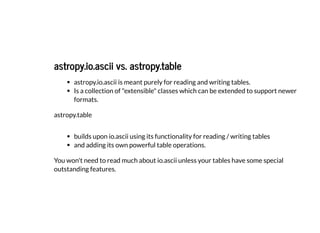
![In [5]: demo_table.pprint() # Does exactly the same thing.
# but you can supply options such as
# max_lines, max_width, show_unit, show_name
name obs_date mag_b mag_v
---- ---------- ----- -----
M31 2012-01-02 17.0 17.5
M31 2012-01-02 17.1 17.4
M101 2012-01-02 15.1 13.5
M82 2012-02-14 16.2 14.5
M31 2012-02-14 16.9 17.3
M82 2012-02-14 15.2 15.5
M101 2012-02-14 15.0 13.6
M82 2012-03-26 15.7 16.5
M101 2012-03-26 15.1 13.5
M101 2012-03-26 14.8 14.3](https://image.slidesharecdn.com/lect8slides-240610073918-3846e167/85/Astronomy_python_data_Analysis_made_easy-pdf-22-320.jpg)
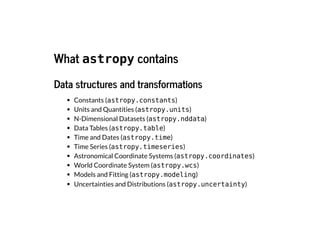
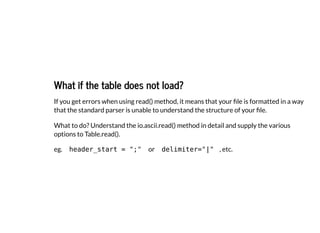
![In [6]: # In this example, we are suppressing column names from appearing.
demo_table.pprint(show_name=False)
M31 2012-01-02 17.0 17.5
M31 2012-01-02 17.1 17.4
M101 2012-01-02 15.1 13.5
M82 2012-02-14 16.2 14.5
M31 2012-02-14 16.9 17.3
M82 2012-02-14 15.2 15.5
M101 2012-02-14 15.0 13.6
M82 2012-03-26 15.7 16.5
M101 2012-03-26 15.1 13.5
M101 2012-03-26 14.8 14.3](https://image.slidesharecdn.com/lect8slides-240610073918-3846e167/85/Astronomy_python_data_Analysis_made_easy-pdf-23-320.jpg)
![Quickly Check Basic Properties of Loaded Table
Quickly Check Basic Properties of Loaded Table
In [7]: print (len(demo_table)) # Number of rows.
In [8]: print (demo_table.colnames) # The names of the columns.
You can also print any meta information, if available.
demo_table.meta
10
['name', 'obs_date', 'mag_b', 'mag_v']](https://image.slidesharecdn.com/lect8slides-240610073918-3846e167/85/Astronomy_python_data_Analysis_made_easy-pdf-25-320.jpg)
![Accessing Columns of the Table
Accessing Columns of the Table
In [9]: print (demo_table["name"]) # one column
name
----
M31
M31
M101
M82
M31
M82
M101
M82
M101
M101](https://image.slidesharecdn.com/lect8slides-240610073918-3846e167/85/Astronomy_python_data_Analysis_made_easy-pdf-26-320.jpg)
![In [10]: print (demo_table["name", "mag_b"]) # more than one column
name mag_b
---- -----
M31 17.0
M31 17.1
M101 15.1
M82 16.2
M31 16.9
M82 15.2
M101 15.0
M82 15.7
M101 15.1
M101 14.8](https://image.slidesharecdn.com/lect8slides-240610073918-3846e167/85/Astronomy_python_data_Analysis_made_easy-pdf-27-320.jpg)
![Accessing Rows in a Table
Accessing Rows in a Table
In [11]: print (demo_table[0])
In [12]: lines = demo_table.pformat() # a list of strings, each string a row, includes h
eader.
print (lines[2])
name obs_date mag_b mag_v
---- ---------- ----- -----
M31 2012-01-02 17.0 17.5
M31 2012-01-02 17.0 17.5](https://image.slidesharecdn.com/lect8slides-240610073918-3846e167/85/Astronomy_python_data_Analysis_made_easy-pdf-28-320.jpg)
![Individual Element Access
Individual Element Access
In [13]: demo_table["name"][0]
In [14]: demo_table[0]["name"] # also works the same as above.
Out[13]: 'M31'
Out[14]: 'M31'](https://image.slidesharecdn.com/lect8slides-240610073918-3846e167/85/Astronomy_python_data_Analysis_made_easy-pdf-29-320.jpg)
![Sub-sectioning Tables
Sub-sectioning Tables
In [15]: subsection_col = demo_table["name","mag_b"] # by column.
In [16]: subsection_row = demo_table[2:5] # by rows.
In [17]: subsection_row2 = demo_table[ [1,5,3] ]
In [18]: subsection_both = demo_table["name", "mag_b"] [1:5]](https://image.slidesharecdn.com/lect8slides-240610073918-3846e167/85/Astronomy_python_data_Analysis_made_easy-pdf-30-320.jpg)
![Changing elements inside a Table
Changing elements inside a Table
You know how to access columns, rows and individual elements.
Using = sign, you can assign the selected col, row or element another value.
So,
will both work.
demo_table["name"] = ... list of 10 names
demo_table["name"] = "SingleName"](https://image.slidesharecdn.com/lect8slides-240610073918-3846e167/85/Astronomy_python_data_Analysis_made_easy-pdf-31-320.jpg)
![In [19]: print (demo_table)
name obs_date mag_b mag_v
---- ---------- ----- -----
M31 2012-01-02 17.0 17.5
M31 2012-01-02 17.1 17.4
M101 2012-01-02 15.1 13.5
M82 2012-02-14 16.2 14.5
M31 2012-02-14 16.9 17.3
M82 2012-02-14 15.2 15.5
M101 2012-02-14 15.0 13.6
M82 2012-03-26 15.7 16.5
M101 2012-03-26 15.1 13.5
M101 2012-03-26 14.8 14.3](https://image.slidesharecdn.com/lect8slides-240610073918-3846e167/85/Astronomy_python_data_Analysis_made_easy-pdf-32-320.jpg)
![In [20]: demo_table["name"] = "X"
print (demo_table)
name obs_date mag_b mag_v
---- ---------- ----- -----
X 2012-01-02 17.0 17.5
X 2012-01-02 17.1 17.4
X 2012-01-02 15.1 13.5
X 2012-02-14 16.2 14.5
X 2012-02-14 16.9 17.3
X 2012-02-14 15.2 15.5
X 2012-02-14 15.0 13.6
X 2012-03-26 15.7 16.5
X 2012-03-26 15.1 13.5
X 2012-03-26 14.8 14.3](https://image.slidesharecdn.com/lect8slides-240610073918-3846e167/85/Astronomy_python_data_Analysis_made_easy-pdf-33-320.jpg)
![Adding New Columns
Adding New Columns
In [21]: # Method 1
demo_table["NewColumn"] = range(len(demo_table))
print (demo_table)
name obs_date mag_b mag_v NewColumn
---- ---------- ----- ----- ---------
X 2012-01-02 17.0 17.5 0
X 2012-01-02 17.1 17.4 1
X 2012-01-02 15.1 13.5 2
X 2012-02-14 16.2 14.5 3
X 2012-02-14 16.9 17.3 4
X 2012-02-14 15.2 15.5 5
X 2012-02-14 15.0 13.6 6
X 2012-03-26 15.7 16.5 7
X 2012-03-26 15.1 13.5 8
X 2012-03-26 14.8 14.3 9](https://image.slidesharecdn.com/lect8slides-240610073918-3846e167/85/Astronomy_python_data_Analysis_made_easy-pdf-34-320.jpg)
![In [22]: # Method 2, using Column Object
from astropy.table import Column
newcol = Column( data = range(len(demo_table)), name = "2ndNewColN")
demo_table.add_column(newcol, index = 0)
print (demo_table)
2ndNewColN name obs_date mag_b mag_v NewColumn
---------- ---- ---------- ----- ----- ---------
0 X 2012-01-02 17.0 17.5 0
1 X 2012-01-02 17.1 17.4 1
2 X 2012-01-02 15.1 13.5 2
3 X 2012-02-14 16.2 14.5 3
4 X 2012-02-14 16.9 17.3 4
5 X 2012-02-14 15.2 15.5 5
6 X 2012-02-14 15.0 13.6 6
7 X 2012-03-26 15.7 16.5 7
8 X 2012-03-26 15.1 13.5 8
9 X 2012-03-26 14.8 14.3 9](https://image.slidesharecdn.com/lect8slides-240610073918-3846e167/85/Astronomy_python_data_Analysis_made_easy-pdf-35-320.jpg)
![Removing Columns
Removing Columns
In [23]: demo_table.remove_columns(["NewColumn","2ndNewColN"])
print (demo_table)
name obs_date mag_b mag_v
---- ---------- ----- -----
X 2012-01-02 17.0 17.5
X 2012-01-02 17.1 17.4
X 2012-01-02 15.1 13.5
X 2012-02-14 16.2 14.5
X 2012-02-14 16.9 17.3
X 2012-02-14 15.2 15.5
X 2012-02-14 15.0 13.6
X 2012-03-26 15.7 16.5
X 2012-03-26 15.1 13.5
X 2012-03-26 14.8 14.3](https://image.slidesharecdn.com/lect8slides-240610073918-3846e167/85/Astronomy_python_data_Analysis_made_easy-pdf-36-320.jpg)
![For Rows
For Rows
Similar functions exist. Please read documentation for details. Or explore using iPython.
demo_table.remove_row(5)
demo_table.remove_rows( [5,6])
demo_table.remove_rows( slice(3,6) )](https://image.slidesharecdn.com/lect8slides-240610073918-3846e167/85/Astronomy_python_data_Analysis_made_easy-pdf-37-320.jpg)
![Table Sorting
Table Sorting
In [24]: demo_table = Table.read("demo.txt", format="ascii")
print (demo_table)
name obs_date mag_b mag_v
---- ---------- ----- -----
M31 2012-01-02 17.0 17.5
M31 2012-01-02 17.1 17.4
M101 2012-01-02 15.1 13.5
M82 2012-02-14 16.2 14.5
M31 2012-02-14 16.9 17.3
M82 2012-02-14 15.2 15.5
M101 2012-02-14 15.0 13.6
M82 2012-03-26 15.7 16.5
M101 2012-03-26 15.1 13.5
M101 2012-03-26 14.8 14.3](https://image.slidesharecdn.com/lect8slides-240610073918-3846e167/85/Astronomy_python_data_Analysis_made_easy-pdf-38-320.jpg)
![In [25]: demo_table.sort(["name", "mag_b"]) # sort by name, then magb
In [26]: print (demo_table)
name obs_date mag_b mag_v
---- ---------- ----- -----
M101 2012-03-26 14.8 14.3
M101 2012-02-14 15.0 13.6
M101 2012-01-02 15.1 13.5
M101 2012-03-26 15.1 13.5
M31 2012-02-14 16.9 17.3
M31 2012-01-02 17.0 17.5
M31 2012-01-02 17.1 17.4
M82 2012-02-14 15.2 15.5
M82 2012-03-26 15.7 16.5
M82 2012-02-14 16.2 14.5](https://image.slidesharecdn.com/lect8slides-240610073918-3846e167/85/Astronomy_python_data_Analysis_made_easy-pdf-39-320.jpg)
![In [27]: demo_table.reverse() # Reverse existing table. Descending order!
print (demo_table)
name obs_date mag_b mag_v
---- ---------- ----- -----
M82 2012-02-14 16.2 14.5
M82 2012-03-26 15.7 16.5
M82 2012-02-14 15.2 15.5
M31 2012-01-02 17.1 17.4
M31 2012-01-02 17.0 17.5
M31 2012-02-14 16.9 17.3
M101 2012-03-26 15.1 13.5
M101 2012-01-02 15.1 13.5
M101 2012-02-14 15.0 13.6
M101 2012-03-26 14.8 14.3](https://image.slidesharecdn.com/lect8slides-240610073918-3846e167/85/Astronomy_python_data_Analysis_made_easy-pdf-40-320.jpg)