Download to read offline

![Exercise 4
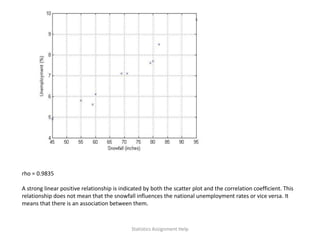
Answer questions (a) – (c) from 4.36 in your textbook.
Solution:
Here is the script and a scatterplot:
clear all;
close all;
clc;
snowfall = [45 59 82 80 71 60 55 69 79 95];
unemployment = [4.9 5.6 8.5 7.7 7.1 6.1 5.8 7.1 7.6 9.7];
% Scatterplot
plot(snowfall, unemployment, 'x');
grid;
xlabel('Snowfall (inches)');
ylabel('Unemployment (%)');
% Calculates the correlation coefficient
rho = corr(snowfall',unemployment');
Statistics Assignment Help](https://image.slidesharecdn.com/statisticsassignmenthelp-211113063819/85/Data-Analysis-Assignment-Help-8-320.jpg)

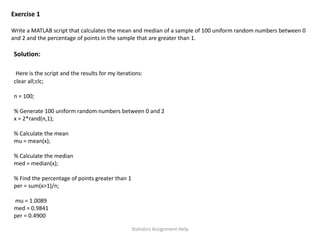
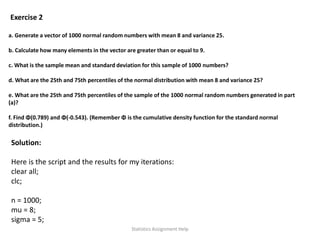
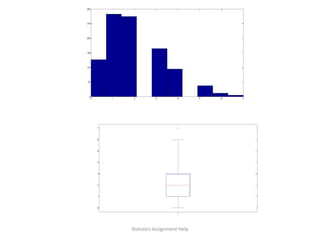
The document covers multiple statistical exercises involving MATLAB scripts, including the generation of random numbers, calculation of mean, median, percentiles, and correlation analysis. It provides specific results for exercises on uniform, normal, and Poisson distributions, along with data visualizations such as histograms and boxplots. Additionally, it discusses relationships using scatter plots and explores time-series analysis, highlighting trends and correlations within the data.