Downloaded 20 times
![IOSR Journal of Mechanical and Civil Engineering (IOSR-JMCE)
e-ISSN: 2278-1684,p-ISSN: 2320-334X, Volume 7, Issue 2 (May. - Jun. 2013), PP 24-27
www.iosrjournals.org
www.iosrjournals.org 24 | Page
Optimization of Process Parameters in Turning Operation of
AISI-1016 Alloy Steels with CBN Using Taguchi Method And
Anova
K.Mani lavanya1
, R.K.Suresh2
,A.Sushil Kumar Priya3
,V.Diwakar Reddy4
.
1
PG Scholar, 2
Asst. Professor (Sr), Department of Mechanical Engineering, Srikalahasteeswara Institute of
Technology, Srikalahasti.3
Department of Mechanical Engineering,Govt Polytechnic college, Gudur.
4
Department of Mechanical Engineering, S.V.U College of Engineering, S.V University, Tirupati.
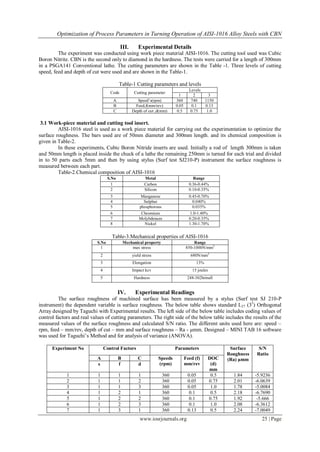
Abstract : This paper investigates the parameters affecting the roughness of surfaces produced in the turning
process for the material AISI-1016 Steel. Design of experiments was conducted for the analysis of the influence
of the turning parameters such as cutting speed, feed rate and depth of cut on the surface roughness. The
results of the machining experiments for AISI-1016 were used to characterize the main factors affecting
surface roughness by the Analysis of Variance (ANOVA) method. The feed rate was found to be the most
significant parameter influencing the surface roughness in the turning process.
Keywords - AISI-1016 steel, ANOVA, surface roughness, Taguchi method, turning.
I. INTRODUCTION
Today’s modern machining industries face challenge to achieve high quality in terms of work piece
dimensional accuracy, surface finish , less wear on cutting tools, economy of machining in terms of cost saving.
Surface roughness of the machined part is the most important criteria to judge the quality of operation. The
literature survey has revealed that several researchers have attempted to calculate the optimum cutting
conditions in a turning operation. Brewer and Rueda developed various monograms to assist in the selection of
optimum conditions [1]. Some of the other techniques which have been used to optimize the machining
parameters include goal programming [2] and geometrical programming [3] Now a day’s more attention is
given to accuracy and surface roughness of the product in the industries. Surface roughness is the most
important criteria in determining the machinability of the material .Surface roughness and dimensional accuracy
are the major factors needed to predict the machining performances of any machining operation [4].
Optimization of machining parameters increases the utility for machining parameters increases the utility for
machining economics and also increases the product quality to greater extent [5].
II. TAGUCHI METHOD
Taguchi’s parametric design is the effective tool for robust design it offers a simple and systematic
qualitative optimal design to a relatively low cost. The Taguchi method of off-line (Engineering) quality control
encompasses all stages of product/process development. However the key element for achieving high quality at
low cost is Design of Experiments (DOE). In this paper Taguchi’s (DOE) approach is used to analyze the effect
of process parameters like cutting speed, feed, and depth of cut on Surface Roughness of AISI-1016 work
material while machining with CBN tool and to obtain an optimal setting of these parameters that may result in
good surface finish.
2.1 ANOVA (Analysis Of Variance)
ANOVA can be useful for determining influence of any given input parameter from a series of
experimental results by design of experiments for machining process and it can be used to interpret experimental
data. Analysis of variance (ANOVA) is a collection of statistical models, and their associated procedures, in
which the observed variance in a particular variable is partitioned into components attributable to different
sources of variation. In its simplest form, ANOVA provides a statistical test of whether or not the means of
several groups are all equal, and therefore generalizes t-test to more than two groups.
ANOVA is used in the analysis of comparative experiments, those in which only the difference in
outcomes is of interest. The statistical significance of the experiment is determined by a ratio of two variances.
This ratio is independent of several possible alterations to the experimental observations: Adding a constant to
all observations does not alter significance. Multiplying all observations by a constant does not alter
significance. So ANOVA statistical significance results are independent of constant bias and scaling errors as
well as the units used in expressing observations.](https://image.slidesharecdn.com/d0722427-150115230935-conversion-gate01/85/Optimization-of-Process-Parameters-in-Turning-Operation-of-AISI-1016-Alloy-Steels-with-CBN-Using-Taguchi-Method-And-Anova-1-320.jpg)
![IOSR Journal of Mechanical and Civil Engineering (IOSR-JMCE)
e-ISSN: 2278-1684,p-ISSN: 2320-334X, Volume 7, Issue 2 (May. - Jun. 2013), PP 24-27
www.iosrjournals.org
www.iosrjournals.org 24 | Page
Optimization of Process Parameters in Turning Operation of
AISI-1016 Alloy Steels with CBN Using Taguchi Method And
Anova
K.Mani lavanya1
, R.K.Suresh2
,A.Sushil Kumar Priya3
,V.Diwakar Reddy4
.
1
PG Scholar, 2
Asst. Professor (Sr), Department of Mechanical Engineering, Srikalahasteeswara Institute of
Technology, Srikalahasti.3
Department of Mechanical Engineering,Govt Polytechnic college, Gudur.
4
Department of Mechanical Engineering, S.V.U College of Engineering, S.V University, Tirupati.
Abstract : This paper investigates the parameters affecting the roughness of surfaces produced in the turning
process for the material AISI-1016 Steel. Design of experiments was conducted for the analysis of the influence
of the turning parameters such as cutting speed, feed rate and depth of cut on the surface roughness. The
results of the machining experiments for AISI-1016 were used to characterize the main factors affecting
surface roughness by the Analysis of Variance (ANOVA) method. The feed rate was found to be the most
significant parameter influencing the surface roughness in the turning process.
Keywords - AISI-1016 steel, ANOVA, surface roughness, Taguchi method, turning.
I. INTRODUCTION
Today’s modern machining industries face challenge to achieve high quality in terms of work piece
dimensional accuracy, surface finish , less wear on cutting tools, economy of machining in terms of cost saving.
Surface roughness of the machined part is the most important criteria to judge the quality of operation. The
literature survey has revealed that several researchers have attempted to calculate the optimum cutting
conditions in a turning operation. Brewer and Rueda developed various monograms to assist in the selection of
optimum conditions [1]. Some of the other techniques which have been used to optimize the machining
parameters include goal programming [2] and geometrical programming [3] Now a day’s more attention is
given to accuracy and surface roughness of the product in the industries. Surface roughness is the most
important criteria in determining the machinability of the material .Surface roughness and dimensional accuracy
are the major factors needed to predict the machining performances of any machining operation [4].
Optimization of machining parameters increases the utility for machining parameters increases the utility for
machining economics and also increases the product quality to greater extent [5].
II. TAGUCHI METHOD
Taguchi’s parametric design is the effective tool for robust design it offers a simple and systematic
qualitative optimal design to a relatively low cost. The Taguchi method of off-line (Engineering) quality control
encompasses all stages of product/process development. However the key element for achieving high quality at
low cost is Design of Experiments (DOE). In this paper Taguchi’s (DOE) approach is used to analyze the effect
of process parameters like cutting speed, feed, and depth of cut on Surface Roughness of AISI-1016 work
material while machining with CBN tool and to obtain an optimal setting of these parameters that may result in
good surface finish.
2.1 ANOVA (Analysis Of Variance)
ANOVA can be useful for determining influence of any given input parameter from a series of
experimental results by design of experiments for machining process and it can be used to interpret experimental
data. Analysis of variance (ANOVA) is a collection of statistical models, and their associated procedures, in
which the observed variance in a particular variable is partitioned into components attributable to different
sources of variation. In its simplest form, ANOVA provides a statistical test of whether or not the means of
several groups are all equal, and therefore generalizes t-test to more than two groups.
ANOVA is used in the analysis of comparative experiments, those in which only the difference in
outcomes is of interest. The statistical significance of the experiment is determined by a ratio of two variances.
This ratio is independent of several possible alterations to the experimental observations: Adding a constant to
all observations does not alter significance. Multiplying all observations by a constant does not alter
significance. So ANOVA statistical significance results are independent of constant bias and scaling errors as
well as the units used in expressing observations.](https://image.slidesharecdn.com/d0722427-150115230935-conversion-gate01/75/Optimization-of-Process-Parameters-in-Turning-Operation-of-AISI-1016-Alloy-Steels-with-CBN-Using-Taguchi-Method-And-Anova-1-2048.jpg)
![Optimization of Process Parameters in Turning Operation of AISI-1016 Alloy Steels with CBN
www.iosrjournals.org 27 | Page
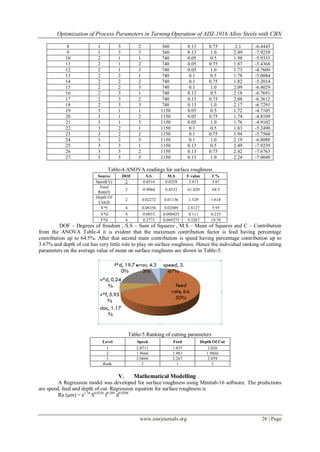
VI. MINI TAB RESULTS
1150740360
2.2
2.1
2.0
1.9
1.8
0.130.100.05
1.000.750.50
2.2
2.1
2.0
1.9
1.8
speed
MeanofMeans
feed
doc
Main Effects Plot for Means
Data Means
Effect of Turning Parameters on Surface Roughness
1150740360
-5.0
-5.5
-6.0
-6.5
-7.0
0.130.100.05
1.000.750.50
-5.0
-5.5
-6.0
-6.5
-7.0
speed
MeanofSNratios
feed
doc
Main Effects Plot for SN ratios
Data Means
Signal-to-noise: Smaller is better
S/N Ratio values for Surface Roughness
VII. CONCLUSION
Following are the conclusions drawn based on the test conducted on AISI 1016 alloy during turning operation
with Cubic Boron Nitride.
1. From the results obtained a Regression Model has been developed for Surface Roughness. From this
equations we can predict the value of Surface Roughness if the values of Cutting Speed, Feed and Depth of
Cut are known.
2. From ANOVA Table and Response Table for Signal to noise ratios, based on the ranking it can be
concluded that Speed has a greater influence on the Surface Roughness followed by Feed. Depth of Cut had
least influence on Surface Roughness.
3. The validation experiment confirmed that the error occurred was less than that 2.0% between equation and
actual value.
4. The optimal settings of process parameters for optimal Surafce Roughness are:
Speed(740), Feed (0.05) and DOC (1.0).This research gives us how Taguchi’s parameter design to
obtain optimum condition with lowest cost, minimum number of experiments and Industrial Engineers can use
this method. The research can be extended for other materials using Tool Nose Radius, Lubricant Material
Hardness etc as parameters.
REFERENCES
[1] E.J.A Armarego and R.H Brown, The machining of metals prentice Hall, 1969.
[2] R.M Sundaram, “An application of Goal programming technique in metal cutting”,Int.J.Prod.Res.,vol.16,NO5,1978,PP375-382
[3] P.G.Petropoulos “optimum solution of machining rate variable by Geometric programming”, Int.J.Prod.Res
,vol.11,NO,4,1973.PP.305-314
[4] A.Mital, M.Mehta, “surface roughness Prediction models for fine turning”, International journal of production research 26(1988)
1861 -1867
[5] R.Azouzi,M.Guillot, “on-line optimization of the turning using an inverse process neuro controller transalation” ASME , journal of
manufacturing science and engineering 120 (feb)(1998)101-107.](https://image.slidesharecdn.com/d0722427-150115230935-conversion-gate01/85/Optimization-of-Process-Parameters-in-Turning-Operation-of-AISI-1016-Alloy-Steels-with-CBN-Using-Taguchi-Method-And-Anova-4-320.jpg)

This paper explores the optimization of machining parameters affecting surface roughness in the turning operation of AISI-1016 steel using Taguchi method and ANOVA. The study identifies feed rate as the most significant factor influencing surface roughness, followed by cutting speed, while depth of cut has minimal impact. The optimal settings for achieving the best surface finish are determined to be a speed of 740 RPM, a feed rate of 0.05 mm/rev, and a depth of cut of 1.0 mm.