Downloaded 12 times
![IJRET: International Journal of Research in Engineering and Technology eISSN: 2319-1163 | pISSN: 2321-7308
_______________________________________________________________________________________
Volume: 03 Issue: 02 | Feb-2014, Available @ http://www.ijret.org 449
PARAMETRIC ANALYSIS AND MULTI OBJECTIVE OPTIMIZATION
OF CUTTING PARAMETERS IN TURNING OPERATION OF AISI 4340
ALLOY STEEL WITH CVD CUTTING TOOL
M. Adinarayana1
, G. Prasanthi2
, G. Krishnaiah3
1
Assistant Professor, Department of mechanical Engineering, Sir Vishveshwaraiah Institute of Science & Technology
Angallu, Madanapalli
2
Professor, Department of Mechanical Engineering, JNTUA College of Engineering, JNTUA, Anantapuramu
3
Professor (retire), Department of Mechanical Engineering, SVU College of Engineering, S.V.University, Tirupati
Abstract
Modern manufacturers, seeking to remain competitive in the market, rely on their Manufacturing engineers and production personnel
to quickly and effectively set up manufacturing processes for new products. This paper presents the multi response optimization of
turning parameters for Turning on AISI 4340 Alloy Steel. Experiments are designed and conducted based on Taguchi’s L27
Orthogonal array design. This paper discusses an investigation into the use of Taguchi parameter Design and Regression analysis to
predict and optimize the Surface Roughness, Metal Removal Rate and Power Consumption in turning operations using CVD Cutting
Tool. The Analysis of Variance (ANOVA) is employed to analyze the influence of Process Parameters during Turning. This paper also
remarks the advantages of multi-objective optimization approach over the single-objective one. The useful results have been obtained
by this research for other similar type of studies and can be helpful for further research works on the Tool life and Vibration of tools
etc.
Keywords: Turning, Ra, MRR, PC, Taguchi, Anova etc…
--------------------------------------------------------------------***---------------------------------------------------------------------
1. INTRODUCTION
The production of super alloys, high hard and smart materials
have become extremely essential to satisfy the design
requirements for critical equipments, aerospace and defense
industries. The machining of such materials has always been a
great challenge before the production engineer [1].
EN24 is a medium-carbon low-alloy steel and finds its typical
applications in the manufacturing of automobile and machine
tool parts. Properties of EN24 steel, like low specific heat, and
tendency to strain-harden and diffuse between tool and work
material, give rise to certain problems in its machining such as
large cutting forces, high cutting-tool temperatures, poor surface
finish and built-up-edge formation. This material is thus
difficult to machine [2]. The proper selection of cutting tool
material has also different advantages such as reducing the
manufacturing cost and lead time, machining more difficult
materials, moving to unmanned machining operations,
improving surface integrity and achieving high metal removal
rates. Coating provides Improved lubrication at the chip-tool
and work-tool interface to reduce friction and consequently to
reduce the temperatures at the cutting edge. Coated carbides
tools ensure higher wear resistance, lower heat generation and
lower cutting forces, thus enabling higher cutting speeds than
uncoated carbides [3].
The huge amount of money spent on any one class of cutting
tool is spent on turning. Therefore, from view point of cost and
productivity, modeling and optimization of turning process are
extremely important for the manufacturing industry [4]. The
difficulties in optimization operations made the determination of
cutting parameters an important and complex case [5]. To
maintain the desired quality of machining products, to reduce
the machining cost and to improve the machining effectiveness,
it is vey important to select the optimal machining parameters
when the Machine tools are selected. Thereafter, an
Optimization Technique is used to search the optimal control
parameter setting for the desired response [6]. Optimization of
Machining parameters increases the utility for machining
economics and also increases the product quality to greater
extent [7].
The objective of this experimental investigation is to ascertain
the effects of cutting speed, feed rate, and depth of cut on
Surface Roughness, Material Removal Rate and Power
Consumption in Turning of AISI 4340 medium Alloy steel. The
survey showed that there are many papers in the field of turning
parameters optimization, but there is a lack in studies of the
Response Power Consumption Optimization in Turning
operation which is very important aspect in machining
operation. Power Consumption plays vital role. One its cuts
down the Cost per product, secondly the environmental impact](https://image.slidesharecdn.com/parametricanalysisandmultiobjectiveoptimizationofcuttingparametersinturningoperationofaisi4340alloys-160813074136/75/Parametric-analysis-and-multi-objective-optimization-of-cutting-parameters-in-turning-operation-of-aisi-4340-alloy-steel-with-cvd-cutting-tool-1-2048.jpg)
![IJRET: International Journal of Research in Engineering and Technology eISSN: 2319-1163 | pISSN: 2321-7308
_______________________________________________________________________________________
Volume: 03 Issue: 02 | Feb-2014, Available @ http://www.ijret.org 450
by reducing the amount of carbon emissions that are created in
using by electrical energy and finally the minimization of Power
Consumption. Design of experiment techniques, i.e. Taguchi„s
technique have been used to accomplish the objective. L27
orthogonal array used for conducting the experiments. And
ANOVA technique is employed to analyze the percentage
contribution and influence of Process Parameters.
2. MATERIALS AND METHODS:
2.1Specification of Work Material:
The work material used for the present study is AISI 4340 alloy
steel. The chemical composition of the work material is shown
in Table 1.
Table 1: Specification of work material
Element C Si Mn S P Cr Ni Mo
Composition% 0.38 0.15 0.60 0.040 0.035 0.70 1.65 0.20
2.2 Process Parameters
Table 2: Process parameters and their levels
Level Speed (s)
(rpm)
Feed rate(f)
(mm/rev)
Depth of cut(d)
(mm)
1 740 0.09 0.15
2 580 0.07 0.10
3 450 0.05 0.05
2.3 Taguchi Method
The Taguchi experimental design method is a well-known,
unique and powerful technique for product or process quality
improvement. It is widely used for analysis of experiment and
product or process optimization. Taguchi has developed a
methodology for the application of factorial design experiments
that has taken the design of experiments from the exclusive
world of the statistician and brought it more fully into the world
of manufacturing [13]. Traditional experimental design
methods are very complicated and difficult to use. Additionally,
these methods require a large number of experiments when the
number of process parameters increases. In order to minimize
the number of experiments required, Taguchi experimental
design method, a powerful tool for designing high-quality
system. This method uses a special design of orthogonal arrays
to study the entire parameter space with minimum number of
experiments [2]. Taguchi strategy is the conceptual framework
or structure for planning a product or process design
experiment.
2.4 Analysis of Variance (ANOVA)
Analysis of variance (ANOVA) is a statistical method for
determining the existence of differences among several
population means. While the aim of ANOVA is the detect
differences among several populations means, the technique
requires the analysis of different forms of variance associated
with the random samples under study- hence the name analysis
of variance. The original ideas analysis of variance was
developed by the English Statistician Sir Ronald A. Fisher
during the first part of this century. Much of the early work in
this area dealt with agricultural experiments where crops were
given different treatments, such as being grown using different
kinds of fertilizers. The researchers wanted to determine
whether all treatments under study were equally effective or
whether some treatments were better than others.
ANOVA is used to determine the influence of any given process
parameters from a series of experimental results by design of
experiments and it can be used to interpret experimental data.
Since there will be large number of process variables which
control the process, some mathematical model are require to
represent the process. However these models are to be develop
using only the significant parameters which influences the
process, rather than including all the parameters.
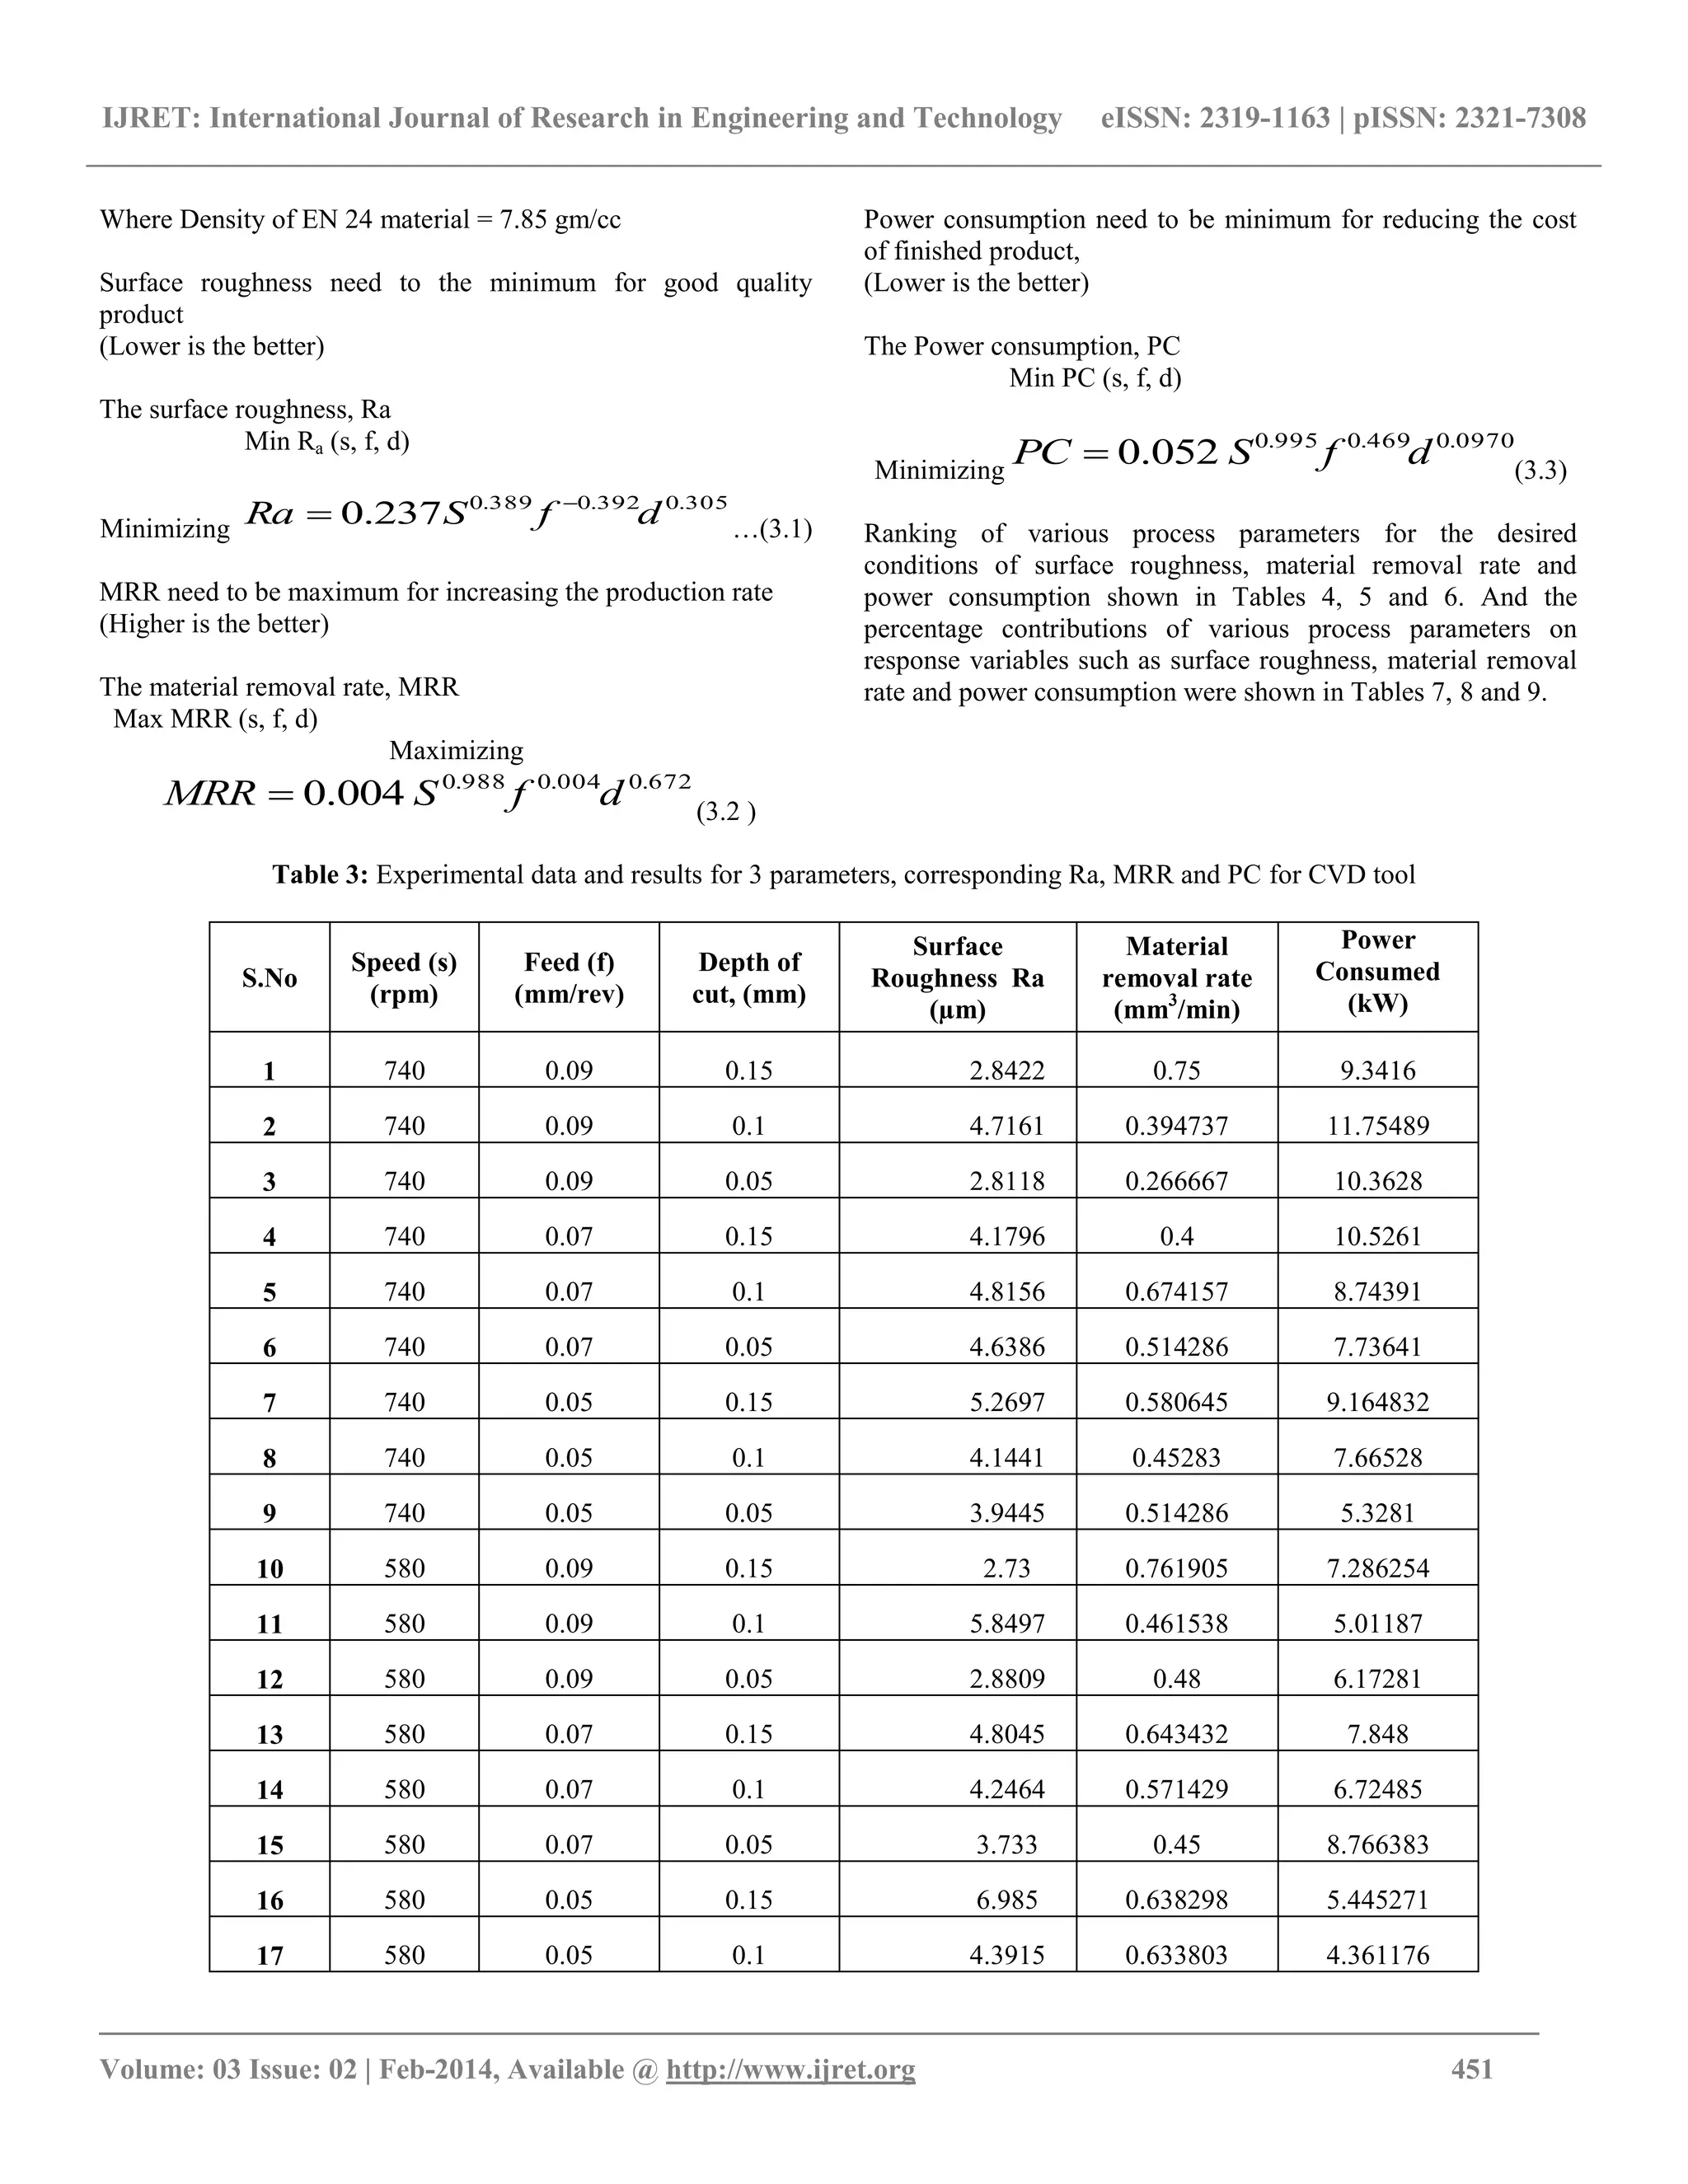
3. EXPERIMENTATION AND MATHEMATICAL
MODELING:
The experiment is conducted for Dry turning operation of using
AISI 4340 Alloy steel as work material and CVD as tool
material on a conventional lathe PSG A141. The tests were
carried for a 500 mm length work material. The process
parameters used as spindle speed (rpm), feed (mm/rev), depth of
cut (mm). The response variables are Surface roughness,
material removal rate and power consumption, The
experimental results were recorded in Table 3. Surface
roughness of machined surface has been measured by a stylus
(surf test SJ201-P) instrument and power consumption is
measured by using Watt meter. Material removal rate is
calculated by following formula.
MRR = (Initial weight - final weight) / Density x Time](https://image.slidesharecdn.com/parametricanalysisandmultiobjectiveoptimizationofcuttingparametersinturningoperationofaisi4340alloys-160813074136/75/Parametric-analysis-and-multi-objective-optimization-of-cutting-parameters-in-turning-operation-of-aisi-4340-alloy-steel-with-cvd-cutting-tool-2-2048.jpg)
![IJRET: International Journal of Research in Engineering and Technology eISSN: 2319-1163 | pISSN: 2321-7308
_______________________________________________________________________________________
Volume: 03 Issue: 02 | Feb-2014, Available @ http://www.ijret.org 456
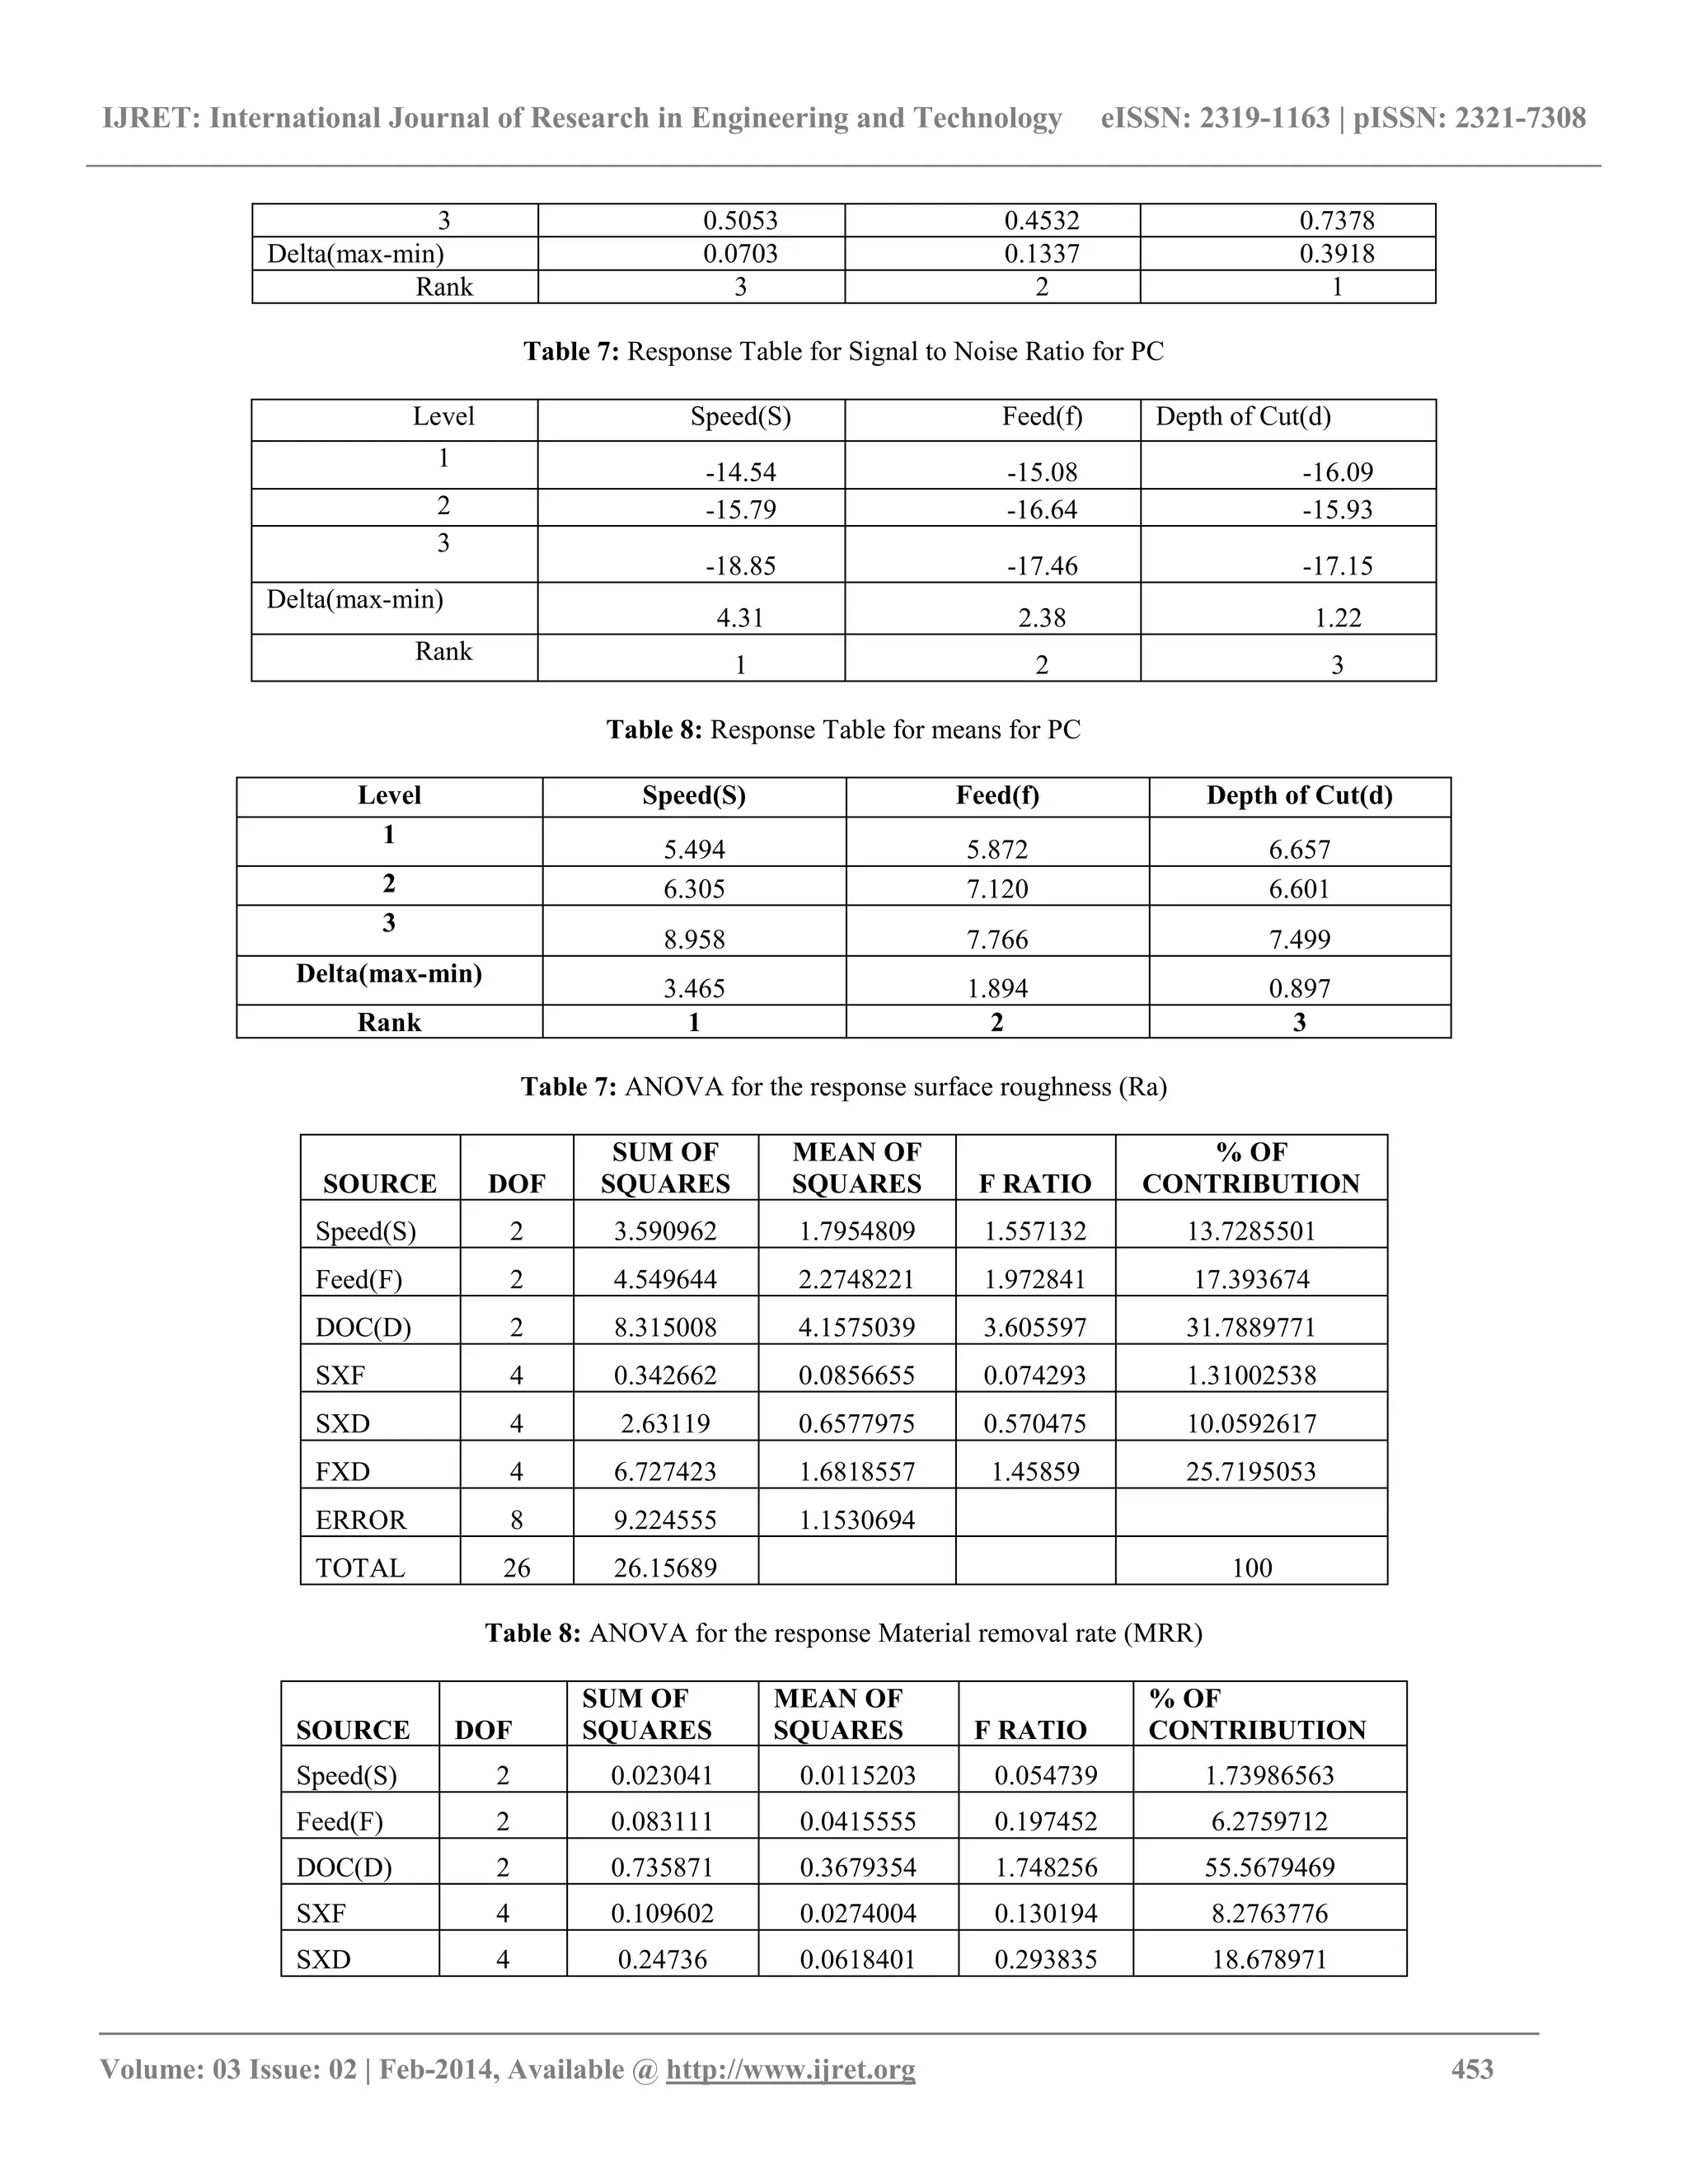
(3) Analysis of Variance (ANOVA) is done and found that it
shows The depth of cut has great influence for the
Response surface roughness (31.78%), Speed has great
Influence for the response Material removal rate
(55.56%), Depth of cut has great influence for the
Response Power consumption (66.75%).
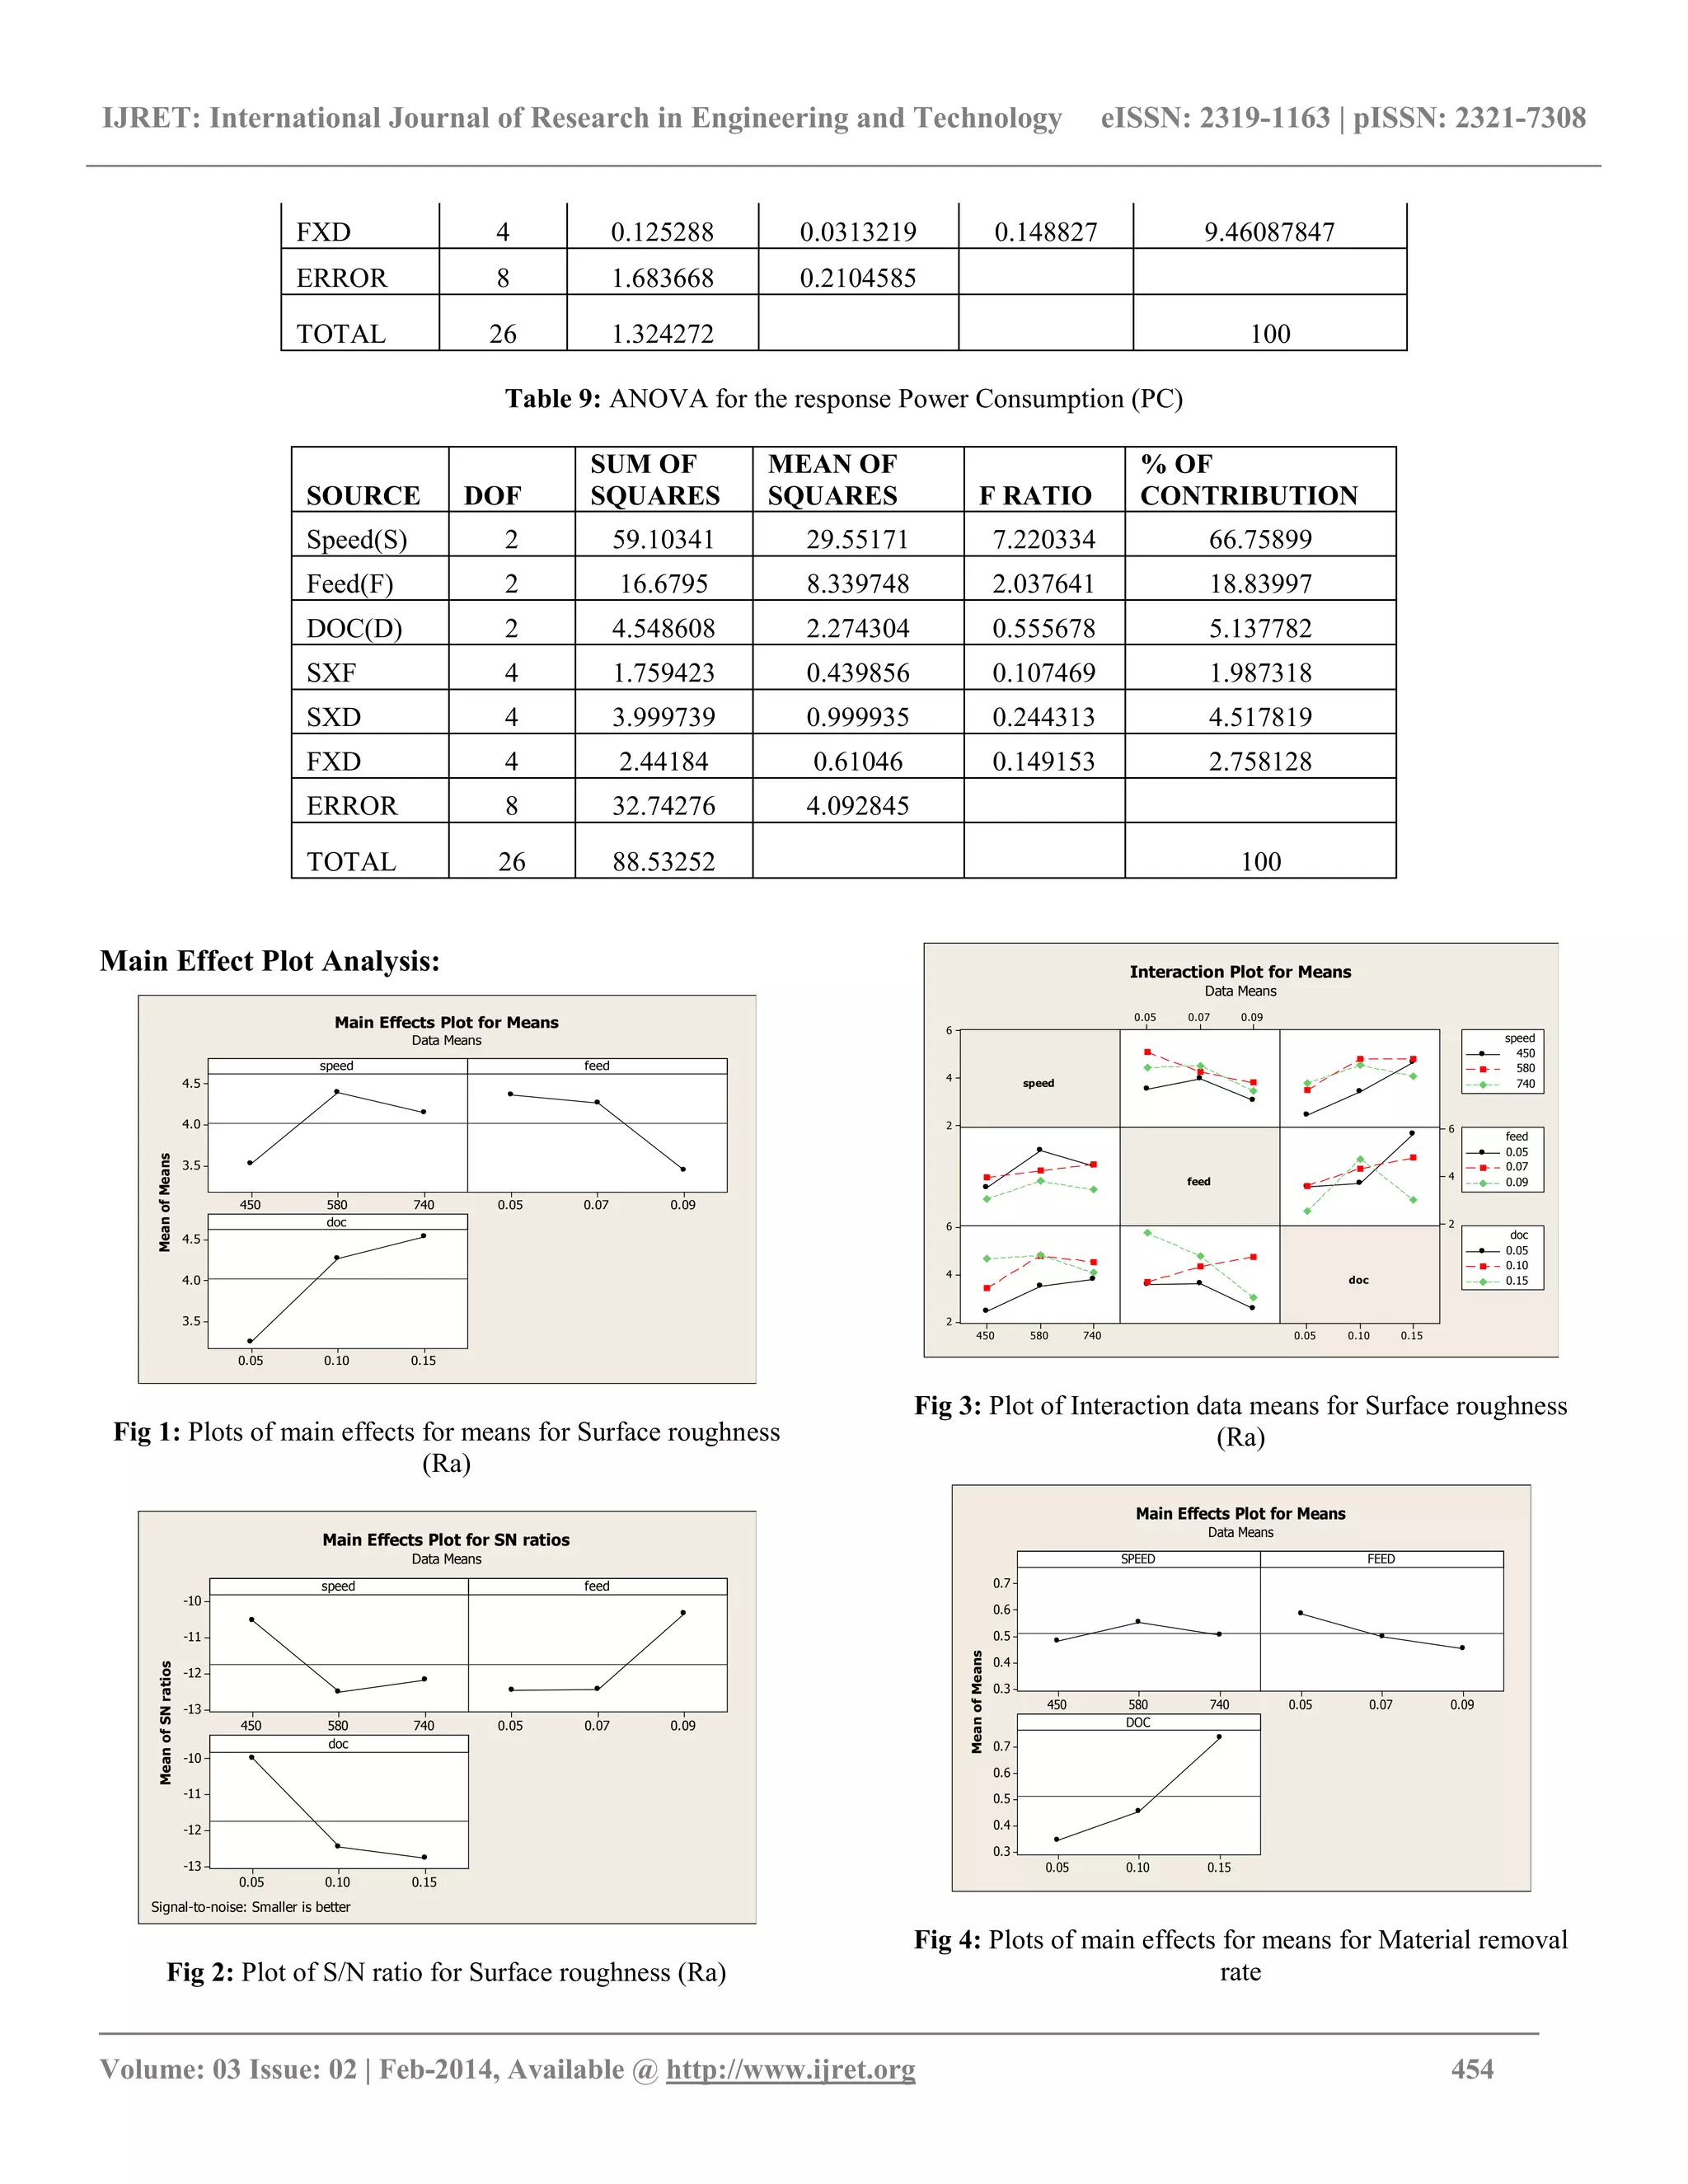
(4) The interaction of cutting parameters is also studied for
the three responses Ra, MRR and PC as follows
REFERENCES
[1] Nikunj R Modh, G. D. Mistry, K. B. Rathod/
International Journal of Engineering Research and
Applications ,Vol. 1, Issue 3, pp.483-489.
[2] Mahendra korat, Neeraj Agarwal, Optimization of
different Machining parameters of En 24 Alloy steel in
CNC Turning by use of Taguchi method”. International
journal of engineering research and application. ISSN:
2248-9622.
[3] Ashok kumar sahoo and Bidyadhar sahoo/ International
Journal of Industrial Engineering and computations 2
(2011) 819-830.
[4] B.Y.Lee, H.S.Liu Y.S.Tarng/Journal of Material
Processing Technology 74 (1998) 149-157.
[5] Adnan Jameel , Mohamad Minhat and
Md.Nizam/International Journal of Scientific and
Research Publications, volume 3, Issue 5, May 2013.
[6] Ruben Phipon and B.B.Pardhan/IOSR Journal of
engineering /Volume 2, Isuue 9 (september2012),
PP106-115.
[7] H.M.Somashekara and Dr.N.Lakshmana Swamy/
International Journal of Engineering Science and
Technology/ Volume 4 No.5 May 2012.
[8] Ciftci I., 2006. Machining of austenitic Stainless steels
using CVD multi-layer coated cemented carbide
tools, Tribology International, Vol.39, No. 6, pp. 565-
569.
[9] Raju Shrihari Pawade and Suhas S. Joshi., 2011. Multi-
objective optimization of surface roughness and cutting
forces in highspeed turning of Inconel 718 using
Taguchi grey relational analysis (TGRA), International
Journal of Advanced Manufacturing Technology, DOI
10.1007/s00170-011-3183-z.
[10] Gusri A.I., Che Hassan C.H., Jaharah A.G., Yanuar
B.1, Yasir A.1, Nagi A, Application Of Taguchi
method in Optimizing Turning Parameters of Titanium
Alloy, Seminar on Engineering Mathematics, 2008
Engineering Mathematics Group.
[11] Farhad Kolahan, Mohsen Manoochehri, Abbas
Hosseini, “Simultaneous Optimization of Machining
Parameters and Tool Geometry Specifications in
Turning Operation of AISI1045 Steel,” World
Academy of Science, Engineering and Technology 74
2011.
[12] Sijo M.T, Biju.N, “Taguchi Method for Optimization
of Cutting Parameters in Turning Operations,” Proc. of.
Int. Conf. on Advances in Mechanical Engineering
2010.
[13] S.R.DAS, R.P.NAYAK,D.DHUPAL/International
Journal of Lean Thinking Volume3, Issue 2(December
2012).
Responses Input parameters
Speed(rpm) Feed(mm/
rev)
DOC(m
m)
Ra (min) 580 0.05 0.15
MRR(max) 580 0.07 0.15
PC (min) 740 0.09 0.15
Responses INTERACTIONS (%)
S x F S x D F x D
Ra 1.31 10.05 25.71
MRR 8.27 18.67 9.46
PC 1.98 4.51 2.75](https://image.slidesharecdn.com/parametricanalysisandmultiobjectiveoptimizationofcuttingparametersinturningoperationofaisi4340alloys-160813074136/75/Parametric-analysis-and-multi-objective-optimization-of-cutting-parameters-in-turning-operation-of-aisi-4340-alloy-steel-with-cvd-cutting-tool-8-2048.jpg)

This document discusses an investigation into optimizing cutting parameters in turning AISI 4340 alloy steel with CVD cutting tools. Experiments were designed using Taguchi's L27 orthogonal array to evaluate the effects of cutting speed, feed rate, and depth of cut on surface roughness, material removal rate, and power consumption. Analysis of variance (ANOVA) was used to analyze the influence of each parameter. The speed was found to be the most influential parameter for surface roughness and power consumption, while depth of cut had the greatest effect on material removal rate and power consumption. Optimizing all three responses simultaneously was found to provide benefits over optimizing single responses.