Downloaded 1,136 times
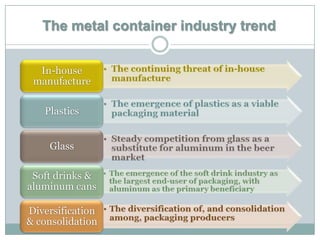
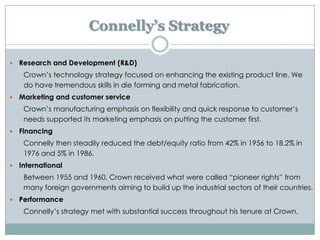
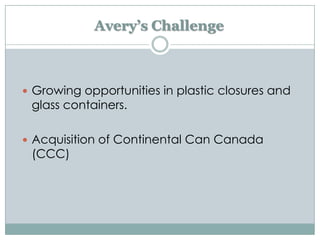
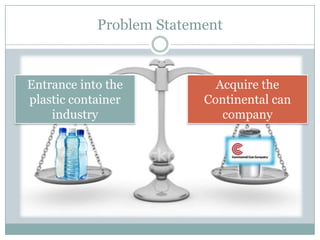

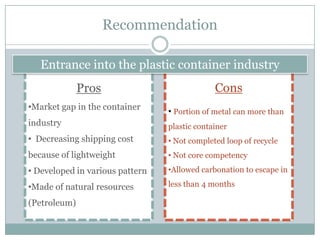
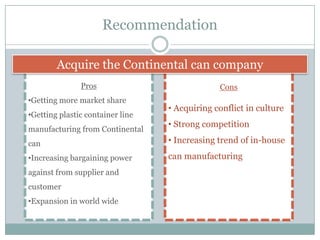

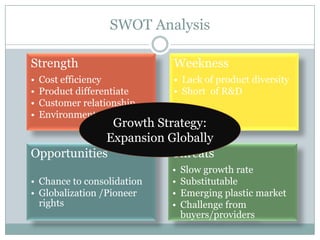
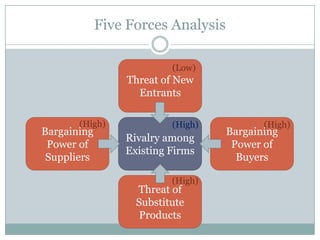
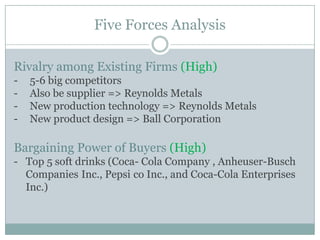
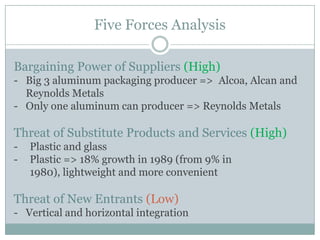
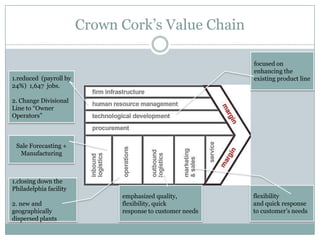
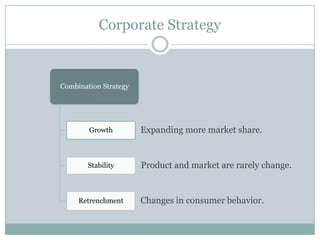
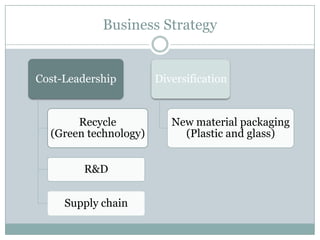
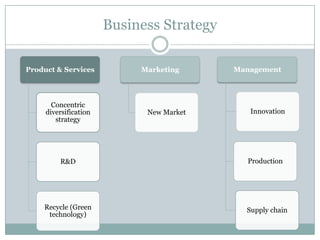
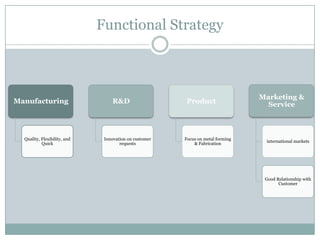

The document provides background information on Crown Cork & Seal in 1989. It discusses the metal container industry structure, trends towards in-house manufacturing, plastics, glass, and aluminum cans. It also profiles Crown Cork & Seal's history, challenges under new leadership, competitors, and recommendations for entering plastics and acquiring Continental Can. Analysis includes a SWOT analysis, 5 forces analysis, value chain analysis, and corporate, business, and functional strategies.


![Technology Management and Strategy [Part IV]](https://cdn.slidesharecdn.com/ss_thumbnails/technologymanagementandstrategypartiv-140803030243-phpapp02-thumbnail.jpg?width=640&height=640&fit=bounds)


