Downloaded 955 times
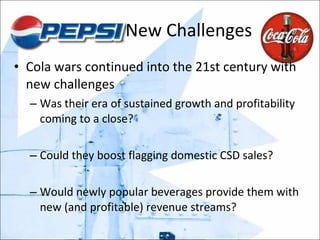
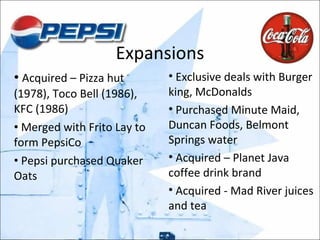
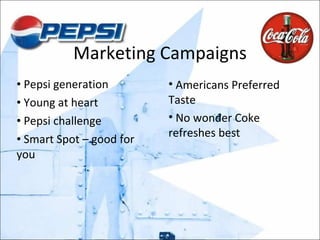
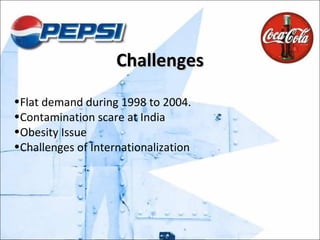
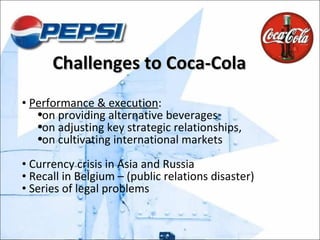
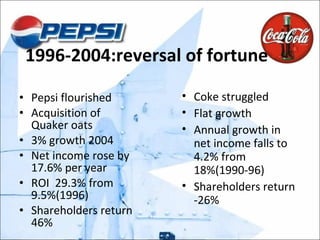
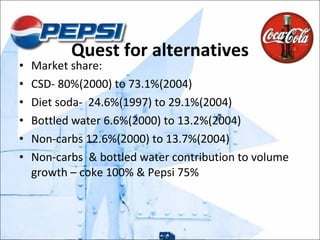
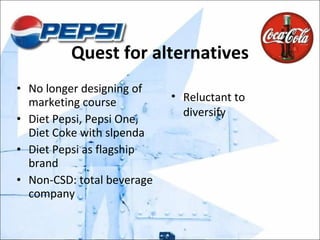
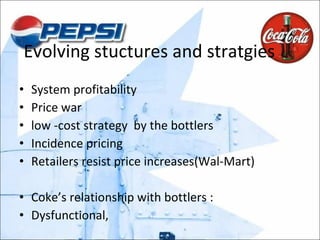
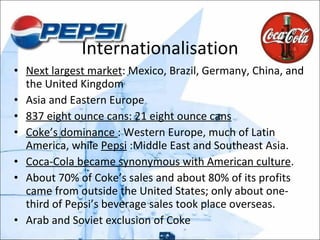
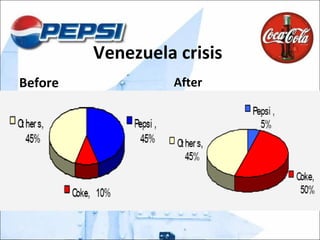
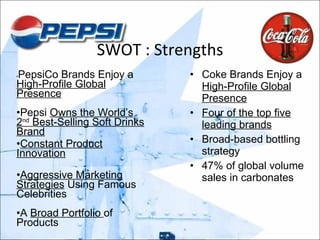
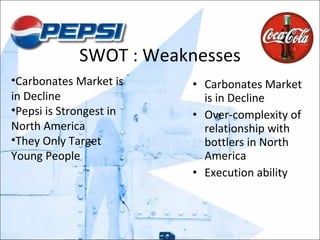
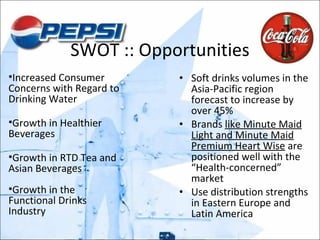
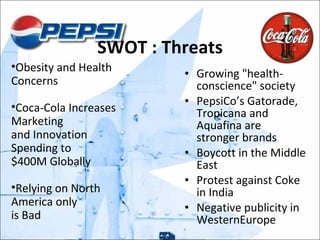
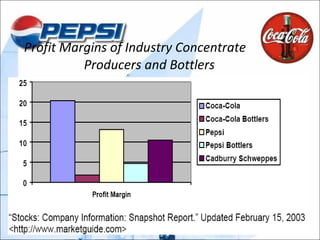
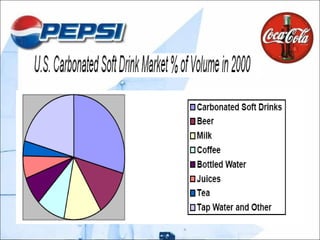
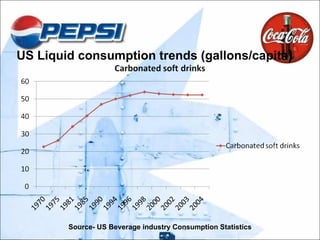
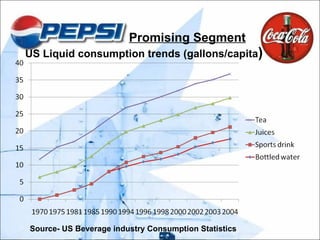

The Coca-Cola and PepsiCo cola wars lasted from the 1950s to the 1990s as they battled for dominance in the US soft drink market. In the 21st century, both companies faced new challenges as carbonated soft drink sales began to flatten. They explored ways to boost domestic sales through innovation and boost revenue through profitable new beverages as consumer preferences shifted towards healthier options. While Coca-Cola struggled with execution issues, PepsiCo flourished through acquisitions and international expansion, gaining global market share over its rival. Both companies addressed slowing cola sales by diversifying their product portfolios and pursuing growth in non-carbonated drinks and bottled water.


![Coca Cola Presentation[1]](https://cdn.slidesharecdn.com/ss_thumbnails/cocacolapresentation1-12796581248162-phpapp01-thumbnail.jpg?width=640&height=640&fit=bounds)


