Download as PDF, PPTX
![About You
0 Knowledge of [any] MULTI-INCIDENT analysis 10](https://image.slidesharecdn.com/cpsi-incidentanalysislearningseries-module06-20130221-130225164049-phpapp01/85/Module-6-Multi-Incident-Analysis-Method-6-320.jpg)
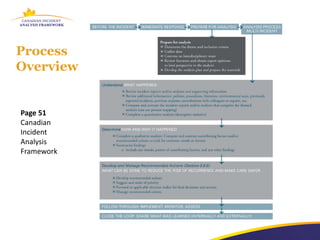

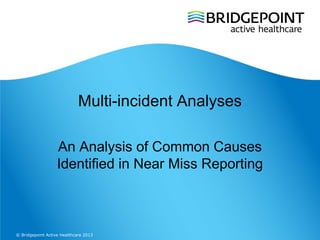
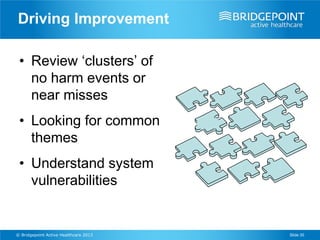
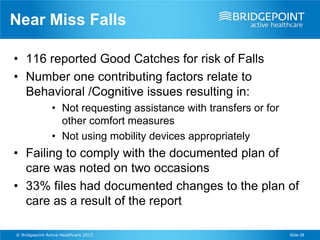


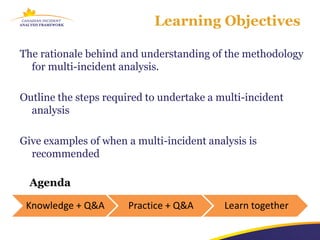
The document outlines a multi-incident analysis learning program aimed at improving patient safety through systematic analysis of incidents. It covers methodologies for analyzing both homogeneous and heterogeneous incidents, identifying contributing factors, and developing recommendations to reduce risks. The program emphasizes the importance of interdisciplinary collaboration and sharing lessons learned to enhance safety practices.


![Tpm .ppt [compatibility mode]](https://cdn.slidesharecdn.com/ss_thumbnails/tpm-181119030924-thumbnail.jpg?width=640&height=640&fit=bounds)


![CTEV [ clubfoot] DR ARUN LAL ,DR MOHAMED ASHRAF travancore medical college k...](https://cdn.slidesharecdn.com/ss_thumbnails/ctevclubfootdrarunlaldrmohamedashraftravancoremedicalcollegekollamkeralaindia-260208063247-18fc466c-thumbnail.jpg?width=640&height=640&fit=bounds)


![ONFH[AVN HIP] -TRIPLE REGIME -A NOVAL SURGICAL CONCEPT .pptx](https://cdn.slidesharecdn.com/ss_thumbnails/onfhavnhip2026koaconcalicutdrgokuldevdrmashraf-260210064517-213ec005-thumbnail.jpg?width=640&height=640&fit=bounds)


