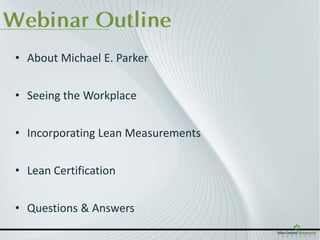
Materials & Information
FLOW MAPPING                    Your Partner For
                          Value-Centered Solutions


 WELCOME
Webinar Outline
 • About Michael E. Parker


 • Seeing the Workplace


 • Incorporating Lean Measurements


 • Lean Certification


 • Questions & Answers
Materials & Information
FLOW MAPPING                    Your Partner For
                          Value-Centered Solutions

About Michael E. Parker
B.S. Operations & Procurement

M.B.A in Management Science

1st Generation Lean Expertise

Handpicked by Akio Toyoda

Author & Award Winning
Entrepreneur
Materials & Information
FLOW MAPPING                    Your Partner For
                          Value-Centered Solutions

Seeing The Workplace
• After understanding the principles of
  lean the next step is to grasp the
  current condition of the workplace.
• Material and Information Flow Maps
  are developed to analyze the
  workplace.
                                        To improve a
• When mapping out the value stream it value stream
  is good to begin from left to right.  you must first
                                        OBSERVE and
• It is important to use your core team understand it.
  to gather accurate data based on the
  true condition of the workplace
Seeing The Workplace
• Determine individual assignments for the project team.
• Key Roles on the Project Team
   – Recorder to draw on flipchart, whiteboard, or piece of paper
   – Facilitator to keep meeting and project on schedule
   – Timekeeper to be responsible for collecting accurate cycle times
     and queue times
      • And any other relevant data

• Determine the main processes for the value stream being
  focused on.
   – Draw a rough sketch of the entire value stream involving the
     whole team
   – Ensure everyone has the same value stream perspective.
Seeing The Workplace


    Supplier                                      Customer


                Process   Process       Process
                   A         B             C
               upstream             downstream
Seeing The Workplace
• Go to where the action is               Utilize the GO-GO
   – You must understand where you
     are before you can decide where          Philosophy
     you want to go                       Go see, go hear, go touch,
       • Don’t rush through this step
   – You will have to make changes         go smell, and go taste
     along the way                         Genchi-Genbutsu
   – Don’t assume anything or use
     “standard data”.
   – Let the workplace speak for itself
   – Use a stopwatch
   – Focus on the most accurate and
     useful information
   – Think in terms of “flow”. Observe
     how work units and information
     move upstream and downstream
   – CRITICAL: Try not to think about
     solutions
Seeing The Workplace
• Always collect the following data:
  – Total time per workday
  – Regularly planned downtime (meetings, lunch, breaks, etc.)
  – Available time: subtract regularly planned downtime from total
    time
  – Number of people working in the process
  – Quantity of work performed in one day by one person
  – Frequency at which work is delivered to the next process
  – Cycle time - the time it takes to perform a process one time or for
    one work unit to be processed
  – Queue time - the amount of time a work unit will wait before a
    downstream process is ready to work on it
Seeing The Workplace

                                                          Information
Supplier


           Process            Process            Process                Process            Process
              A      Queue       B      Queue       C         Queue        D      Queue       E
             Cycle              Cycle               Cycle                 Cycle            Cycle


           Process            Process            Process               Process             Process
              J       Queue
                                 I       Queue      H         Queue       G        Queue
                                                                                              F
            Cycle              Cycle              Cycle                  Cycle                Cycle


           Process            Process            Process
              K       Queue
                                 L       Queue
                                                   M           Queue    Customer
             Cycle              Cycle               Cycle
Materials & Information
FLOW MAPPING                    Your Partner For
                          Value-Centered Solutions

Lean Measurements
Incorporating Lean Measurements
• After creating your material and information flow map and gathering
  data we are ready to identify the best lean metrics to assist in
  achieving our lean goals.

• The best way to get people to contribute to lean initiatives is to give
  them a simple means of understanding the impact of their
  improvement activities

         Lean metrics help drive
         continuous improvement
         and waste elimination.
Incorporating Lean Measurements
• Lean measurements should be based on the seven
  deadly wastes.
• As we dig deeper into the value stream, we can
  break measurements down into smaller pieces.
• For example, total order cycle time could include
  the following:
  – Time spent waiting, walking, entering data, retrieving
    files, opening mail, and processing.
Incorporating Lean Measurements

     A             B               C              D               E
    5m     +     10m       +      10m +           15m      +      5m = 45m

         Queue           Queue            Queue           Queue
          Time            Time             Time            Time
 Cycle           Cycle            Cycle           Cycle                 TOTAL
 Time            Time             Time            Time                LEAD TIME

         240m + 480m              + 480m          +   480m = 1680m

   Total Cycle Time = 45m + Total Queue Time of 1680
                  = Total Lead Time of 1725
                         M = minutes
                         240m = 4 hrs (1/2 day)
                         480m = 8 hrs (1 day)
Incorporating Lean Measurements
• Total lead time is 1725 minutes
• Total lead time in hours
   – 1725/60 minutes = 28.75 hours

• Total lead time in workdays
   – 28.75/8 hours = 3.59 workdays


           Value Added Percentage
     Total cycle time divided by total lead time - 45/1725 = 2.6%

   2.6% of total lead time is spent on value adding activities
LEAN FUNDAMENTALS         Your Partner For
                    Value-Centered Solutions

Certification
Curriculum Overview
1. Understanding the Toyota Production System (1.5h)

2. Identifying and Eliminating the 7 Forms of Waste (1.5h)

3. The Benefits of Level Scheduling (1.5h)

4. The Pull System Philosophy & Kanban (1.5h)

5. Just-In-Time (1.5h)

6. Built-In-Quality & Visual Control (1.5h)
                  6 Classes @ $99 each
                  Total Cost: $594
Early Bird Discount
     Early Bird Discount if you sign up by

           July 24, 2009:

        6 Classes @ $49 each

         Only $294
Prepay for Only $249.95
($44 off the discount)

  • Lean Fundamentals Certification
     1.   Understanding the Toyota Production System         Sessions
     2.   Identifying and Eliminating the 7 Forms of Waste
                                                             viewable
     3.   The Benefits of Level Scheduling
                                                               for 30
     4.   The Pull System Philosophy & Kanban
     5.   Just-In-Time
                                                                days
     6.   Built-In-Quality & Visual Control


               – Autographed copy of “Who Said So?”
                    (Valued at $19.95)

               – Free webinar on Standardization & Kaizen
                    (Valued at $99)
What Is This Worth??
• Total Value = $713
 – 6 Lean Fundamental Classes
 – 1 Bonus Class:
   Standardization & Kaizen
 – Autographed
   “Who Said So?” Book
This Is A Great Deal!!


   VALUE           If you prepay
                     by July 24

   $713           $249.95
Lean Certification                       Your Partner For
                                   Value-Centered Solutions

To Register Visit Us Online at:
vcminstitute.com
click “Products” then “Webinars”
Materials & Information
FLOW MAPPING                    Your Partner For
                          Value-Centered Solutions

Questions & Answers

Materials And Information Flow Map

  • 1.
    Materials & Information FLOWMAPPING Your Partner For Value-Centered Solutions WELCOME
  • 2.
    Webinar Outline •About Michael E. Parker • Seeing the Workplace • Incorporating Lean Measurements • Lean Certification • Questions & Answers
  • 3.
    Materials & Information FLOWMAPPING Your Partner For Value-Centered Solutions About Michael E. Parker
  • 4.
    B.S. Operations &Procurement M.B.A in Management Science 1st Generation Lean Expertise Handpicked by Akio Toyoda Author & Award Winning Entrepreneur
  • 5.
    Materials & Information FLOWMAPPING Your Partner For Value-Centered Solutions Seeing The Workplace
  • 6.
    Seeing The Workplace •After understanding the principles of lean the next step is to grasp the current condition of the workplace. • Material and Information Flow Maps are developed to analyze the workplace. To improve a • When mapping out the value stream it value stream is good to begin from left to right. you must first OBSERVE and • It is important to use your core team understand it. to gather accurate data based on the true condition of the workplace
  • 7.
    Seeing The Workplace •Determine individual assignments for the project team. • Key Roles on the Project Team – Recorder to draw on flipchart, whiteboard, or piece of paper – Facilitator to keep meeting and project on schedule – Timekeeper to be responsible for collecting accurate cycle times and queue times • And any other relevant data • Determine the main processes for the value stream being focused on. – Draw a rough sketch of the entire value stream involving the whole team – Ensure everyone has the same value stream perspective.
  • 8.
    Seeing The Workplace Supplier Customer Process Process Process A B C upstream downstream
  • 9.
    Seeing The Workplace •Go to where the action is Utilize the GO-GO – You must understand where you are before you can decide where Philosophy you want to go Go see, go hear, go touch, • Don’t rush through this step – You will have to make changes go smell, and go taste along the way Genchi-Genbutsu – Don’t assume anything or use “standard data”. – Let the workplace speak for itself – Use a stopwatch – Focus on the most accurate and useful information – Think in terms of “flow”. Observe how work units and information move upstream and downstream – CRITICAL: Try not to think about solutions
  • 10.
    Seeing The Workplace •Always collect the following data: – Total time per workday – Regularly planned downtime (meetings, lunch, breaks, etc.) – Available time: subtract regularly planned downtime from total time – Number of people working in the process – Quantity of work performed in one day by one person – Frequency at which work is delivered to the next process – Cycle time - the time it takes to perform a process one time or for one work unit to be processed – Queue time - the amount of time a work unit will wait before a downstream process is ready to work on it
  • 11.
    Seeing The Workplace Information Supplier Process Process Process Process Process A Queue B Queue C Queue D Queue E Cycle Cycle Cycle Cycle Cycle Process Process Process Process Process J Queue I Queue H Queue G Queue F Cycle Cycle Cycle Cycle Cycle Process Process Process K Queue L Queue M Queue Customer Cycle Cycle Cycle
  • 12.
    Materials & Information FLOWMAPPING Your Partner For Value-Centered Solutions Lean Measurements
  • 13.
    Incorporating Lean Measurements •After creating your material and information flow map and gathering data we are ready to identify the best lean metrics to assist in achieving our lean goals. • The best way to get people to contribute to lean initiatives is to give them a simple means of understanding the impact of their improvement activities Lean metrics help drive continuous improvement and waste elimination.
  • 14.
    Incorporating Lean Measurements •Lean measurements should be based on the seven deadly wastes. • As we dig deeper into the value stream, we can break measurements down into smaller pieces. • For example, total order cycle time could include the following: – Time spent waiting, walking, entering data, retrieving files, opening mail, and processing.
  • 15.
    Incorporating Lean Measurements A B C D E 5m + 10m + 10m + 15m + 5m = 45m Queue Queue Queue Queue Time Time Time Time Cycle Cycle Cycle Cycle TOTAL Time Time Time Time LEAD TIME 240m + 480m + 480m + 480m = 1680m Total Cycle Time = 45m + Total Queue Time of 1680 = Total Lead Time of 1725 M = minutes 240m = 4 hrs (1/2 day) 480m = 8 hrs (1 day)
  • 16.
    Incorporating Lean Measurements •Total lead time is 1725 minutes • Total lead time in hours – 1725/60 minutes = 28.75 hours • Total lead time in workdays – 28.75/8 hours = 3.59 workdays Value Added Percentage Total cycle time divided by total lead time - 45/1725 = 2.6% 2.6% of total lead time is spent on value adding activities
  • 17.
    LEAN FUNDAMENTALS Your Partner For Value-Centered Solutions Certification
  • 18.
    Curriculum Overview 1. Understandingthe Toyota Production System (1.5h) 2. Identifying and Eliminating the 7 Forms of Waste (1.5h) 3. The Benefits of Level Scheduling (1.5h) 4. The Pull System Philosophy & Kanban (1.5h) 5. Just-In-Time (1.5h) 6. Built-In-Quality & Visual Control (1.5h) 6 Classes @ $99 each Total Cost: $594
  • 19.
    Early Bird Discount Early Bird Discount if you sign up by July 24, 2009: 6 Classes @ $49 each Only $294
  • 20.
    Prepay for Only$249.95 ($44 off the discount) • Lean Fundamentals Certification 1. Understanding the Toyota Production System Sessions 2. Identifying and Eliminating the 7 Forms of Waste viewable 3. The Benefits of Level Scheduling for 30 4. The Pull System Philosophy & Kanban 5. Just-In-Time days 6. Built-In-Quality & Visual Control – Autographed copy of “Who Said So?” (Valued at $19.95) – Free webinar on Standardization & Kaizen (Valued at $99)
  • 21.
    What Is ThisWorth?? • Total Value = $713 – 6 Lean Fundamental Classes – 1 Bonus Class: Standardization & Kaizen – Autographed “Who Said So?” Book
  • 22.
    This Is AGreat Deal!! VALUE If you prepay by July 24 $713 $249.95
  • 23.
    Lean Certification Your Partner For Value-Centered Solutions To Register Visit Us Online at: vcminstitute.com click “Products” then “Webinars”
  • 24.
    Materials & Information FLOWMAPPING Your Partner For Value-Centered Solutions Questions & Answers