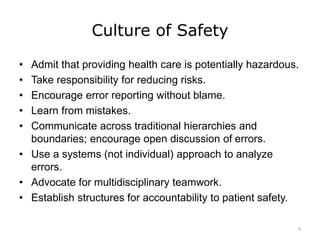
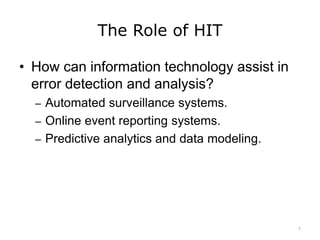
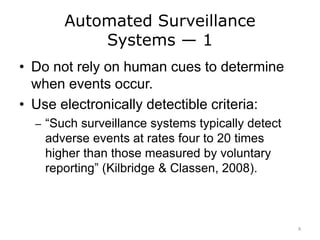
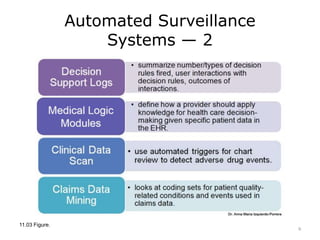
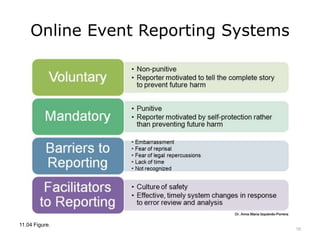
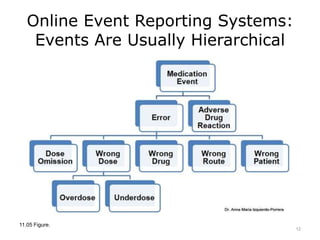
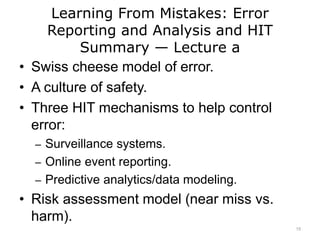
Quality Improvement
Learning From Mistakes: Error
Reporting and Analysis and HIT
Lecture a
This material (Comp 12 Unit 11) was developed by Johns Hopkins University, funded by the Department of
Health and Human Services, Office of the National Coordinator for Health Information Technology under
Award Number IU24OC000013. This material was updated in 2016 by Johns Hopkins University under
Award Number 90WT0005.
This work is licensed under the Creative Commons Attribution-NonCommercial-ShareAlike 4.0 International
License. To view a copy of this license, visit http://creativecommons.org/licenses/by-nc-sa/4.0/.
Learning From Mistakes: Error
Reporting and Analysis and HIT
Learning Objectives — Lecture a
• Explain how reporting errors can help to
identify HIT system issues.
• Describe ways in which HIT can facilitate
error reporting and detection.
2
Learning from Mistakes
• “A new delivery system must be built to
achieve substantial improvements in
patient safety — a system that is capable
of preventing errors from occurring in the
first place, while at the same time
incorporating lessons learned from any
errors that do occur” (IOM, 2004).
Source: IOM (Institute of Medicine), 2012.
3
A Medication Error Story
11.01 Figure.
4
How Can Technology Help?
11.02 Figure.
5
Culture of Safety
• Admit that providing health care is potentially hazardous.
• Take responsibility for reducing risks.
• Encourage error reporting without blame.
• Learn from mistakes.
• Communicate across traditional hierarchies and
boundaries; encourage open discussion of errors.
• Use a systems (not individual) approach to analyze
errors.
• Advocate for multidisciplinary teamwork.
• Establish structures for accountability to patient safety.
6
The Role of HIT
• How can information technology assist in
error detection and analysis?
– Automated surveillance systems.
– Online event reporting systems.
– Predictive analytics and data modeling.
7
Automated Surveillance
Systems — 1
• Do not rely on human cues to determine
when events occur.
• Use electronically detectible criteria:
– “Such surveillance systems typically detect
adverse events at rates four to 20 times
higher than those measured by voluntary
reporting” (Kilbridge & Classen, 2008).
8
Automated Surveillance
Systems — 2
11.03 Figure.
9
Online Event Reporting Systems
11.04 Figure.
10
Event Reporting Taxonomies
• Patient:
– Medication error.
– Adverse drug reactions (not
medication error).
– Equipment/supplies/devices.
– Error related to
procedure/treatment/test.
– Complication of
procedure/treatment/test.
– Transfusion.
– Behavioral.
– Skin integrity.
– Care coordination/records.
– Other.
• Staff and visitors:
– Assault by patient.
– Assault by staff.
– Assault by visitor.
– Exposure to blood or body
fluids.
– Exposure to chemicals or
drugs.
– Fall.
– Injury while lifting or moving.
– Other (University Health
Consortium, 2004).
11
Online Event Reporting Systems:
Events Are Usually Hierarchical
11.05 Figure.
12
Predictive Analytics
• Good for large complex data sets.
• Use rules of logic to predict outcomes based on the
presence of certain identified conditions.
• Help us find associations among variables that could be
useful in future decision making.
11.06 Figure.
13
Types of Outcome
• Near Miss • Harm
11.07 Figure.
14
Learning From Mistakes: Error
Reporting and Analysis and HIT
Summary — Lecture a
• Swiss cheese model of error.
• A culture of safety.
• Three HIT mechanisms to help control
error:
– Surveillance systems.
– Online event reporting.
– Predictive analytics/data modeling.
• Risk assessment model (near miss vs.
harm).
15
Learning From Mistakes: Error
Reporting and Analysis and HIT
References — Lecture a — 1
References
Agency for Healthcare Research and Quality. (2016). Failure mode and effects analysis. Retrieved
June 3, 2016, from https://healthit.ahrq.gov/health-it-tools-and-resources/workflow-assessment-
health-it-toolkit/all-workflow-tools/fmea-analysis
Agency for Healthcare Research and Quality, Patient Safety Network. (2016). Glossary. Retrieved
June 3, 2016, from https://psnet.ahrq.gov/glossary
IOM (Institute of Medicine). (2012). Health IT and Patient Safety: Building Safer Systems for Better
Care. Washington, DC: The National Academies Press. Retrieved June 9, 2016 from
http://www.nap.edu/read/13269/chapter/1 .
Kilbridge, P. M., & Classen, D. C. (2008). The informatics opportunities at the intersection of patient
safety and clinical informatics. Journal of the American Medical Informatics Association, 15(4),
397–407. Epub 2008 Apr 24.
Reason, J. (2000). Human error: Models and management. BMJ, 320, 768–770.
Charts, Tables, Figures
11.01 Figure: Swiss Cheese Model 1. Adapted by Dr. Peter Pronovost from original in Reason, J.
(2000). Human error: Models and management. BMJ, 320, 768–770.
16
Learning From Mistakes: Error
Reporting and Analysis and HIT
References — Lecture a — 2
Charts, Tables, Figures
11.02 Figure: Swiss Cheese Model 2. Adapted by Dr. Peter Pronovost from original in Reason, J.
(2000). Human error: Models and management. BMJ, 320, 768–770.
11.03 Figure: Automated Surveillance Systems. Dr. Anna Maria Izquierdo-Porrera.
11.04 Figure: Online Event Reporting Systems. Dr. Anna Maria Izquierdo-Porrera.
11.05 Figure: Events Are Usually Hierarchical. Dr. Anna Maria Izquierdo-Porrera.
11.06 Figure: Predictive Analytics Example. Dr. Anna Maria Izquierdo-Porrera.
11.07 Figure: Types of Outcomes. Dr. Anna Maria Izquierdo-Porrera.
17
Quality Improvement
Learning From Mistakes: Error
Reporting and Analysis and HIT
Lecture a
This material (Comp 12 Unit 11) was developed
by Johns Hopkins University, funded by the
Department of Health and Human Services,
Office of the National Coordinator for Health
Information Technology under Award Number
IU24OC000013. This material was updated in
2016 by Johns Hopkins University under Award
Number 90WT0005.
18

Lecture 11A

  • 1.
    Quality Improvement Learning FromMistakes: Error Reporting and Analysis and HIT Lecture a This material (Comp 12 Unit 11) was developed by Johns Hopkins University, funded by the Department of Health and Human Services, Office of the National Coordinator for Health Information Technology under Award Number IU24OC000013. This material was updated in 2016 by Johns Hopkins University under Award Number 90WT0005. This work is licensed under the Creative Commons Attribution-NonCommercial-ShareAlike 4.0 International License. To view a copy of this license, visit http://creativecommons.org/licenses/by-nc-sa/4.0/.
  • 2.
    Learning From Mistakes:Error Reporting and Analysis and HIT Learning Objectives — Lecture a • Explain how reporting errors can help to identify HIT system issues. • Describe ways in which HIT can facilitate error reporting and detection. 2
  • 3.
    Learning from Mistakes •“A new delivery system must be built to achieve substantial improvements in patient safety — a system that is capable of preventing errors from occurring in the first place, while at the same time incorporating lessons learned from any errors that do occur” (IOM, 2004). Source: IOM (Institute of Medicine), 2012. 3
  • 4.
    A Medication ErrorStory 11.01 Figure. 4
  • 5.
    How Can TechnologyHelp? 11.02 Figure. 5
  • 6.
    Culture of Safety •Admit that providing health care is potentially hazardous. • Take responsibility for reducing risks. • Encourage error reporting without blame. • Learn from mistakes. • Communicate across traditional hierarchies and boundaries; encourage open discussion of errors. • Use a systems (not individual) approach to analyze errors. • Advocate for multidisciplinary teamwork. • Establish structures for accountability to patient safety. 6
  • 7.
    The Role ofHIT • How can information technology assist in error detection and analysis? – Automated surveillance systems. – Online event reporting systems. – Predictive analytics and data modeling. 7
  • 8.
    Automated Surveillance Systems —1 • Do not rely on human cues to determine when events occur. • Use electronically detectible criteria: – “Such surveillance systems typically detect adverse events at rates four to 20 times higher than those measured by voluntary reporting” (Kilbridge & Classen, 2008). 8
  • 9.
  • 10.
    Online Event ReportingSystems 11.04 Figure. 10
  • 11.
    Event Reporting Taxonomies •Patient: – Medication error. – Adverse drug reactions (not medication error). – Equipment/supplies/devices. – Error related to procedure/treatment/test. – Complication of procedure/treatment/test. – Transfusion. – Behavioral. – Skin integrity. – Care coordination/records. – Other. • Staff and visitors: – Assault by patient. – Assault by staff. – Assault by visitor. – Exposure to blood or body fluids. – Exposure to chemicals or drugs. – Fall. – Injury while lifting or moving. – Other (University Health Consortium, 2004). 11
  • 12.
    Online Event ReportingSystems: Events Are Usually Hierarchical 11.05 Figure. 12
  • 13.
    Predictive Analytics • Goodfor large complex data sets. • Use rules of logic to predict outcomes based on the presence of certain identified conditions. • Help us find associations among variables that could be useful in future decision making. 11.06 Figure. 13
  • 14.
    Types of Outcome •Near Miss • Harm 11.07 Figure. 14
  • 15.
    Learning From Mistakes:Error Reporting and Analysis and HIT Summary — Lecture a • Swiss cheese model of error. • A culture of safety. • Three HIT mechanisms to help control error: – Surveillance systems. – Online event reporting. – Predictive analytics/data modeling. • Risk assessment model (near miss vs. harm). 15
  • 16.
    Learning From Mistakes:Error Reporting and Analysis and HIT References — Lecture a — 1 References Agency for Healthcare Research and Quality. (2016). Failure mode and effects analysis. Retrieved June 3, 2016, from https://healthit.ahrq.gov/health-it-tools-and-resources/workflow-assessment- health-it-toolkit/all-workflow-tools/fmea-analysis Agency for Healthcare Research and Quality, Patient Safety Network. (2016). Glossary. Retrieved June 3, 2016, from https://psnet.ahrq.gov/glossary IOM (Institute of Medicine). (2012). Health IT and Patient Safety: Building Safer Systems for Better Care. Washington, DC: The National Academies Press. Retrieved June 9, 2016 from http://www.nap.edu/read/13269/chapter/1 . Kilbridge, P. M., & Classen, D. C. (2008). The informatics opportunities at the intersection of patient safety and clinical informatics. Journal of the American Medical Informatics Association, 15(4), 397–407. Epub 2008 Apr 24. Reason, J. (2000). Human error: Models and management. BMJ, 320, 768–770. Charts, Tables, Figures 11.01 Figure: Swiss Cheese Model 1. Adapted by Dr. Peter Pronovost from original in Reason, J. (2000). Human error: Models and management. BMJ, 320, 768–770. 16
  • 17.
    Learning From Mistakes:Error Reporting and Analysis and HIT References — Lecture a — 2 Charts, Tables, Figures 11.02 Figure: Swiss Cheese Model 2. Adapted by Dr. Peter Pronovost from original in Reason, J. (2000). Human error: Models and management. BMJ, 320, 768–770. 11.03 Figure: Automated Surveillance Systems. Dr. Anna Maria Izquierdo-Porrera. 11.04 Figure: Online Event Reporting Systems. Dr. Anna Maria Izquierdo-Porrera. 11.05 Figure: Events Are Usually Hierarchical. Dr. Anna Maria Izquierdo-Porrera. 11.06 Figure: Predictive Analytics Example. Dr. Anna Maria Izquierdo-Porrera. 11.07 Figure: Types of Outcomes. Dr. Anna Maria Izquierdo-Porrera. 17
  • 18.
    Quality Improvement Learning FromMistakes: Error Reporting and Analysis and HIT Lecture a This material (Comp 12 Unit 11) was developed by Johns Hopkins University, funded by the Department of Health and Human Services, Office of the National Coordinator for Health Information Technology under Award Number IU24OC000013. This material was updated in 2016 by Johns Hopkins University under Award Number 90WT0005. 18

Editor's Notes

  • #2 Welcome to Quality Improvement: Learning From Mistakes: Error Reporting and Analysis and HIT. This is Lecture a. The focus of the next three segments is on learning from mistakes. The first segment discusses the role of HIT in error detection and reporting.
  • #3 The Objectives for Learning From Mistakes: Error Reporting and Analysis and HIT are to: Be able to explain how reporting errors can help to identify HIT system issues. Describe ways in which HIT can facilitate error reporting and detection. Just as HIT can be used to facilitate detection and reporting of error and learning from mistakes due to these errors, the design of HIT and the way that users interact with HIT can actually contribute to medical error. By the end of this unit, you will also be able to assess HIT for unintended negative consequences as well as examine common themes in HIT design deficiencies.
  • #4 Mistakes happen. The Institute of Medicine (IOM) surprised most people in 1999 when it published astounding medical error statistics. In 2004, the IOM advised the health care community that it must build a new delivery system to achieve large improvements in patient safety, and the health system itself needed to be capable of preventing errors from occurring in the first place, while at the same time incorporating lessons learned from errors that do occur despite our best efforts. IOM published another report in 2011, pointing out the role of HIT in patient safety and building safer systems for better care. These points are incorporated in the quote from the IOM Report on this slide: “A new delivery system must be built to achieve substantial improvements in patient safety — a system that is capable of preventing errors from occurring in the first place, while at the same time incorporating lessons learned from any errors that do occur.”
  • #5 Let’s take a classic medication error, using the “Swiss cheese model” of system failure proposed by James Reason. He likened the health care system to a stack of Swiss cheese slices, where each slice represents an action or event in the care delivery process. The holes in the cheese are places that a process can fail, despite everyone’s best intentions. Each cheese slice is a defensive layer in the process. When an error passes through one of the gaps in the line of defense, it usually bumps up against another defense. Sometimes, however, the Swiss cheese stacks line up, such that all of the “holes” are aligned, and the error reaches the patient, as in the case illustrated above in which a pharmacist fails to check a patient’s allergy status because the allergy history was not obtained, the prescriber wrote an order for a medication to which the patient was allergic, the nurse gave the patient the drug to which he or she was allergic, and the patient arrests and dies.
  • #6 In the kitchen, each slice of cheese that you add to the stack introduces a new layer that potentially covers one or more holes in the slices below. In health care, we may need several Swiss cheese slices. Take this slide, for example. When the patient forgot to mention that he had a drug allergy, a hole appears, and the potential for risk is increased. If the allergy had been documented in the electronic record at a previous visit, when the prescriber entered the order in CPOE, the system would trigger an alert, telling the prescriber that the patient is allergic to the drug. The system provides a defensive layer. Should the prescriber choose to override the alert and still order the drug, the pharmacy system could alert the pharmacist to the allergy, and the pharmacist, who reviews all medication orders, would call the prescriber to discuss. Again, a defensive layer is put into place by technology.
  • #7 Throughout this course, you have learned a lot about a culture of safety and what such a culture entails. You have learned that we in health care need to admit that providing health care is potentially dangerous. We need to take responsibility for reducing errors and risk of preventable safety events. Blame-free error reporting and learning from mistakes are integral to a safety culture in health care. During the course of this task, we find ourselves needing to communicate across traditional hierarchies and boundaries in an open environment. We strive to use a systems approach to error analysis, advocate for interdisciplinary teamwork, and we put into place structures to assure accountability for patient safety.
  • #8 Let’s talk a bit about the role of HIT in error detection and analysis. How can HIT assist us to learn from our mistakes? We will discuss three mechanisms by which HIT helps to detect and analyze errors. These include: automated surveillance systems, online event reporting systems, and predictive analytics and data modeling.
  • #9 Automated surveillance systems use electronically detectable criteria and rules to determine when potential or actual safety events occur. These systems don’t rely solely on human cues, often missing when clinicians get too busy to detect early warning signs of impending safety events.
  • #10 Decision support logs summarize the numbers and types of decision rules fired, the interactions of the user with the decision rules, and the outcomes of these interactions. For example, if we have a decision rule that warns providers of inappropriate dosing of a drug for particular patient types, based on, say, their kidney function, the decision support logs can tell us the number of times this rule fired as well as the number of times the prescriber either changed or failed to change the drug. Events can be monitored in the electronic medical record by using medical logic modules, also known as MLMs. Each MLM is an independent unit (such as a single data point) in a health knowledgebase that takes the knowledge required (for example, a laboratory value) and combines this with a definition of the way in which the health care provider should apply this knowledge for a single health care decision. For example, an MLM could keep watch for instances in which a patient’s hematocrit (or red blood cell count) is low, warning providers of new or worsening anemia. In addition, automated surveillance of certain codified diagnosis (e.g., in International Classification of Disease [or ICD]-10 or SNOMED CT codes), new medication orders, or laboratory results using MLMs can identify the presence of possible adverse drug events. For example, if a patient is receiving vitamin K and is on a blood thinner, then the potential for an adverse drug event may be present if the required dose adjustment is not done and the desired level of blood thinning is not monitored more closely. Sample triggers in ambulatory care settings can use free-text searching of the outpatient notes to detect adverse drug events. For example, for patients who are taking diuretic drugs to get rid of excess body fluid, the notes may be scanned for: Fatigue (expanding the search using synonyms such as drowsiness, or tired, or lethargic). Dizziness (using synonyms like syncope, or lightheadedness, or vertigo, or “wooziness”). Low blood pressure (using the synonyms of hypotension and decreased blood pressure). Automated surveillance can also be used to improve quality by identifying gaps in care by not following recommended guidelines. Claims data, such as Medicare claims data, can be mined to detect whether patients are adhering to preventive guidelines, such as whether patients with diabetes have received their eye examinations, appropriate blood tests, pneumococcal and flu vaccines, and other screening tests as recommended by clinical practice guidelines for this population.
  • #11 Paper-based voluntary reporting of adverse events has been in existence for quite some time. Online reporting has replaced paper reporting recently, although it is still voluntary. These systems allow for anonymous reporting if the reporter so desires. Nonpunitive and confidential voluntary reporting systems provide useful information about errors and are more likely to become culturally acceptable by health care providers. Some states have mandatory reporting programs for errors resulting in serious harm. These programs are viewed as punitive, since their intent is more often to provide data for public reporting and may be used to punish individuals or organizations. Individuals are not motivated to be thorough in their reports, but rather are often driven by self-protection due to the fear of reprisal. The information reported through these systems is usually managed by someone who is removed from the front line and generally only contains the information required. The rest of the story is never documented, nor is it available for review and analysis for the broad goal of error reduction. Kilbridge and Classen tell us that automated surveillance systems typically detect adverse events at rates four to 20 times higher than those measured by voluntary reporting.
  • #12 Most adverse events voluntary electronic reporting systems are configured for reporting of a broad array of event types that affect both patients and staff. Here is a list of broad patient-level events. There are events that are noted as clear errors, such as medication errors, or errors related to a procedure, treatment, or test. But you also see such events as patient falls and skin integrity issues, often due to inadequate risk assessment screening and institution of preventive measures. Event reporting systems also include defects in equipment, supplies, and devices. Furthermore, they include adverse drug reactions, behavioral events, and complications of procedures, treatments, and tests that are not necessarily attributable to error. Finally, they include care coordination issues that place the patient at risk. Each of these broad event types is potentially preventable; we can learn from them by analyzing the systems and processes surrounding the event. Regarding reporting events for staff and visitors, event reporting systems allow for reporting of assault by patients, staff, or visitors; exposure to body fluids or chemicals; staff and visitor falls; and injuries that occur when staff are lifting or moving patients or equipment.
  • #13 Events are usually hierarchical, to distinguish events that fall within the same broad category. Here is an example of how medication events can be categorized. Medication events can either be an error or an adverse drug reaction that is not the result of an error. We will want to look more closely at those that are in error. There are lots of types of medication errors, because the medication process is extremely complex and lots of people receive lots of medications in both inpatient and community settings. So we will want to look at the specific type of medication error, such as when the patient doesn’t receive an ordered drug dose, or when he receives too much or too little of a drug that has been ordered for him. We want to look at circumstances around events where a drug is given by the wrong route, the wrong drug is given altogether, or a medication is given to the wrong patient.
  • #14 Health care data repositories consist of unprecedented amounts of clinical and administrative data that provide a rich resource for us to learn from our mistakes. Predictive analytics uses statistics and logic to predict outcomes based on the presence of certain predetermined conditions. This allows us to see associations among clinical characteristics and risk of complications or adverse events. Here is a simple example. There is a lot of evidence that high blood pressure and being overweight increases a person’s risk of having a heart attack. If the electronic system has a rule that looks for all patients who have a measurably high blood pressure and a measurably high weight, then it could provide us with information on which patients are a high risk for heart attack, and we can target this population for preventive measures. If we want to detect quality concerns, we can use this very same process. For example, predictive modeling could be used to accurately identify elderly patients in a community with a high likelihood of readmission — either readmission to the hospital or return to the emergency department. If we knew who was more likely to be readmitted, we could target interventions to expedite the admission process and reduce overcrowding in emergency departments, thereby improving timeliness and efficiency of care.
  • #15 It’s common to incorporate a risk assessment model into event reporting systems. This model is used as a tool for priority setting, as well as to track outcomes. In addition to a harm category (with subcategories of temporary harm, permanent harm, and death), most systems include a category for “near misses” or circumstances that had the capacity to cause harm. This can include situations in which there was no error at all, but a risky situation was noted and fixed, such as noting that the emergency drug box had not been replaced. The Agency for Healthcare Research and Quality (AHRQ) refers to a “near-miss” as an event that occurs but that luckily does not cause patient injury. An example of this type of “luck” may be a patient getting the wrong medication but that the medication is harmless. For example, if patient A is supposed to be given one baby aspirin every day, and, accidentally, patient B is administered the aspirin instead, chances are, patient B will not have untoward effect (unless he is allergic to aspirin or if aspirin is contraindicated for patient B) — so this is considered a “near miss” or a close call.
  • #16 This concludes Lecture a of Learning From Mistakes: Error Reporting and Analysis and HIT. In summary, we discussed the Swiss cheese model of error put forth by James Reason. Recall we said that error occurs when the holes in the Swiss cheese all line up, or when all of the safeguards that we put in place to try and prevent error fail. We talked about how health IT can be used to help strengthen those safeguards and reduce errors to a minimum, recognizing that we may not be able to completely remove all possible error from any complex system. A culture of safety is one in which we understand the inevitability of error and assume the responsibility for the roles that we all play in error — both causation and prevention. The three mechanisms by which HIT helps to detect and analyze errors that we discussed included automated surveillance systems, online event reporting systems, and predictive analytics and data modeling. Finally, we discussed a risk assessment model, where we differentiated between the characteristics of a near miss and harm — illustrating the escalating levels, from a simple near miss without preventable error to a full-blown error that results in death.
  • #17 No audio.
  • #18 No audio.
  • #19 No audio.