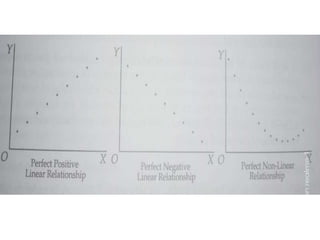
Ch – 10 SIMPLE LINEAR CORRELATION
Lecture compiled by
Dr. Parminder Kaur
Assistant Professor
Department of Commerce
For B.Com(Prog) II Sem Sec A
SIMPLE LINEAR CORRELATION
DEFINITION OF CORRELATION
• “If two or more quantities vary in sympathy so
that movements in one tend to be
accompanied by corresponding movements in
other(s) then they are said to be correlated.”
Or
• “Correlation is an analysis of co-variation
between two or more variables.”
TYPES OF CORRELATION
• The following are different types of
correlation:
• Positive and Negative Correlation
• Simple, Partial and Multiple Correlation
• Linear and Non-linear Correlation
Positive and Negative Correlation
• The correlation between two variables is said
to be positive or direct if an increase (or a
decrease) in one variable corresponds to an
increase (or a decrease) in the other.
• The correlation between two variables is said
to be negative or inverse if an increase (or a
decrease) corresponds to a decrease (or an
increase) in the other.
Simple, Partial and Multiple Correlation
• Simple Correlation: It involves the study of only two variables. For
example, when we study the correlation between the price and
demand of a product, it is a problem of simple correlation.
• Partial Correlation: It involves the study of three or more variables,
but considers only two variables to be influencing each other. For
example, if we consider three variables, namely yield of wheat,
amount of rainfall and amount of fertilizers and limit our correlation
analysis to yield and rainfall, with the effect of fertilizers removed, it
becomes a problem relating to partial correlation only.
• Multiple Correlation: It involves the study of three or more
variables simultaneously. For example, if we study the relationship
between the yield of wheat per acre and both amount of rainfall
and the amount of fertilizers used, it becomes a problem relating to
multiple correlation.
Linear and Non-linear Correlation
• Linear Correlation: The correlation between two
variables is said to be linear if the amount of
change in one variable tends to bear a constant
ratio to the amount of change in other variable.
• Non-linear (or Curvilinear): The correlation
between two variables is said to be non-linear or
curvilinear if the amount of change in one
variable does not bear a constant ratio to the
amount of change in other variable.
METHODS OF STUDYING
CORRELATION
• Scatter Diagram Method
• Karl Pearson’s Coefficient of
Correlation, and
• Rank Correlation Method
Scatter Diagram Method
• A scatter diagram of the data helps in having a
visual idea about the nature of association
between two variables. If the points cluster
along a straight line, the association between
two variables is linear. Further, if the points
cluster along a curve, the corresponding
association is non-linear or curvilinear. Finally,
if the points neither cluster along a straight
line nor along a curve, there is absence of any
association between the variables.
Covariance
• The covariance between X and Y, is denoted by Cov (X, Y)
Thankyou
Lecture sourced from
•Book “Business Mathematics and Statistics” by R. S. Bhardwaj
•Book “Business Mathematics and Statistics” by Dr. J. K. Thukral

Correlation.pptx

  • 1.
    Ch – 10SIMPLE LINEAR CORRELATION Lecture compiled by Dr. Parminder Kaur Assistant Professor Department of Commerce For B.Com(Prog) II Sem Sec A
  • 2.
    SIMPLE LINEAR CORRELATION DEFINITIONOF CORRELATION • “If two or more quantities vary in sympathy so that movements in one tend to be accompanied by corresponding movements in other(s) then they are said to be correlated.” Or • “Correlation is an analysis of co-variation between two or more variables.”
  • 3.
    TYPES OF CORRELATION •The following are different types of correlation: • Positive and Negative Correlation • Simple, Partial and Multiple Correlation • Linear and Non-linear Correlation
  • 4.
    Positive and NegativeCorrelation • The correlation between two variables is said to be positive or direct if an increase (or a decrease) in one variable corresponds to an increase (or a decrease) in the other. • The correlation between two variables is said to be negative or inverse if an increase (or a decrease) corresponds to a decrease (or an increase) in the other.
  • 5.
    Simple, Partial andMultiple Correlation • Simple Correlation: It involves the study of only two variables. For example, when we study the correlation between the price and demand of a product, it is a problem of simple correlation. • Partial Correlation: It involves the study of three or more variables, but considers only two variables to be influencing each other. For example, if we consider three variables, namely yield of wheat, amount of rainfall and amount of fertilizers and limit our correlation analysis to yield and rainfall, with the effect of fertilizers removed, it becomes a problem relating to partial correlation only. • Multiple Correlation: It involves the study of three or more variables simultaneously. For example, if we study the relationship between the yield of wheat per acre and both amount of rainfall and the amount of fertilizers used, it becomes a problem relating to multiple correlation.
  • 6.
    Linear and Non-linearCorrelation • Linear Correlation: The correlation between two variables is said to be linear if the amount of change in one variable tends to bear a constant ratio to the amount of change in other variable. • Non-linear (or Curvilinear): The correlation between two variables is said to be non-linear or curvilinear if the amount of change in one variable does not bear a constant ratio to the amount of change in other variable.
  • 7.
    METHODS OF STUDYING CORRELATION •Scatter Diagram Method • Karl Pearson’s Coefficient of Correlation, and • Rank Correlation Method
  • 8.
    Scatter Diagram Method •A scatter diagram of the data helps in having a visual idea about the nature of association between two variables. If the points cluster along a straight line, the association between two variables is linear. Further, if the points cluster along a curve, the corresponding association is non-linear or curvilinear. Finally, if the points neither cluster along a straight line nor along a curve, there is absence of any association between the variables.
  • 11.
    Covariance • The covariancebetween X and Y, is denoted by Cov (X, Y)
  • 12.
    Thankyou Lecture sourced from •Book“Business Mathematics and Statistics” by R. S. Bhardwaj •Book “Business Mathematics and Statistics” by Dr. J. K. Thukral